注意:以下翻译的准确性尚未经过验证。这是使用 AIP ↗ 从原始英文文本进行的机器翻译。
在代码中评估模型
在 Foundry 中,可以通过为模型创建一个或多个 MetricSets 来在代码中评估单个模型的性能。本页假设您已了解 MetricSet 类。
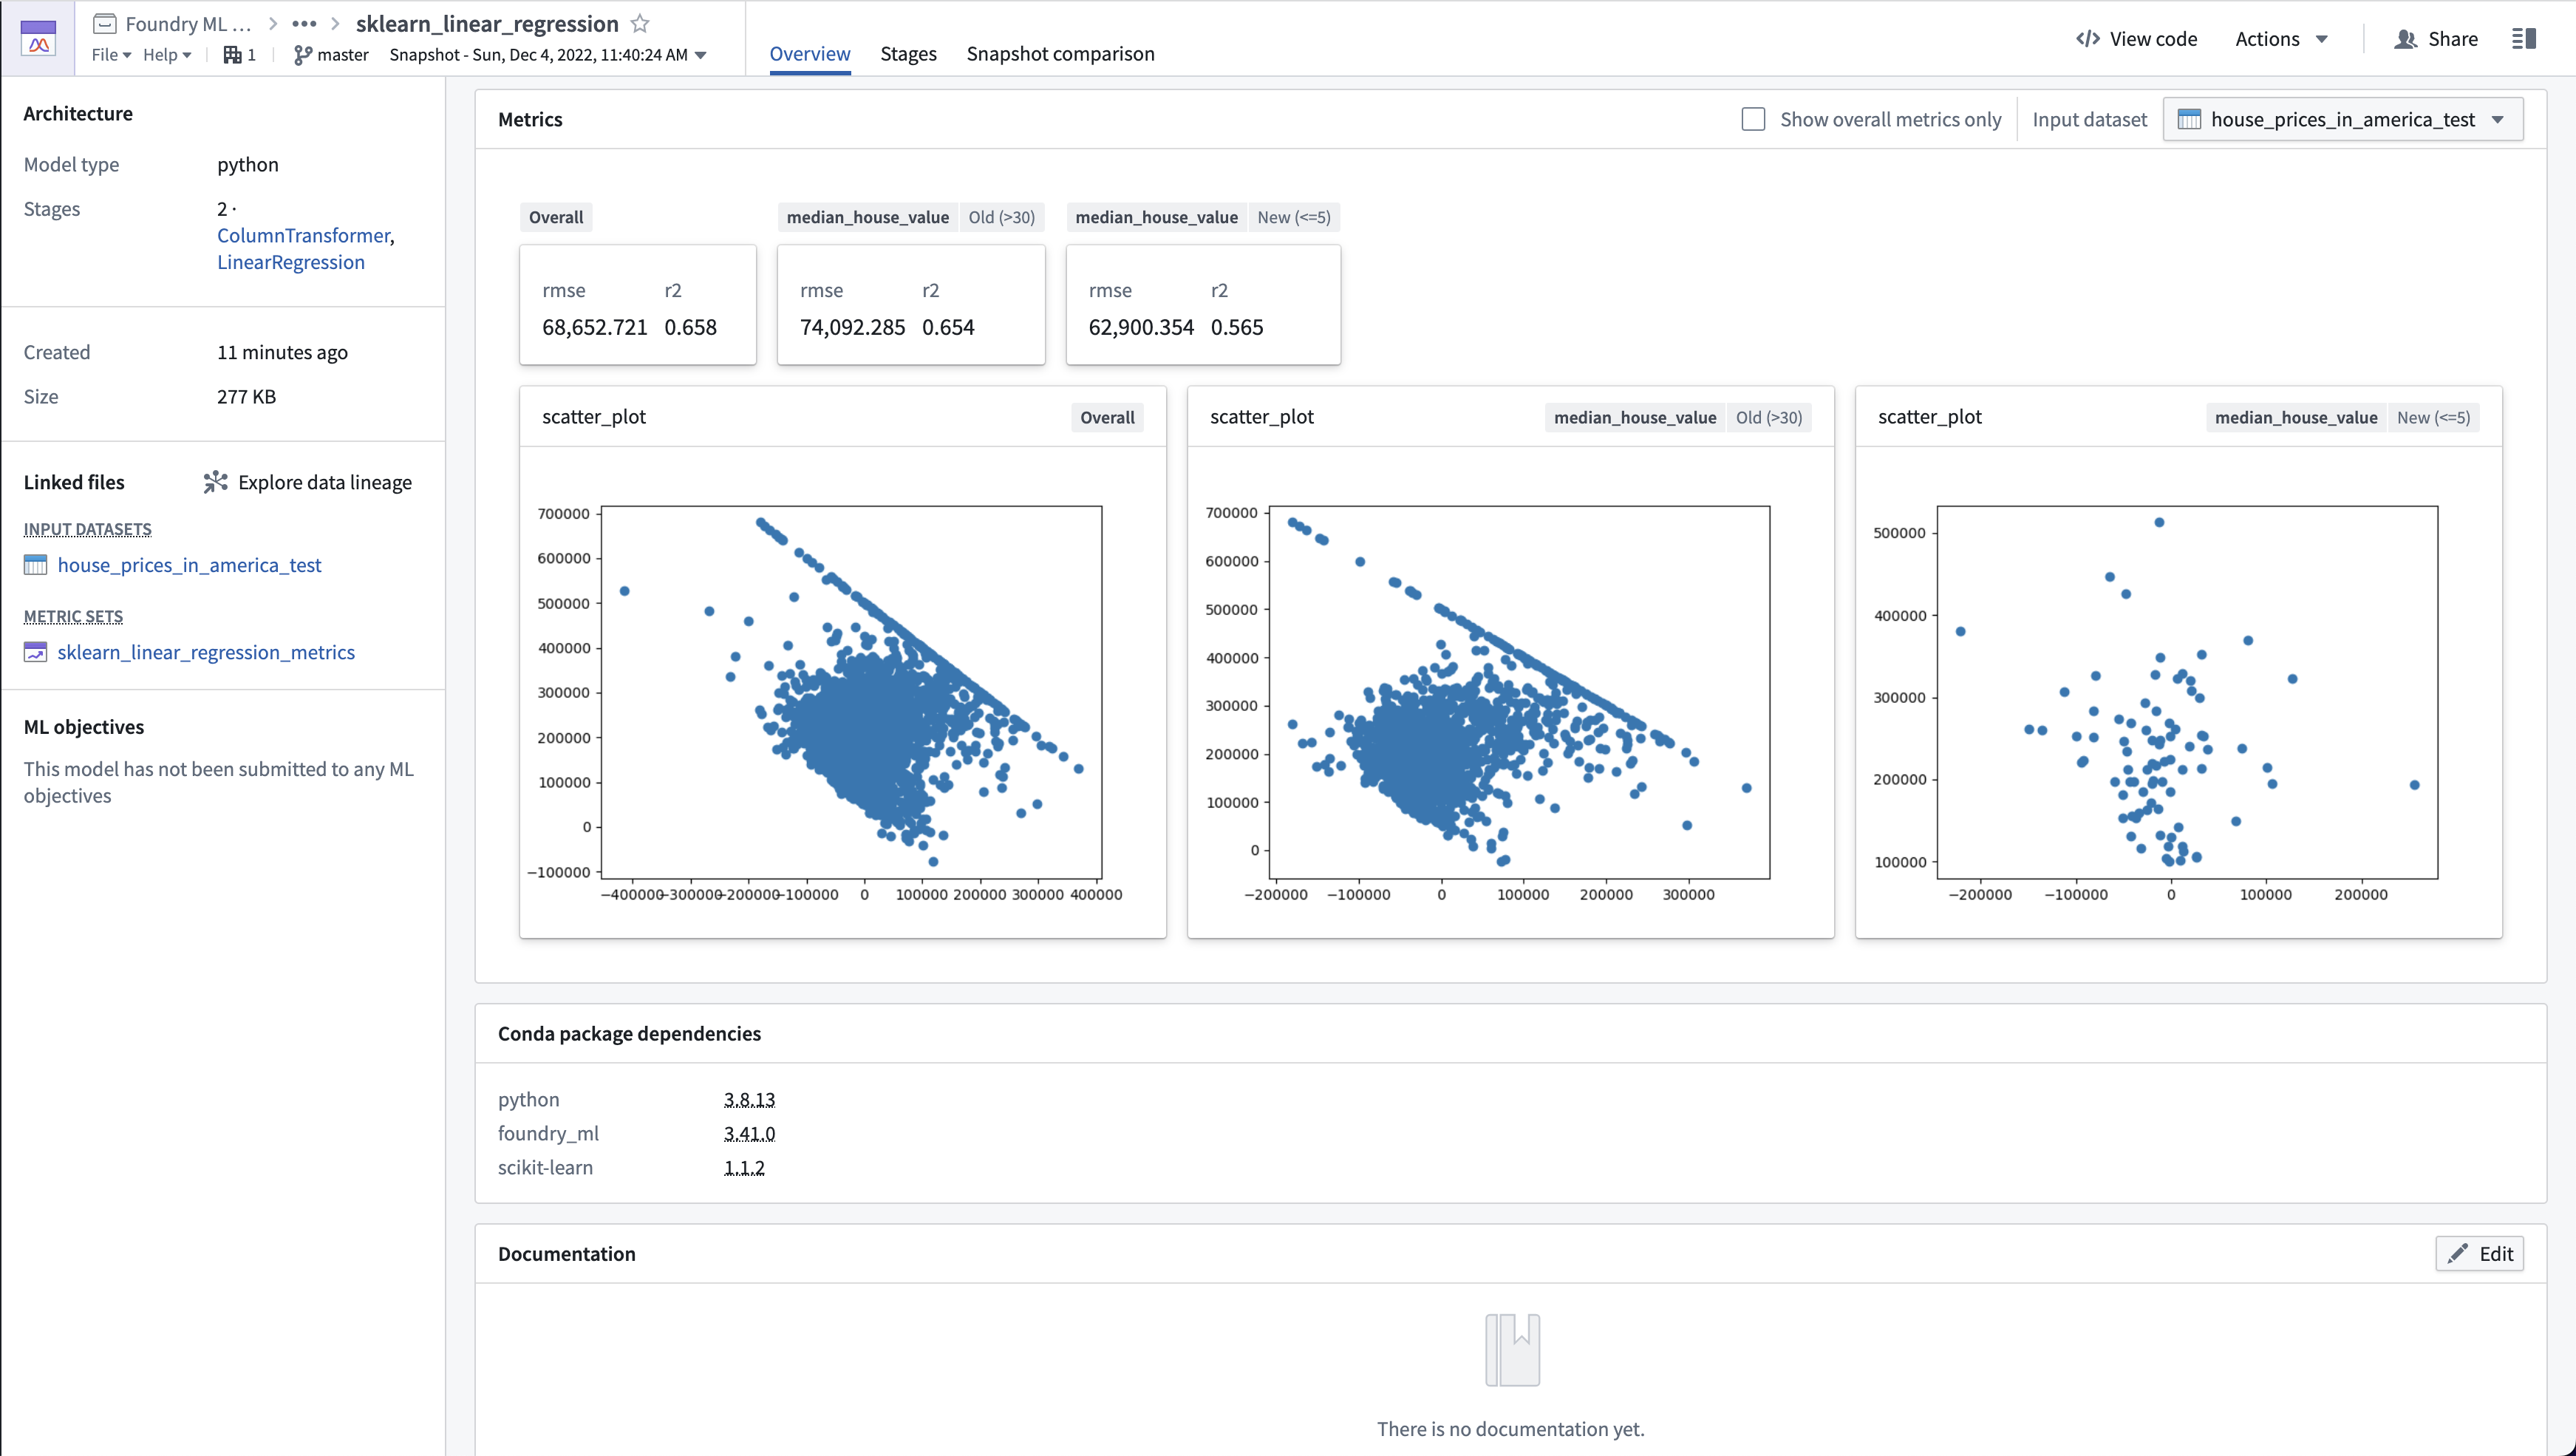
MetricSet 生成的指标与评估数据集的特定事务相关联,并可在 建模目标 应用程序中查看。请注意,您需要在建模目标设置页面切换 Only show metrics produced by evaluation configuration 以启用这些指标。
指标与输入数据集的特定事务相关联;每次更新模型或输入数据集时,您可能需要重新运行生成 MetricSet 的代码。
在代码工作簿中评估模型
要在 代码工作簿 应用程序中评估模型:
- 创建一个代码工作簿或打开一个现有的工作簿。
- 将
foundry_ml包导入到代码工作簿的环境中。foundry_ml_metrics包将作为foundry_ml的一部分可用。 - 将模型和评估数据集导入代码工作簿。
- 创建一个在 Python 中生成
MetricSet对象的变换,并将您的模型和评估数据集关联为该MetricSet的输入。 - 将指标添加到变换中的
MetricSet中。 - 将
MetricSet作为变换的结果返回。
下面是一个名为 lr_model 的回归模型和名为 testing_data 的测试数据集的示例。请注意,此代码片段使用的是基于入门教程中的住房数据集的模型和测试数据集。
Copied!1 2 3 4 5 6 7 8 9 10 11 12 13 14 15 16 17 18 19 20 21 22 23 24 25 26 27 28 29 30 31 32 33 34 35 36 37 38 39 40 41 42 43 44 45 46 47 48 49 50 51 52 53 54 55 56 57 58 59 60 61 62 63 64 65 66 67 68 69 70 71 72 73 74 75 76 77def lr_evaluation_testing(lr_model, testing_data_input): from foundry_ml_metrics import MetricSet # 确保foundry_ml已添加到你的环境中 model = lr_model # 重命名模型 metric_set = MetricSet( # 创建一个MetricSet以添加各个度量 model = lr_model, # 你正在评估的Foundry ML模型 input_data=testing_data_input # 你正在评估性能的数据集的TransformInput ) testing_data_df = testing_data_input.dataframe().toPandas() # 从TransformInput获取pandas dataframe y_true_column = 'median_house_value' # 模型预测的数据集中的列 y_prediction_column = 'prediction' # 模型在转换数据集时生成的列 scored_df = get_model_scores(model, testing_data_df) # 在整个输入数据集上添加度量 add_numeric_metrics_to_metric_set(metric_set, scored_df, y_true_column, y_prediction_column) add_residuals_scatter_plot_to_metric_set(metric_set, scored_df, y_true_column, y_prediction_column) # 添加housing_median_age列大于30的度量 old_homes_subset = {'median_house_value': 'Old (>30)'} old_houses_scored_df = scored_df[scored_df['housing_median_age'] > 30] add_numeric_metrics_to_metric_set(metric_set, old_houses_scored_df, y_true_column, y_prediction_column, old_homes_subset) add_residuals_scatter_plot_to_metric_set(metric_set, old_houses_scored_df, y_true_column, y_prediction_column, old_homes_subset) # 添加housing_median_age列小于或等于5的度量 new_homes_subset = {'median_house_value': 'New (<=5)'} new_houses_scored_df = scored_df[scored_df['housing_median_age'] <= 5] add_numeric_metrics_to_metric_set(metric_set, new_houses_scored_df, y_true_column, y_prediction_column, new_homes_subset) add_residuals_scatter_plot_to_metric_set(metric_set, new_houses_scored_df, y_true_column, y_prediction_column, new_homes_subset) return metric_set # 代码工作簿将在Foundry中将其保存为MetricSet def get_model_scores(model, df): return model.transform(df) # 根据模型创建预测 def add_numeric_metrics_to_metric_set( metric_set, scored_df, y_true_column, y_prediction_column, subset=None ): import numpy as np from sklearn.metrics import mean_squared_error, r2_score y_true = scored_df[y_true_column] y_pred = scored_df[y_prediction_column] # 计算度量 mse = mean_squared_error(y_true, y_pred) rmse = np.sqrt(mse) r2 = r2_score(y_true, y_pred) metric_set.add(name='rmse', value=rmse, subset=subset) # rmse是一个浮点数 metric_set.add(name='r2', value=r2, subset=subset) # r2是一个浮点数 def add_residuals_scatter_plot_to_metric_set( metric_set, scored_df, y_true_column, y_prediction_column, subset=None ): import matplotlib.pyplot as plt y_true = scored_df[y_true_column] y_pred = scored_df[y_prediction_column] scatter_plot = plt.scatter((y_true - y_pred), y_pred) # 创建一个散点图 figure = plt.gcf() # 获取当前的pyplot图 metric_set.add(name='scatter_plot', value=figure, subset=subset) # figure是一个pyplot图像 plt.close() # 关闭pyplot图像
在这段代码中,我们定义了一个线性回归模型评估函数 lr_evaluation_testing,它会计算和展示模型的评估指标,包括均方根误差(RMSE)和决定系数(R²),并根据房屋的中位年龄进行子集分析。通过调用辅助函数 get_model_scores 和 add_numeric_metrics_to_metric_set,我们可以自动化计算并将结果存储在 MetricSet 中。散点图用于可视化预测残差。
在代码库中评估模型
要在代码库应用中评估模型:
- 创建一个代码库或打开一个现有的代码库。
- 将
foundry_ml包导入到代码库的环境中。foundry_ml_metrics包将作为foundry_ml的一部分提供。 - 创建一个在Python中生成
MetricSetObject的变换,并将您的模型和评估数据集作为该MetricSet的输入关联。- 不要返回您的MetricSet,而是使用
metric_set.save(metrics_output)保存metric_set。 - 您的模型和评估数据集的变换输入类型将是
TransformInput。
- 不要返回您的MetricSet,而是使用
- 在您的变换中将指标添加到
MetricSet中。 - 返回
MetricSet作为变换的结果。
下面是一个名为lr_model的回归模型和名为testing_data的测试数据集的示例。请注意,此代码片段使用的是基于快速入门教程中房屋数据集的模型和测试数据集。
Copied!1 2 3 4 5 6 7 8 9 10 11 12 13 14 15 16 17 18 19 20 21 22 23 24 25 26 27 28 29 30 31 32 33 34 35 36 37 38 39 40 41 42 43 44 45 46 47 48 49 50 51 52 53 54 55 56 57 58 59 60 61 62 63 64 65 66 67 68 69 70 71 72 73 74 75 76 77 78 79 80 81 82 83 84 85 86 87 88 89from transforms.api import transform, Input, Output # 确保已在 transforms-python/conda_recipe/meta.yaml 中将 foundry_ml 添加到运行需求中 from foundry_ml import Model from foundry_ml_metrics import MetricSet @transform( # 使用 @transform,输入将是 TransformInput 类型 # 需要将 Output Path 更新为希望保存指标的输出位置 metrics_output=Output("/Path/to/metrics_dataset/sklearn_linear_regression_metrics"), # 需要将 Input Path 更新为模型和评估数据集的路径 model_input=Input("/Path/to/model/sklearn_linear_regression"), testing_data_input=Input("/Path/to/evaluation_dataset/house_prices_in_america_test") ) def compute(metrics_output, model_input, testing_data_input): model = Model.load(model_input) # 从 TransformInput 加载 Foundry ML 模型 metric_set = MetricSet( # 创建一个 MetricSet 来添加单个指标 model=model, # 你正在评估的 Foundry ML 模型 input_data=testing_data_input # 你正在评估其性能的数据集的 TransformInput ) testing_data_df = testing_data_input.dataframe().toPandas() # 从 TransformInput 获取一个 pandas dataframe y_true_column = 'median_house_value' # 这是模型预测的评估数据集中的列 y_prediction_column = 'prediction' # 这是模型在转换数据集时产生的列 scored_df = get_model_scores(model, testing_data_df) # 添加关于整个输入数据集的指标 add_numeric_metrics_to_metric_set(metric_set, scored_df, y_true_column, y_prediction_column) add_residuals_scatter_plot_to_metric_set(metric_set, scored_df, y_true_column, y_prediction_column) # 添加 housing_median_age 列大于 30 的指标 old_homes_subset = {'median_house_value': 'Old (>30)'} old_houses_scored_df = scored_df[scored_df['housing_median_age'] > 30] add_numeric_metrics_to_metric_set(metric_set, old_houses_scored_df, y_true_column, y_prediction_column, old_homes_subset) add_residuals_scatter_plot_to_metric_set(metric_set, old_houses_scored_df, y_true_column, y_prediction_column, old_homes_subset) # 添加 housing_median_age 列小于或等于 5 的指标 new_homes_subset = {'median_house_value': 'New (<=5)'} new_houses_scored_df = scored_df[scored_df['housing_median_age'] <= 5] add_numeric_metrics_to_metric_set(metric_set, new_houses_scored_df, y_true_column, y_prediction_column, new_homes_subset) add_residuals_scatter_plot_to_metric_set(metric_set, new_houses_scored_df, y_true_column, y_prediction_column, new_homes_subset) metric_set.save(metrics_output) # 将此 MetricSet 保存到 TransformsOutput 中 def get_model_scores(model, df): return model.transform(df) # 基于模型创建预测 def add_numeric_metrics_to_metric_set( metric_set, scored_df, y_true_column, y_prediction_column, subset=None ): import numpy as np from sklearn.metrics import mean_squared_error, r2_score y_true = scored_df[y_true_column] y_pred = scored_df[y_prediction_column] # 计算指标 mse = mean_squared_error(y_true, y_pred) rmse = np.sqrt(mse) r2 = r2_score(y_true, y_pred) metric_set.add(name='rmse', value=rmse, subset=subset) # rmse 是一个浮点数 metric_set.add(name='r2', value=r2, subset=subset) # r2 是一个浮点数 def add_residuals_scatter_plot_to_metric_set( metric_set, scored_df, y_true_column, y_prediction_column, subset=None ): import matplotlib.pyplot as plt y_true = scored_df[y_true_column] y_pred = scored_df[y_prediction_column] scatter_plot = plt.scatter((y_true - y_pred), y_pred) # 创建一个散点图 figure = plt.gcf() # 获取当前的 pyplot 图像 metric_set.add(name='scatter_plot', value=figure, subset=subset) # figure 是一个 pyplot 图像 plt.close() # 关闭 pyplot 图像
更新指标
由于上述代码片段创建了变换,MetricSets 被创建并通过 Foundry 搭建进行计算。当模型更新或新的输入数据版本可用时,重新搭建 MetricSet 以更新与该模型相关的指标非常重要。