- Capabilities
- Getting started
- Architecture center
- Platform updates
Canvas mode
Quiver provides two view mode options for building your analysis; canvas mode and graph mode. When you start a new Quiver analysis, you will begin in canvas mode by default.
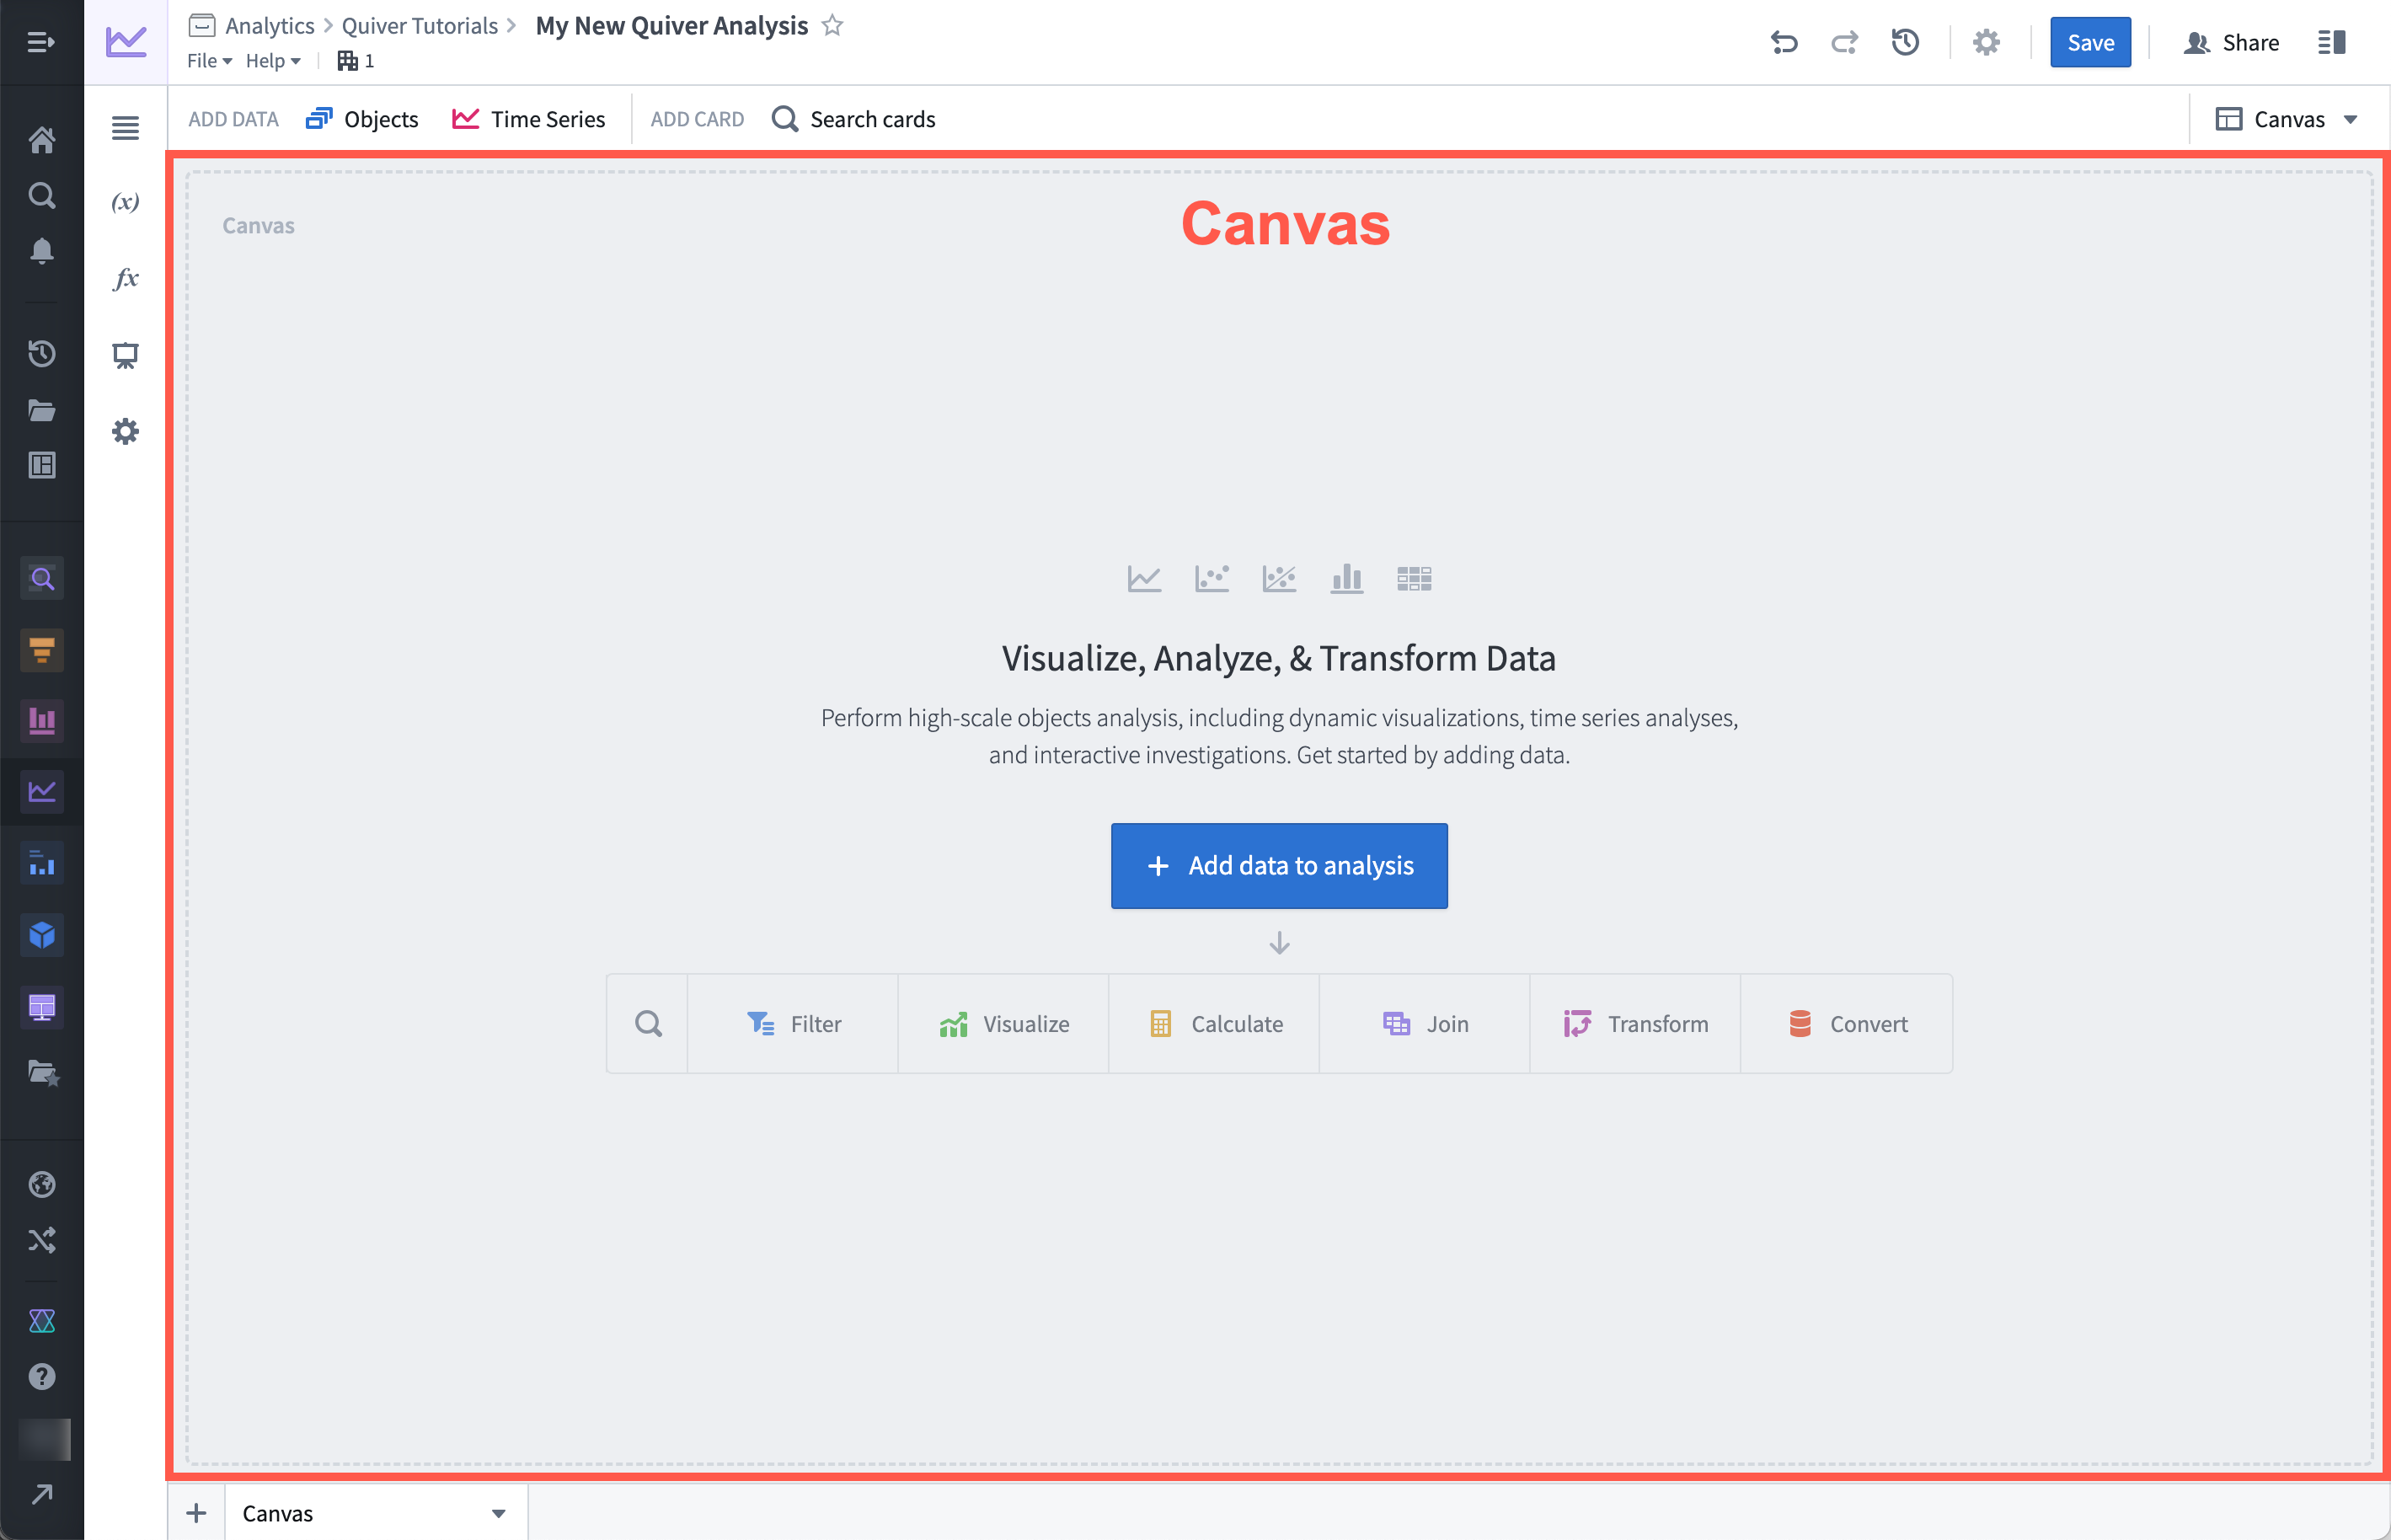
A Quiver canvas is a page where you can display, rearrange, and resize the cards in your analysis. You can create multiple canvases and organize your cards across different canvases. Canvas mode is ideal for organizing a customized view of your analysis, as this mode offers the flexibility to choose which content to display or hide, and the ability to adjust the size and position of cards on the page. As an analysis gets large, organizing cards across multiple canvases can also help improve performance, as only cards on the active canvas are computed.
Unlike a Contour path, a Quiver canvas is used for display and organization only. Rearranging cards in your canvas will not affect the underlying sequence of data transformation. Similarly, removing a card from your canvas will only delete the card if the card is not referenced by any other cards.
You can see the active view mode and switch between view modes by using the view mode toggle at the upper-right corner of the screen.
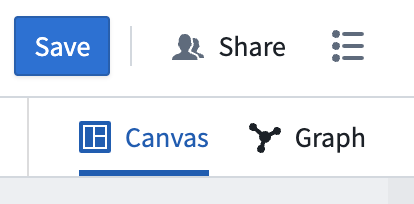
Note that adding cards to your analysis on a canvas will also make them visible in the graph and vice-versa, so you can toggle between the two modes in the course of your analysis.
Add cards to a canvas
When you add cards to your analysis, they will be displayed on the canvas. New cards are commonly added using the next actions menu that appears on hover below each card. Adding a card from the next actions menu will add the new card directly below the card that was used to open the next actions menu. You can also add new cards from the Search cards window, which can be accessed from the top menu bar. These cards will be placed at the bottom of the canvas. The ordering of the cards does not necessarily indicate dependencies between the cards.
In the example below, we use the next actions menu to add a numeric aggregation based on the object set. Notice that the card is added directly below the object set, and the object set input is already configured.
Next, we add the same numeric aggregation using the Search cards window. This gets added to the bottom of the canvas, and requires manual configuration of the object set input.
These two numeric aggregation cards were added in different ways and are on different parts of the canvas, but they represent the exact same calculation.
Create and rename a canvas
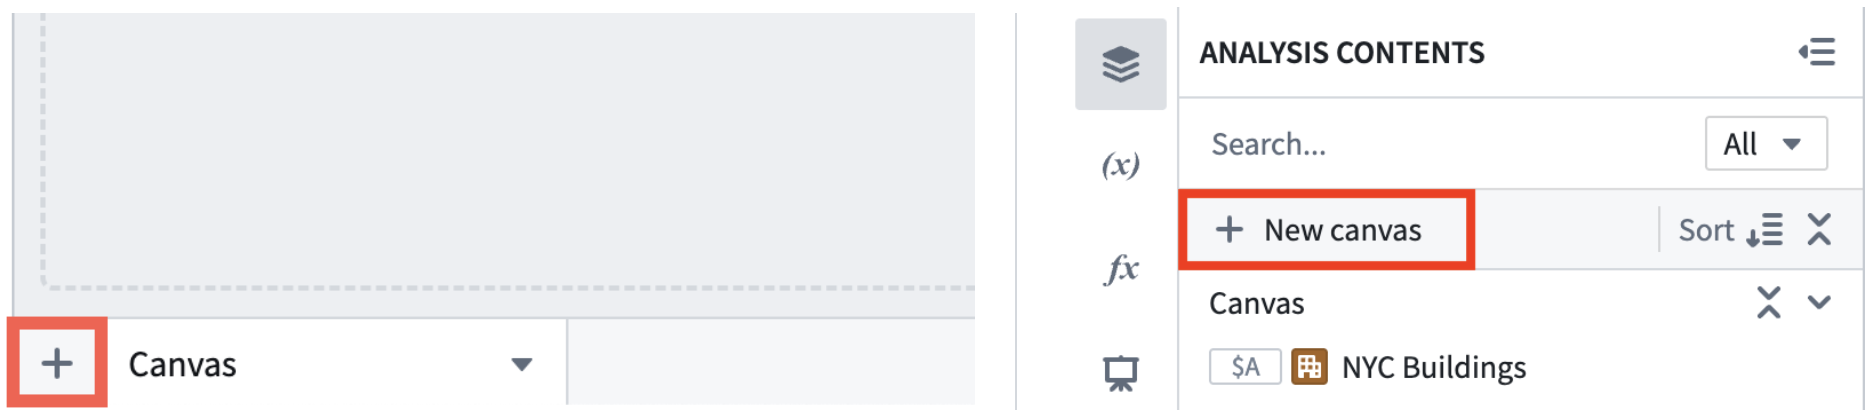
A single Quiver analysis can contain multiple canvases. To create a new canvas, select the + icon in the lower-left corner. You can also create a new canvas from the analysis content panel with the + New canvas option.
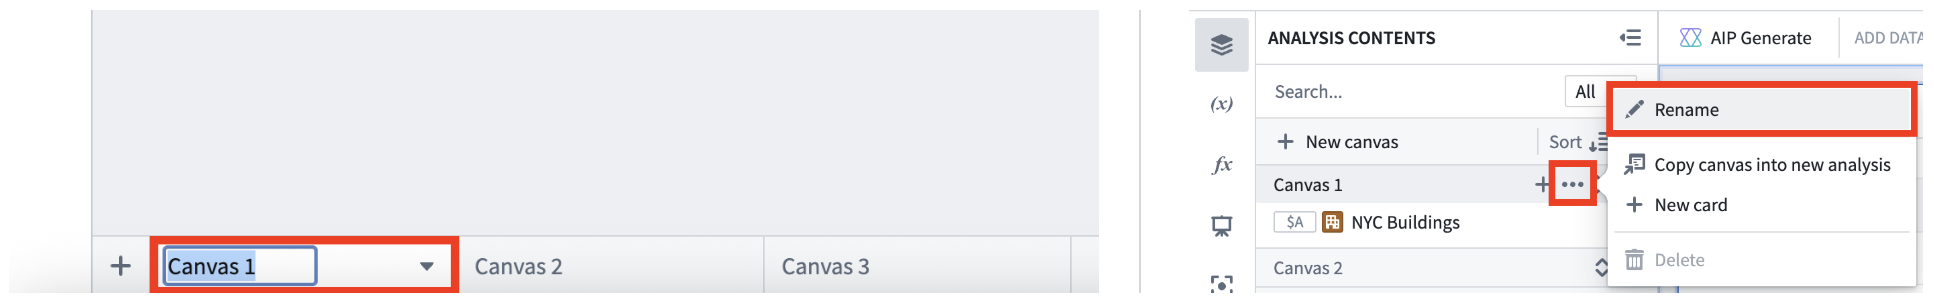
Once created, you can rename a canvas by double clicking the canvas name on the tab at the bottom of your workspace. You can also rename a canvas in the analysis content panel. Find the canvas you want to rename, select the More actions icon (...), and select Rename.
Resize and rearrange cards on the canvas
You can move cards on the canvas by using the drag handle on the upper-left corner of the card. Select and drag the handle to place the card in the desired location. Cards can also be resized by selecting and dragging the lower-right corner. In the example below, cards on a canvas are resized and rearranged to make the analysis more presentable.
Move cards between canvases
You can reorder and move cards between canvases by dragging and dropping content in the analysis contents panel. In the example below, the analysis is split up into three canvases; one for data, one for metrics, and one for charts. This is a common way to keep Quiver analyses organized as they grow.
Cards can also be moved between canvases using the Move to canvas option in a card's More actions menu. Simply select the canvas you would like to move the card to.
Hide and delete cards
In some cases, you may want to hide cards that contain logic but are not relevant when displaying data. To do this from a card, select the More actions menu icon (...) in the top right of a card and select Hide. You can also hide and unhide cards from the Analysis contents panel using the eye icon that appears on hover. Cards that have been hidden from the analysis are still visible at the bottom of the Analysis contents panel with a red eye slash icon ( ). Selecting the eye slash icon will make the card reappear at the bottom of the canvas.
In addition to hiding cards, you can also remove cards from a canvas. If a card is removed from a canvas and is not referenced by any other card, it will be deleted. If the card is referenced by another card, the removed card will be moved to the Not in canvas section of the Analysis contents panel. From here, it can be configured, added to canvas, or deleted. Be careful when deleting cards from the Not in canvas section, as deleting cards with downstream dependencies will also delete their descendants.
In the example below, we show and hide the object set card in the canvas using the card's More actions menu and the Analysis contents panel.
We then remove the card from the canvas, moving it to the Not in canvas section of the Analysis contents panel, and delete it. This deletes the filter card from the analysis, as it is downstream of the deleted object set card.
If you want to delete a card but keep downstream content, you can use the editor panel to remove downstream dependencies on the card, then delete it.
In the example below, to remove the filter card in between the bar chart and the original object set we first use the editor panel to configure the bar chart to point to the original object set. We can then safely delete the filter card without any side effects.
Card dependencies
When using canvas mode, you can see all card dependencies (inputs and outputs) in the collapsible Dependencies panel at the bottom of the card's editor panel. Selecting an input or output card will open the card's editor panel and scroll to it, simplifying navigation on the canvas.
You can also view card dependencies by using graph mode. By default, the graph will show all cards in the analysis, but you can select View dependencies in graph to show a filtered graph with only the ancestors and descendants of the selected card.