- Capabilities
- Getting started
- Architecture center
- Platform updates
Cross filter
Creates an object set that can be filtered based on selections in multiple charts. These charts can also filter each other. This offers a more horizontal and interactive selection experience for users, especially consumers of dashboards.
Input type
Object set, categorical chart
Output type
Object set
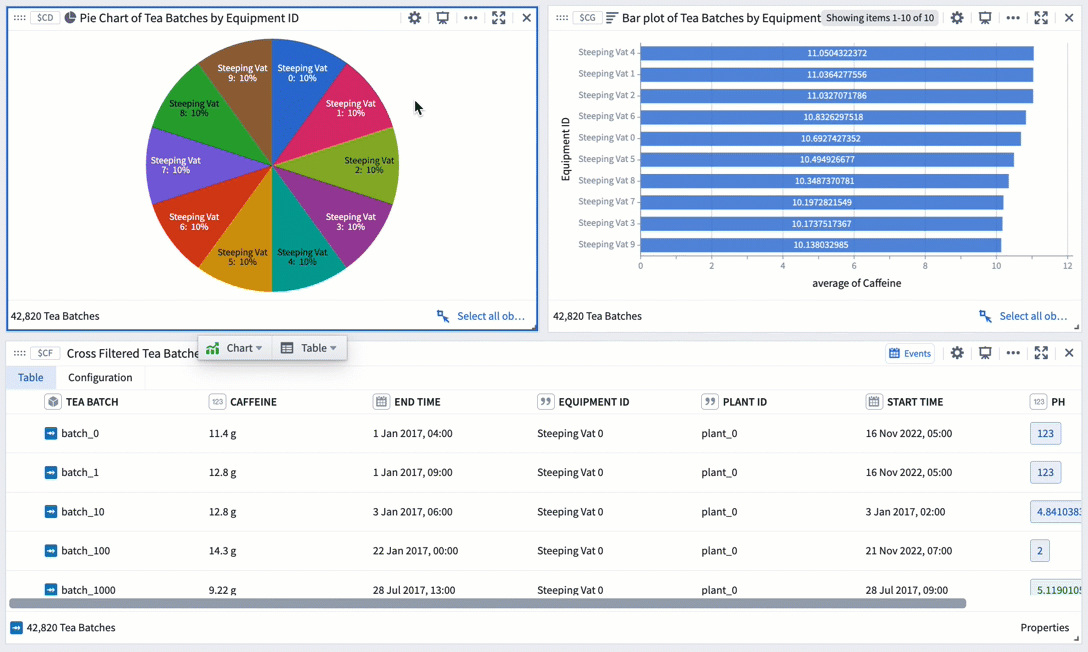
Example
In the example below, both the pie chart and the bar chart filter the object set below them. Making a selection on the pie chart, for example, selecting Steeping Vat nine, seven, and three, not only filters the object set down to the corresponding objects, but also filters the bar chart by reducing it to those 3 categories.
You can add this card by selecting Filter > Cross filter from the next actions menu of an object set.
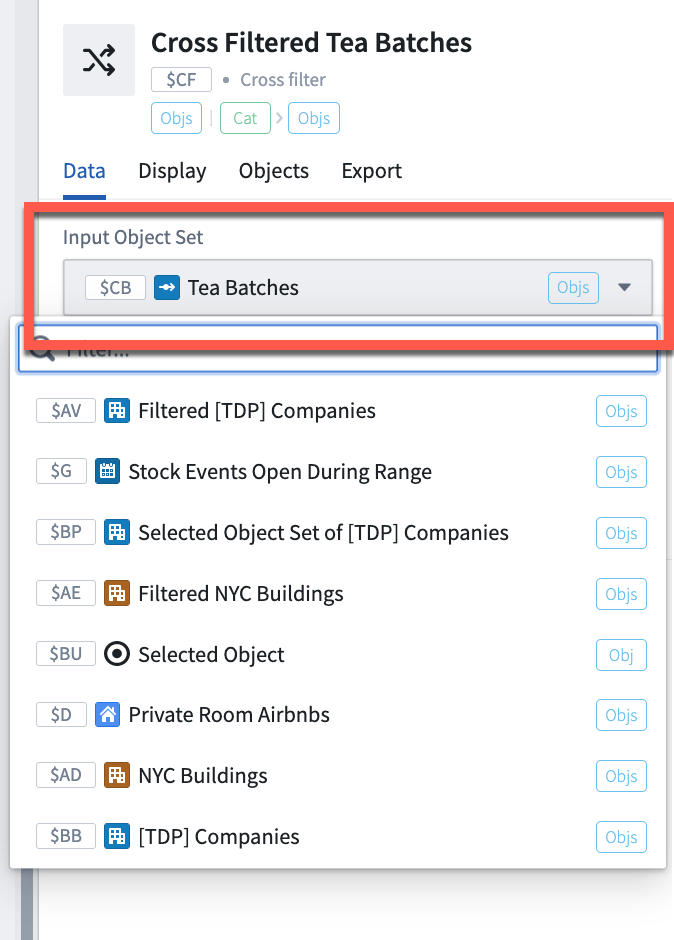
Cross filtering configuration
-
Select the input object set that you want the charts to filter.
-
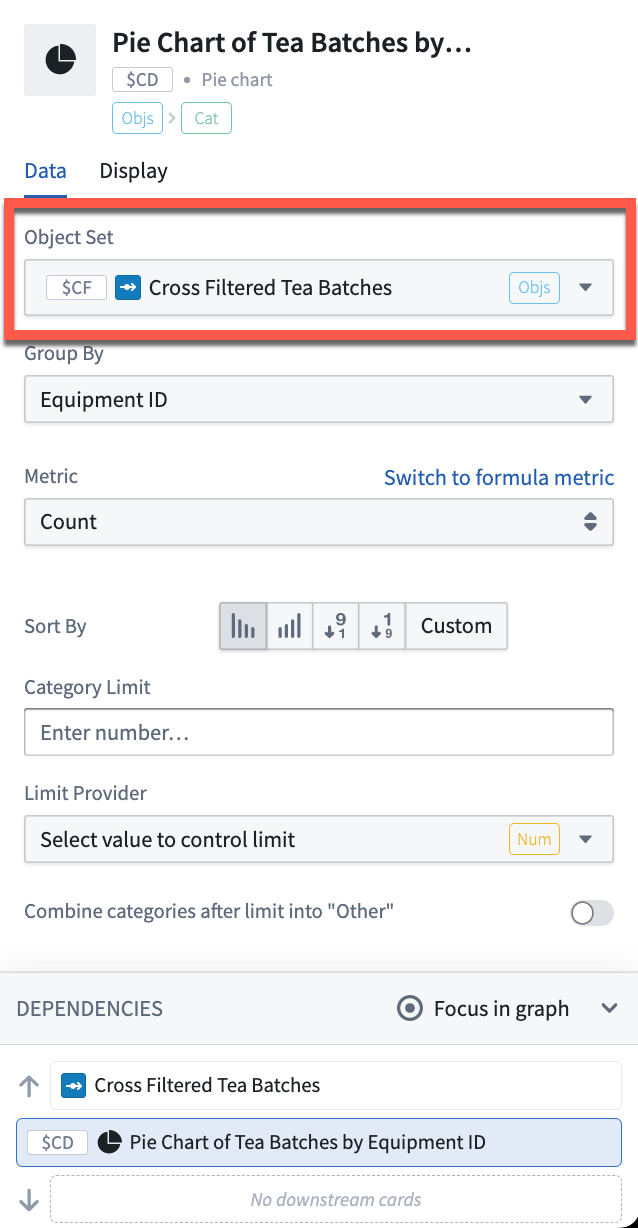
Then, create categorical charts that take the cross filter card as input. The following charts are supported in the cross filter card:
- Pie charts
- Bar charts
- Line charts
- Categorical scatter plots
-
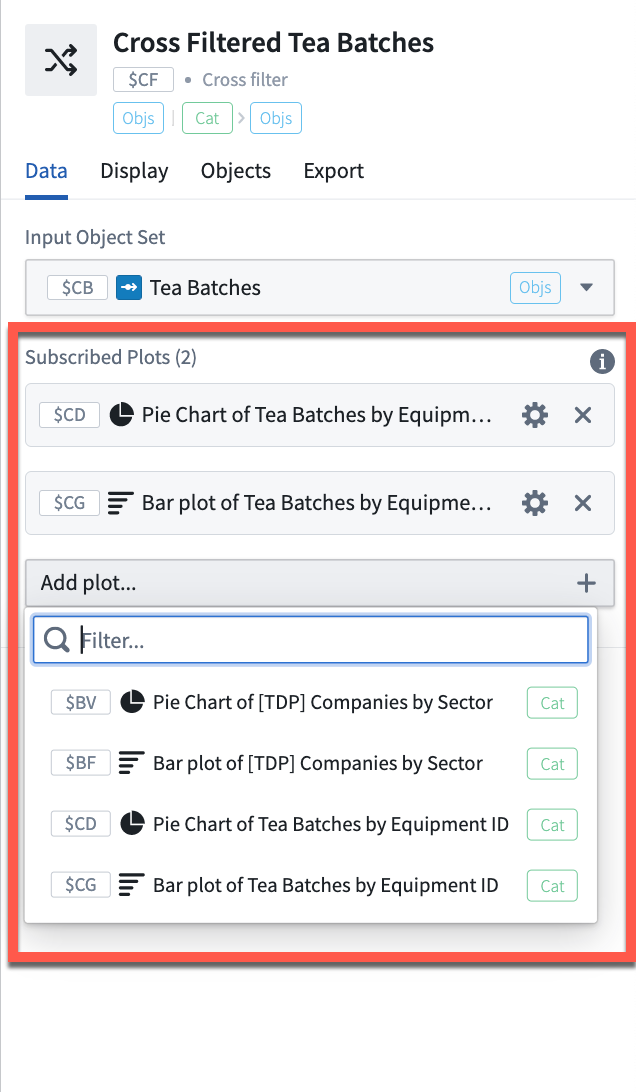
Lastly, open the editor panel of the cross filter card and add the charts above to the Subscribed plots category. Charts that are subscribed to the cross filter will act as filters on the object set and also filter each other.
Usage information
| Functionality | Availability |
|---|---|
| Standard Quiver card | Supported |
| Transform table transform | Unsupported |