- Capabilities
- Getting started
- Architecture center
- Platform updates
Announcements
REMINDER: Sign up for the Foundry Newsletter to receive a summary of new products, features, and improvements across the platform directly to your inbox. For more information on how to subscribe, see the Foundry Newsletter and Product Feedback channels announcement.
Share your thoughts about these announcements in our Developer Community Forum ↗.
Track project usage in Resource Management
Date published: 2025-05-29
A new Project usage page is now available in Resource Management, providing broader access for users to efficiently track compute and storage usage in their projects.

The new Project usage page, displaying the results of a sample project featuring several different source types.
This updated interface allows you to view graphs of compute and storage usage, along the dimensions configured for your enrollment. These graphs use color-coding to easily identify different sources of usage. Additionally, you can filter the displayed results by date range, bucket period (daily, weekly, or monthly), and by source type.
The project view page is similar to the Analysis tab in the full Resource Management view, but with some notable differences:
- Usage is displayed for a single project at a time.
- Users with the
Ownerrole on a project have access to the project usage page by default. - Cost and billing insights are not provided.
To navigate to the updated usage interface, select Project usage at the bottom of the project navigation panel.

The project navigation panel, with a link to view project usage.
Allocate dedicated LLM resources with AIP reserved capacity
Date published: 2025-05-27
AIP reserved capacity is now available, enabling the allocation of additional tokens per minute (TPM) and requests per minute (RPM) for production workflows. Reserved capacity is an LLM capacity management tool in the Resource Management application that helps secure critical workflows, ensuring they are not restricted by project rate or enrollment limits to provide increased uptime and reliability.

An example of allocated reserved capacity for a specific model, displaying a list of the projects that have access to additional capacity and the percentage distribution across projects.
Since reserved capacity allocates LLM resources in addition to existing enrollment limits, production workflows do not have to compete with other resources for the shared pool of LLM capacity, enabling uninterrupted operation.
Key features
- Reserved capacity is configured at the project level by allocating a specific amount of TPM and RPM to a designated project. This applies to a single model.
- Projects can be assigned a percentage of the total reserved capacity, allowing you to prioritize the most critical resources and customize LLM allocation to align with your organizational requirements.
- When reserved capacity is expended, projects and resources with allocated reserved capacity will automatically use existing shared project and enrollments limits, since reserved capacity is provided in addition to the existing enrollment capacity.
Contact your Palantir administrator to request reserved capacity allocation. Once allocated, users with resource management administrator permissions can allocate reserved capacity to specific projects.
Note that we cannot guarantee the availability of reserved capacity for all models at all times. This depends on the availability and offerings of model providers such as Azure, AWS, GCP, xAI, and others. We aim to offer reserved capacity on all industry leading flagship models.
Your feedback matters
We want to hear about your experiences with AIP Resource Management and welcome your feedback. Share your thoughts with Palantir Support channels or our Developer Community ↗ using the language-model-service ↗ and resource-management ↗ tags.
Learn more about reserved capacity.
Note: AIP feature availability is subject to change and may differ between customers.
Bulk update ontology roles in Workflow Lineage
Date published: 2025-05-22
Users can now easily and efficiently apply bulk updates to ontology roles permissions within Workflow Lineage, providing a seamless experience for workflow resource management without needing to switch to Ontology Manager. As users in Workflow Lineage understand, manage, and debug ontology workflows, they may find it necessary to update permissions on given ontology resources to unblock collaborators or add additional security to these workflows. The new bulk update feature allows these users to streamline their management and debugging processes by solving permissions issues directly within the workflow exploration view.
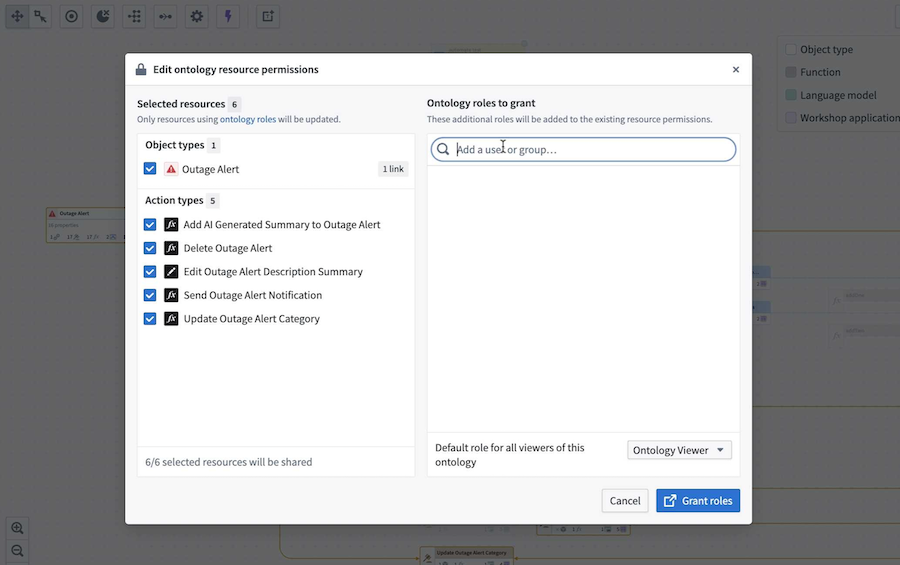
The Edit ontology resource permissions window in Workflow Lineage, where you can apply bulk updates to ontology roles.
To get started, navigate to the ontology resource you wish to modify in Workflow Lineage. Then, right-click on the resource and select Edit permissions from the context menu. This will open the Edit ontology resource permissions window, where you will see the selected resources displayed.
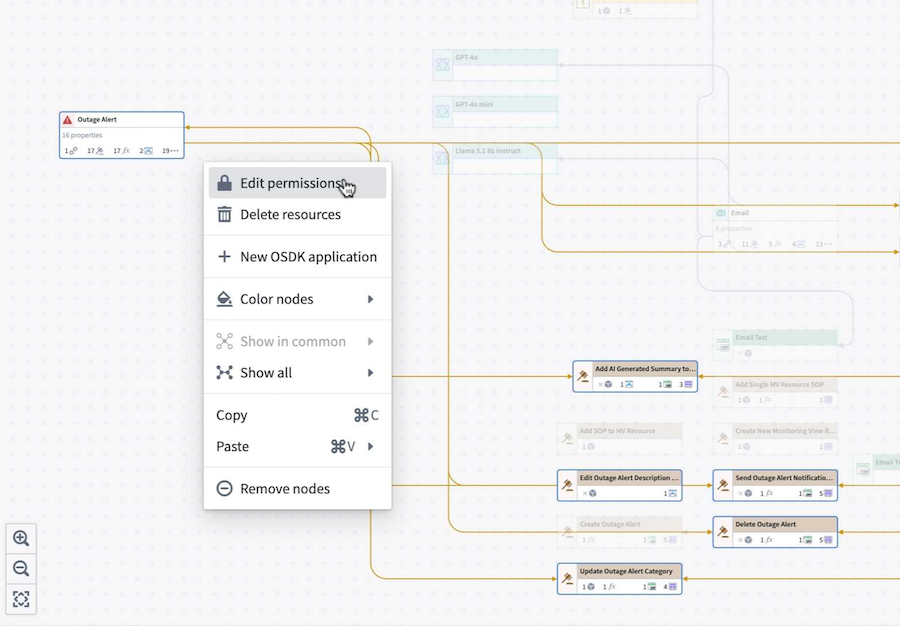
The context menu for an ontology resource, where you can choose to Edit permissions.
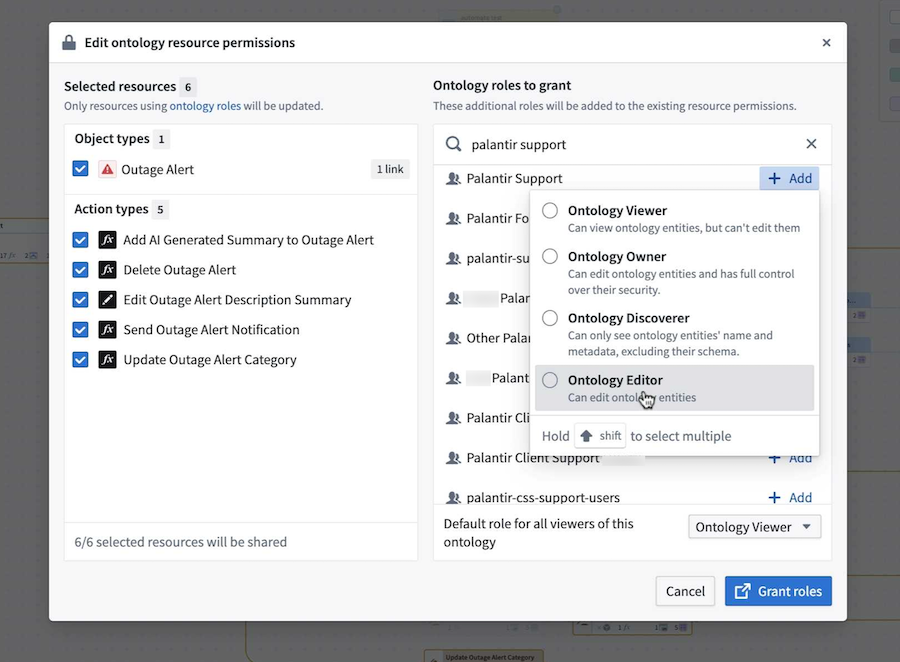
In the Ontology roles to grant section, search for the group you want to add and select the role to grant. The role will then appear next to the chosen group, indicating that it was successfully selected. You can also change the default role for all viewers of the ontology to either Ontology Viewer or Ontology Discoverer.
Use the search bar to find groups and grant ontology roles for a given resource.
Once you make your selections, confirm your choices by selecting Grant roles in the bottom right corner. A dialog will appear asking, "Are you sure you want to share these resources?". To proceed, select Yes, share. Note that this action is immediate and cannot be undone.
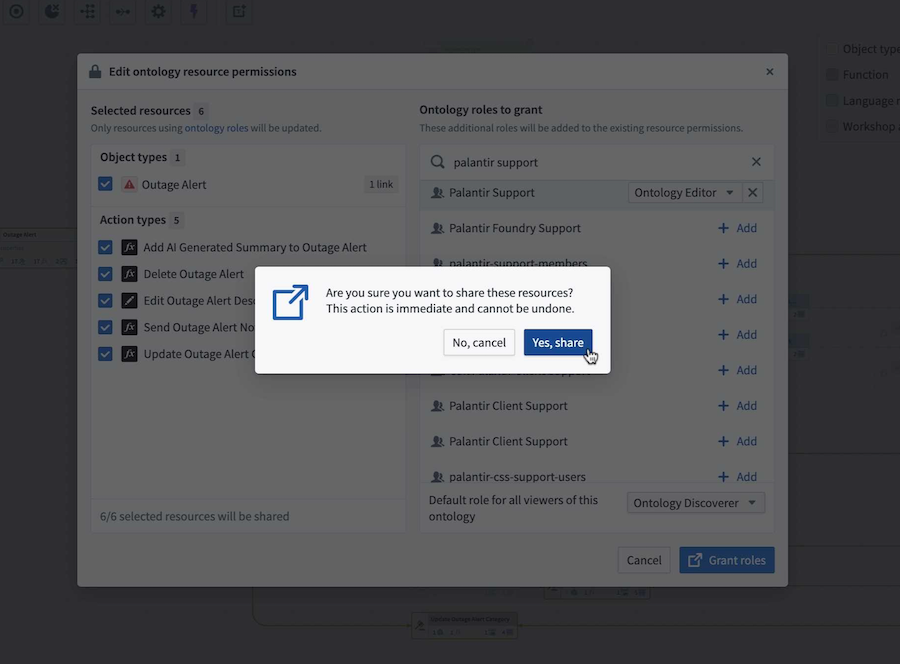
The confirmation prompt to verify your ontology role grant selections.
Learn more about managing and debugging your workflows with Workflow Lineage in our documentation.
We want to hear from you
Instead of navigating back to Ontology Manager to update your ontology resource permissions, try the bulk update feature in Workflow Lineage to simplify your management and debugging tasks for ontology-based workflows. Then, share your feedback with us through Palantir Support or our Developer Community ↗.
Media set transforms and outputs are now available in Pipeline Builder
Date published: 2025-05-22
Starting the week of May 26, a new range of expressions will be available for media sets in Pipeline Builder, allowing users to transform media and output media sets. Previously, media sets needed to be converted to datasets, and it was only possible to transform media with Python transforms. With these new dedicated expressions, users can convert images into documents and vice versa, manipulate images, split PDF files, and more, maximizing the potential of unstructured data in Pipeline Builder.
Get started
To get started with media set transforms, choose a media set node in your workspace and select Transform, then choose one of the new media expressions from the transforms page.

The list of media transforms available on a media set input in Pipeline Builder.
Preview works the same way it does for datasets, so you can preview expressions before applying them. You can then add your media set as a pipeline output. This can be configured in the sidebar on the right side.

Adding a new media set output in Pipeline Builder.
Leverage these new media set transforms to unlock new possibilities for harnessing unstructured data, and streamline the media transformation process in Pipeline Builder. Visit the documentation to learn more about media set transforms and media set outputs.
Your feedback matters
We want to hear about your experience and welcome your feedback as we develop more media set transforms in Pipeline Builder. Share your thoughts with Palantir Support channels or on our Developer Community ↗ using the pipeline-builder tag ↗.
Analyze data with charts in Pipeline Builder
Date published: 2025-05-20
You can now add another layer of data insight to your transform nodes with charts in Pipeline Builder. Designed to enhance your data analysis capabilities, charts help you to quickly analyze and test derived data without needing to leave the Pipeline Builder application. Currently, Pipeline Builder supports histogram and bar chart generation.

An example graph in Pipeline Builder, displaying data on company review counts by city.
Get started
You can add charts directly to transform node in a Pipeline Builder graph. To add a chart, double-click a transform node to open the path view. In the search bar, search for "chart" or "histogram". Alternatively, select Visualize to the right of the search bar.

A transform path view, where you can generate a transform graph through search or by selecting Visualize (outlined in red).
Note that you can generate a chart through a transform node only. To create a chart after applying a join, union, or split, create a new transform node and double-click to open the path view.

An example transform node.
Configure the chart
In the Configure tab of the chart creation panel, select values for the x-axis and y-axis. Then, choose from a variety of aggregations for the y-axis, including distinct count, max, min, median, mode, row count, sum, and more. You can also add multiple aggregations to a single graph by selecting Add item.

An example chart with two aggregations: row count and distinct count.
From the Format tab, you can change the title, x-axis label, and y-axis label.

The Format tab for a Pipeline Builder chart, where you can edit the x- and y-axes labels and chart title.
View the chart
Once you complete the chart configuration, you can analyze and explore the visualization. Navigate through results using the left and right arrows or by selecting the result count from the Show results dropdown menu at the bottom right of the chart. To collapse or expand the color legend, select Legend at the bottom left of the chart.

Use the navigation arrows or the Show results dropdown menu to view all chart results.
Tell us what you think
We want to hear about how you use charts in Pipeline Builder to elevate your data analysis capabilities. Share your thoughts with Palantir Support, or let us know in our Developer Community ↗ forum using the pipeline-builder ↗ tag.
Python functions can now be run serverless
Date published: 2025-05-13
You can now run Python functions without any setup or user-managed resources using our high-performance serverless backend. All new Python functions will use the serverless backend unless specifically requested, and deployed Python functions can be switched to the serverless backend with no downtime.
Python functions can be used anywhere in the platform that Typescript functions are used, such as in ontology actions and Workshop. With this functionality, Python functions will execute similarly to Typescript functions, with no user-managed resources.
To get started on a new Python function, review the getting started walkthrough.
If you have existing deployed Python functions, you can migrate them to the serverless backend through Ontology Manager using the dropdown menu.

Existing functions using the deployed backend can be converted to serverless mode in Ontology Manager.
Define module-level color palettes for Workshop applications
Date published: 2025-05-13
Custom colors used within a Workshop application may now be defined and saved on the module level, allowing application builders to set a consistent palette and easily swap out colors used throughout their application. You can access a new Used colors panel from the module’s Settings panel which stores Saved colors defined by the builder and Unsaved colors used in the module.

An example Workshop application, displaying saved and unsaved colors in the Settings panel.
- Saved colors are defined by the application builder on the module level. Builders may add colors to the Saved colors section that will allow these colors to be selectable when configuring custom colors in layouts and widgets. Builders may rename the saved colors they have defined, set separate colors to be used in light and dark modes for modules, and view color usage in layouts and widgets within the module. Saved colors may be easily edited by the builder and propagated to all layouts and widgets using the saved colors feature, allowing builders to quickly and easily update colors within their module.
- Unsaved colors represent custom colors not set in the Saved colors section used in layouts and widgets throughout the module. Builders may select to copy the hex code of unsaved colors to be easily used elsewhere and may also view the usage of these colors in layouts and widgets within the module.
To learn more about Workshop's used colors feature, review the product documentation.
GPT-4.1, GPT-4.1 mini, and GPT-4.1 nano are now available in AIP through Direct OpenAI API
Date published: 2025-05-13
OpenAI’s GPT-4.1, GPT-4.1 mini, and GPT-4.1 nano are now available for general use in AIP through Direct OpenAI API. GPT-4.1 is OpenAI’s flagship model for complex tasks and an improvement over GPT-4o for similar use cases, while the mini and nano models provide lower latency and costs. Comparisons between OpenAI’s models can be found in GPT-4.1’s release notes ↗. As with all new models, use-case specific evaluations are the best way to benchmark performance on your task.
GPT-4.1 models are available for enrollments that have accepted our AIP contract addendum and enabled Direct OpenAI usage in Control Panel. GPT-4.1 models are not currently available through Azure OpenAI or for geo-restricted enrollments yet. We will share an update when GPT-4.1 models through Azure are available in AIP. If your enrollment does not currently include these features, ask an enrollment administrator to review the AIP enablement settings and documentation.
GPT-4.1 models are available to use in all AIP features such as AIP Logic, Pipeline Builder, functions, transforms, and more.

GPT-4.1, GPT-4.1 mini, and GPT-4.1 nano recommended in Model Catalog.
Text nodes now available in Pipeline Builder and Workflow Lineage
Date published: 2025-05-13
Text nodes is a new feature designed to help annotate and document your graphs in Pipeline Builder and Workflow Lineage. Text nodes allow you to add descriptions and explanations directly in your workspace, making it easier to highlight important information and provide context where needed.

The Add new text node option, available in both Pipeline Builder and Workflow Lineage.
Key features
- Markdown support: Text nodes use Markdown, enabling you to format your text with ease.
- Customizable colors: Just like regular nodes, you can color text nodes to suit your graph's theme or emphasize sections.
- Independent layout: Text nodes are not affected by layout changes and remain independent of other nodes, providing flexibility in documentation placement.

Examples of text nodes in a Pipeline Builder graph.
Get started with text nodes
To add a new text node, select the Add new text node option located in the upper left of your workspace in either Pipeline Builder or Workflow Lineage.

Adding a new text node in Workflow Lineage.
After adding a text node, you can edit text content by double-clicking the added node and entering Markdown content. You can adjust the size of the text node using the three lines in the bottom right corner. If your text exceeds the node's length, it will automatically become scrollable.

Sample Markdown content in a text node, with three lines in the bottom right corner used to resize the node.
After adding text content, you can color-code your text nodes by right-clicking a node and selecting Color nodes from the context menu. Choose from existing colors to match relevant nodes, or create new colors to highlight important information.

The option to add a new color in a Pipeline Builder text node.
Embed text nodes in your pipelines and workflows to give users a comprehensive understanding of graph sections and the ability to update relevant information as workflows evolve from a single, cohesive interface.
Share your thoughts
We want to hear what you think about our updates to Pipeline Builder and Workflow Lineage. Send your feedback to Palantir Support teams, or share it in our Developer Community ↗ using the [pipeline-builder ↗] tag.
Learn more about text nodes in Pipeline Builder and Workflow Lineage.
Compare output statistics for proposals in Pipeline Builder
Date published: 2025-05-13
Pipeline Builder now lets you view and compare output statistics on any node within a proposal to the corresponding node from the original branch.

View and compare output statistics on any node for any column with the Comparison view in Pipeline Builder.
Benefit from the new Statistics panel and access a variety of metrics, including the following:
- General metrics: Number of null and unique values.
- String metrics: Minimum and maximum lengths, and count of strings needing trimming.
- Numeric metrics: Minimum, maximum, median, standard deviation, and count of negative and positive values.
You can also easily identify differences between the statistics of your branch and the main branch with color-coded metrics displayed to the right.
To access, start from the Proposals (or History) tab, and select Changes for the proposal.

Use the Changes option.
Double-click into the transform for which you want to see statistics, then select Statistics at the top right or use the tab on the bottom panel to access the statistics view.

Use the Statistics view to explore and compare statistics for selected columns.
Learn more about these proposal statistics in the documentation.
Indefinite conversation retention in AIP Agent Studio and AIP Threads
Date published: 2025-05-06
Indefinite conversation retention is now supported in AIP Agent Studio and AIP Threads, allowing users to access conversation history and context past the previous limit of 24 hours. This feature is optional in AIP Agent Studio, and is on by default for most configurations in AIP Threads.
AIP Agent Studio
To opt in to indefinite conversation retention for an AIP Agent, select the Indefinite retention setting in the Conversation settings tab.

AIP Agent Studio conversation retention settings.
This configuration applies to a specific AIP Agent and version, and will apply to future versions unless disabled. Setting this configuration on one agent will not affect other agents. Previous versions of an agent that do not have this option enabled will not have indefinite conversation retention. This feature should be configured individually for all agents, and the changes must be saved for indefinite retention to take effect.
To differentiate conversations with 24-hour retention vs. indefinite retention, a banner will be displayed in AIP Agent Studio and Workshop for agents with finite retention.

An AIP Agent configured with 24-hour retention In AIP Agent Studio.
Note that restricted view-backed object types are not supported with indefinite conversation retention. If you add a restricted view dependency to your agent, you will be unable to select the Indefinite retention option.
AIP Threads
In model mode, conversations will automatically opt into indefinite retention. In AIP Agent mode, conversations will assume the retention configuration of the AIP Agent.

AIP Threads conversations marked with indefinite and 24-hour retention.
Share your feedback
As we continue to develop AIP Agent Studio and AIP Threads, we want to hear about your experiences, and welcome your feedback. Share your thoughts with Palantir Support channels or our Developer Community ↗ using the aip-agent-studio ↗ and aip-threads ↗ tags.
For more information, review the AIP Agent Studio and AIP Threads documentation.
Introducing the new Workshop Map widget
Date published: 2025-05-06
Starting the week of May 5, the Workshop Map Application Template widget will become the Map widget, while the existing Map widget will be renamed to the Map [Legacy] widget. Going forward, the new Map widget is the recommended widget for geospatial workflows, providing better performance, new features, and more flexibility for large scale data.
Why did we make this change?
This change aims to clarify the recommended widget for geospatial workflows. We recommend that users consolidate map usage in Workshop to a single widget to minimize confusion for module builders, focus development efforts, and improve support timelines. There is considerable overlap between the two widgets, but the new Map widget focuses on large scale data and usability, so it is not intended to have exact feature parity with the Map [Legacy] widget. The Map [Legacy] widget will still be available, but is only recommended for mobile workflows and environments without WebGL. Module builders can opt to manually migrate to the new Map widget, but no action is required.
Advantages of the new Map widget
The new Map widget has the following advantages over the Map [Legacy] widget:
-
Support for large scale object sets in the order of millions of objects, compared to the 10 thousand object limit of the Map [Legacy] widget.
-
Tile-based rendering that enhances performance when handling complex geometries.
-
Dynamic layer visibility based on zoom levels.
-
A simple, more intuitive layer style configuration.
-
Removes the need to create external resources; the new Map widget can be fully configured in the Workshop widget editor.

A sample map where layer styles are controlled by the widget configuration.
-
Facilitates moving tracks and layer styling backed by time series properties, along with advanced timeline interactions.

A sample map that explores the prevalence and magnitude of earthquakes using timeline and time-based layer styles.
Share your feedback
For more information on these changes, review the new Map widget documentation, how it differs from the Map [Legacy] widget, and Map application capabilities.
As we continue to develop Workshop and the Map widget, we want to hear about your experiences and welcome your feedback. Share your thoughts with Palantir Support channels or our Developer Community ↗ using the map tag ↗.