- Capabilities
- Getting started
- Architecture center
- Platform updates
Evaluations
An evaluation is a collection of metrics, images, plots, and tables that captures how a specific model version performs against a given set of test data. Evaluations allow developers to define evaluation logic that writes these results to an evaluation set associated with the model, where they can be visualized and compared on the model page.
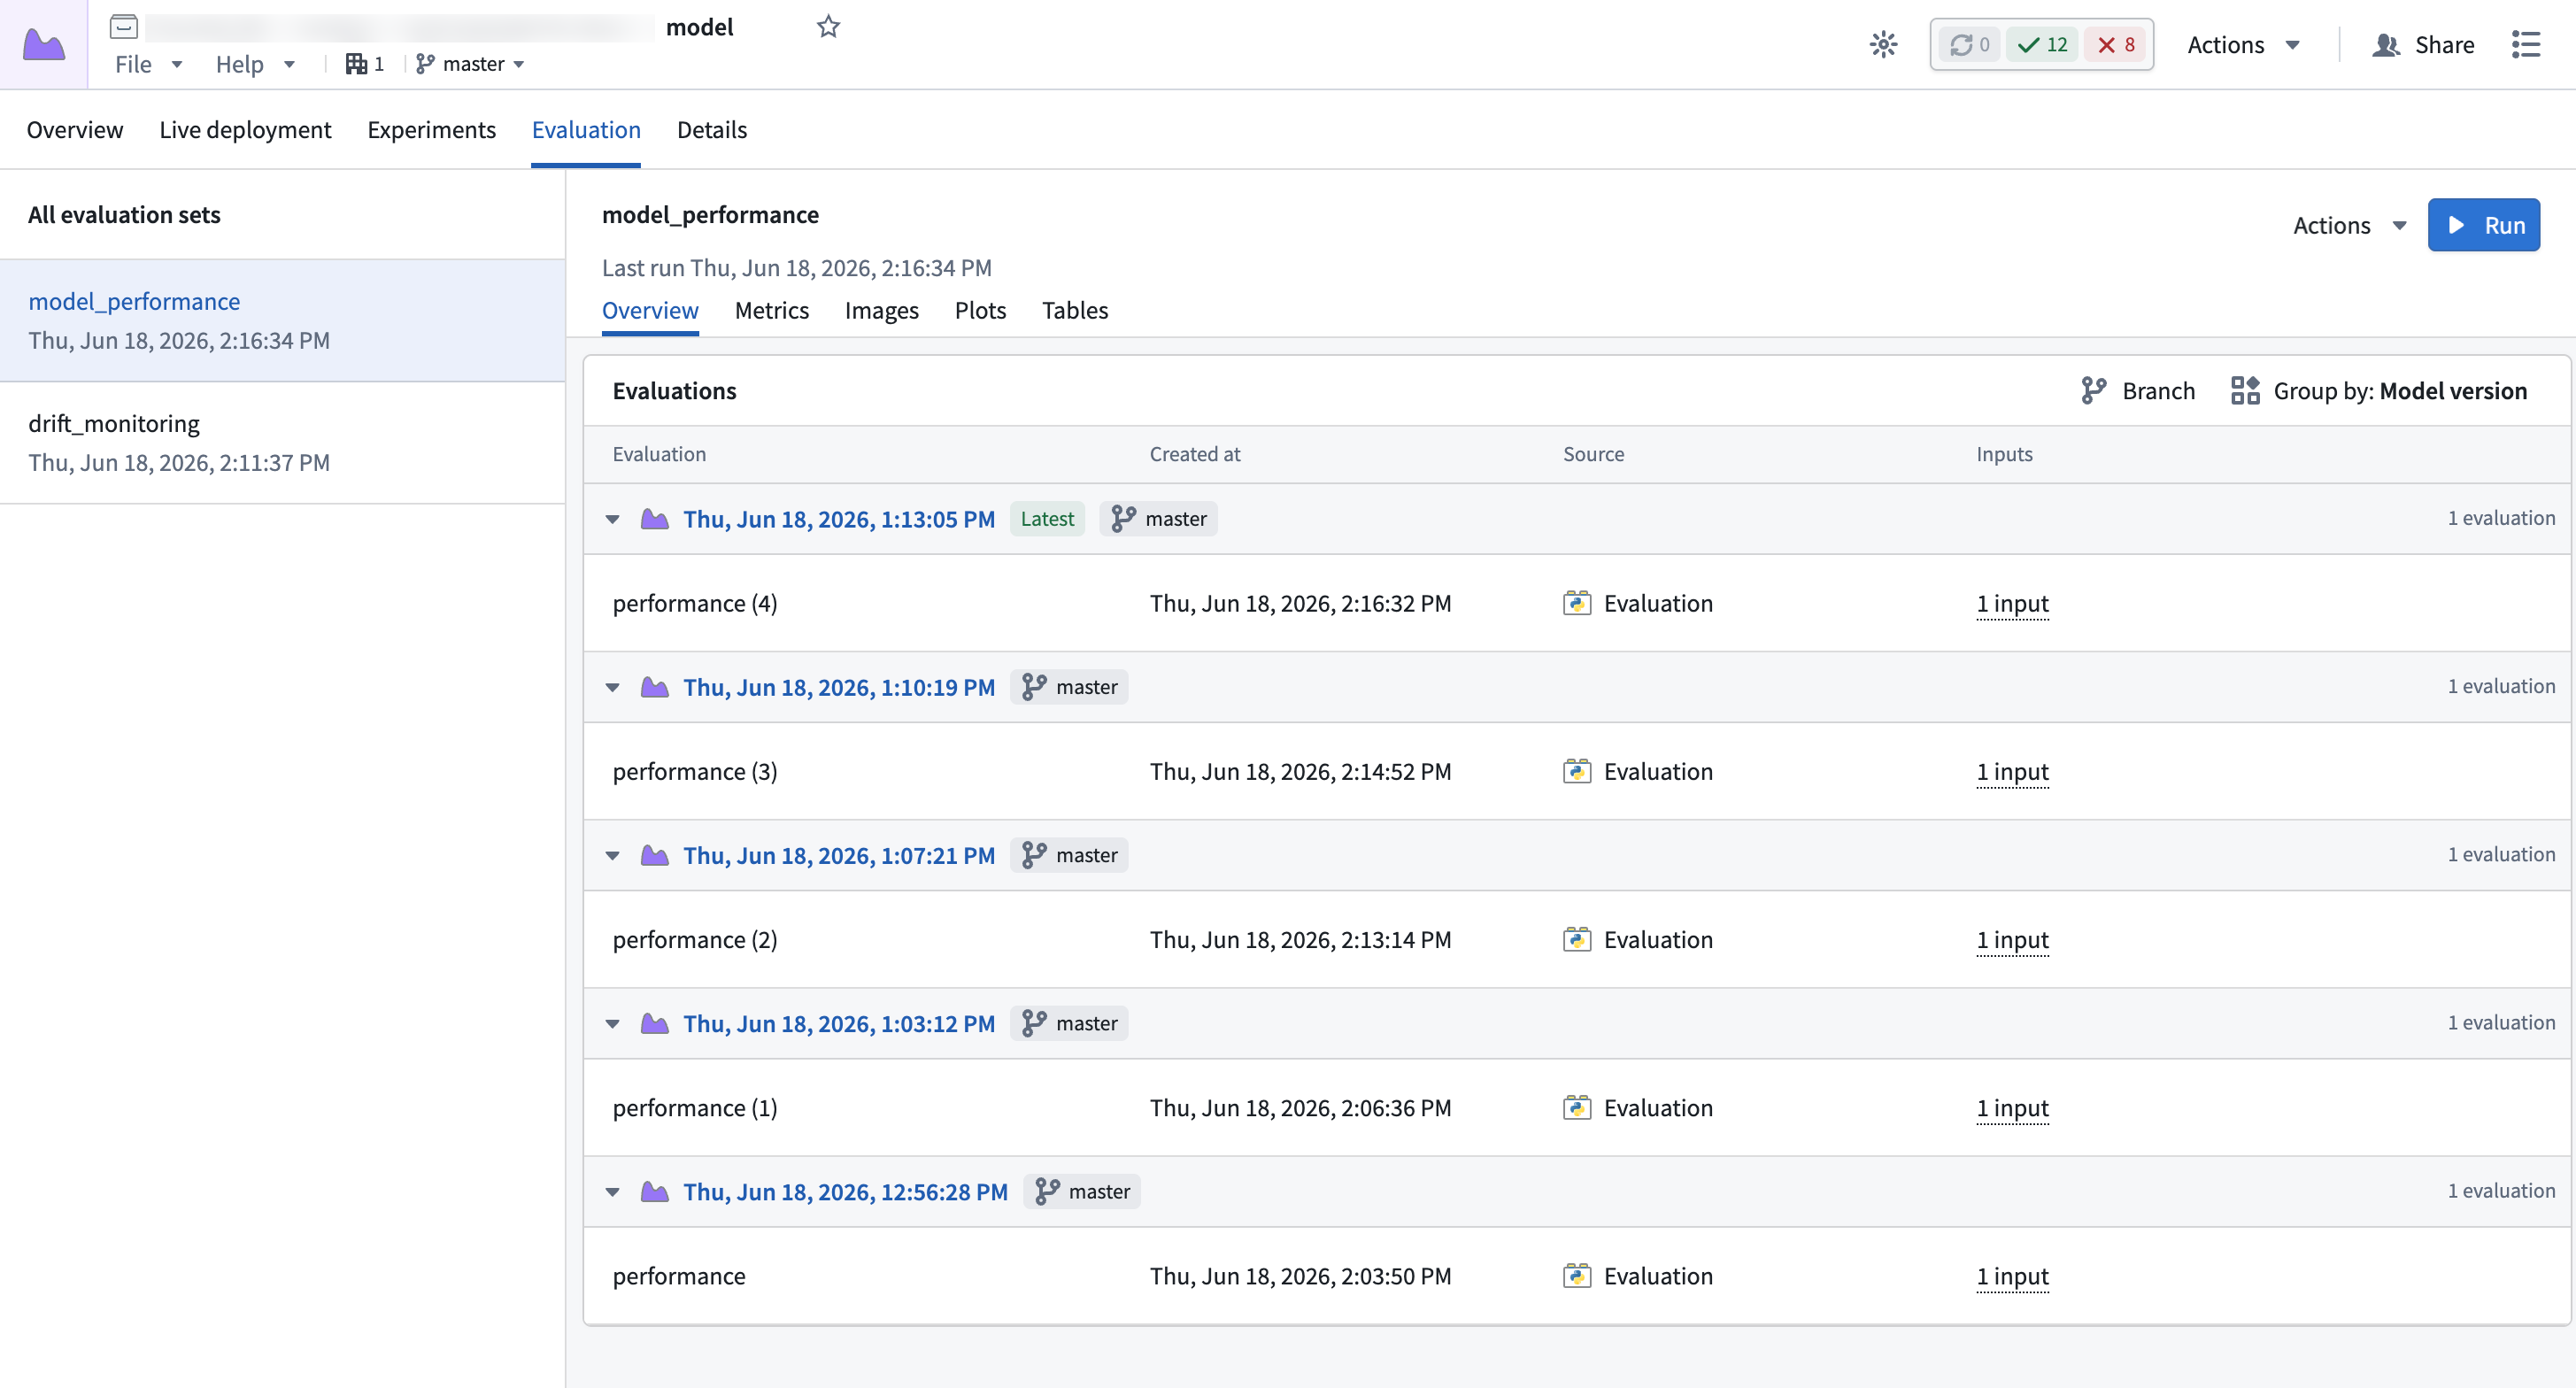
Because every evaluation is tied to a single model version, an evaluation set lets you track how a metric evolves across versions as a model is retrained.
Evaluation sets
An evaluation set is a logical grouping of evaluations that share the same methodology. Every evaluation is always associated with an evaluation set, and a set holds all of the evaluations produced by that methodology across model versions, so you can compare the same analysis as a model is retrained. A model can have up to 100 evaluation sets.
In Code Repositories, this grouping is enforced by the @pm.transforms.evaluation decorator: the set name is fixed in the transform definition, so each run of that transform writes a new, comparable evaluation to the same set. To evaluate a model in a different way, define a separate transform with a different set name.
For example, a regression model predicting housing prices may have two different evaluation sets:
- Nationwide error analysis: Evaluate aggregate error metrics across all predictions (mean absolute error, R²).
- Price tier analysis: Evaluate error metrics broken down by price segment (affordable, mid-range, and luxury), including a residual distribution plot per tier to surface whether the model systematically over- or under-predicts for specific segments.
Create evaluations
The ModelInput class used to import and use models in Code Repositories provides hooks for creating evaluations. Ensure that you have upgraded your code repository and upgraded the palantir_models library to >= 0.2384.0 before writing the evaluation logic:
Copied!1 2 3 4 5 6 7 8 9 10 11 12 13from transforms.api import transform, Input import palantir_models as pm from palantir_models.transforms import ModelInput # This decorator is required to be applied to create evaluations. # The decorator indicates the evaluation set that will be written to on the model input(s). @pm.transforms.evaluation("error_analysis") @transform.using( input_data=Input("..."), model_input=ModelInput("..."), ) def compute(input_data, model_input): evaluation = model_input.create_evaluation(name="my-evaluation")
Evaluation names do not need to be unique. Reused names are automatically made unique, so the same code can run multiple times without renaming the evaluation. If a name is not provided, the evaluation set name is used.
Since evaluations are built on top of existing Python transforms infrastructure, when the build succeeds the evaluation is automatically committed to the evaluation set on the model input. If the build fails, the evaluation is aborted and no results are published.
The code repository where you author evaluation logic must be in the same project as the model you are evaluating. For a complete example, including how to control which model version is evaluated, see Author and run evaluations. To log a standard set of metrics for regression and classification models without writing the logic yourself, see Built-in evaluators. You can also set up the evaluation logic to run on a schedule using the Actions dropdown menu on the evaluations view.
Logging
Evaluations support four types of logs: metrics, images, plots, and tables.
Subsets
Subsets allow you to group related metrics, images, plots, and tables together by using a prefix/name naming convention. Any log that follows this pattern can be grouped by either prefix or value in the UI, making it easy to compare the same metric across different segments or conditions.
Copied!1 2 3 4 5 6 7 8 9 10 11 12 13 14 15# These three metrics are automatically grouped under "nationwide" evaluation.log_metrics({ "nationwide/mae": 14250.0, "nationwide/r2": 0.91, }) # These are grouped under their respective region prefixes evaluation.log_metrics({ "northeast/mae": 12100.0, "northeast/r2": 0.93, "southeast/mae": 13800.0, "southeast/r2": 0.90, "west/mae": 16500.0, "west/r2": 0.88, })
The same pattern applies to images, plots, and tables:
Copied!1 2 3 4# Residual plots grouped by price tier evaluation.log_plot("affordable/residuals", affordable_fig) evaluation.log_plot("mid_range/residuals", mid_range_fig) evaluation.log_plot("luxury/residuals", luxury_fig)
The prefix is arbitrary — the system groups on everything before the first /. The logic for how the data is partitioned into subsets is entirely up to you.
Log metrics
Metrics can be logged using the Evaluation.log_metric and Evaluation.log_metrics functions. Metric values must be numeric (int or float).
Copied!1 2 3 4 5evaluation.log_metric("mae", 14250.0) evaluation.log_metrics({ "mae": 14250.0, "r2": 0.91, })
Log images
Images can be logged using Evaluation.log_image. Images must be in PNG format or a Pillow ↗ image; other image formats will be rejected.
Copied!1 2 3 4 5 6 7evaluation.log_image("residual_distribution", pillow_image) evaluation.log_image("predicted_vs_actual", image_bytes_arr) evaluation.log_image( "error_heatmap", "path/to/image.png", caption="Geographic error heatmap", )
Image logging can also serve as a way to log custom charts.
Copied!1 2 3 4 5 6 7import matplotlib.pyplot as plt plt.scatter(predicted_prices, residuals) plt.xlabel("Predicted Price") plt.ylabel("Residual") plt.savefig("path/to/residuals.png") evaluation.log_image("residual_scatter", "path/to/residuals.png")
Log plots
Plots can be logged using Evaluation.log_plot. Plots must be provided as a Plotly ↗ plotly.graph_objects.Figure; other plot types will be rejected.
Copied!1 2 3 4 5 6 7 8 9import plotly.express as px fig = px.box(df, x="price_tier", y="residual", title="Residuals by Price Tier") evaluation.log_plot("residuals_by_tier", fig) evaluation.log_plot( "predicted_vs_actual", fig, description="Predicted vs. actual prices across all tiers", )
Log tables
Tables can be logged using Evaluation.log_table. The provided table must be either a pandas ↗ or Polars ↗ DataFrame; other data types will be rejected.
Copied!1 2 3 4 5 6 7 8 9import pandas as pd error_by_tier = pd.DataFrame({ "price_tier": ["affordable", "mid_range", "luxury"], "mae": [8200.0, 15400.0, 42300.0], "r2": [0.94, 0.91, 0.87], }) evaluation.log_table("error_by_price_tier", error_by_tier)
Limits
The below table lists limits related to evaluations in Foundry.
| Description | Limit |
|---|---|
| Metric name max length | 100 characters |
| Image, plot, or table name max length | 100 characters |
| Image caption max length | 200 characters |
| Maximum upload size per image, plot, or table | 5 MB |
| Maximum number of rows per table | 100,000 |
| Maximum evaluation sets per model | 100 |
To increase these limits, contact Palantir support.
Review the model evaluations Python API reference for more information.