- Capabilities
- Getting started
- Architecture center
- Platform updates
Log search
The Search logs tab in Workflow Lineage allows you to search service logs across executions. Use log search to investigate recurring errors, find a specific message, or compare logs from different resources in a workflow.
Log search modes
Global log search is available on all cloud enrollments. Non-cloud enrollments use single-source-executor search instead.
Single-source-executor search
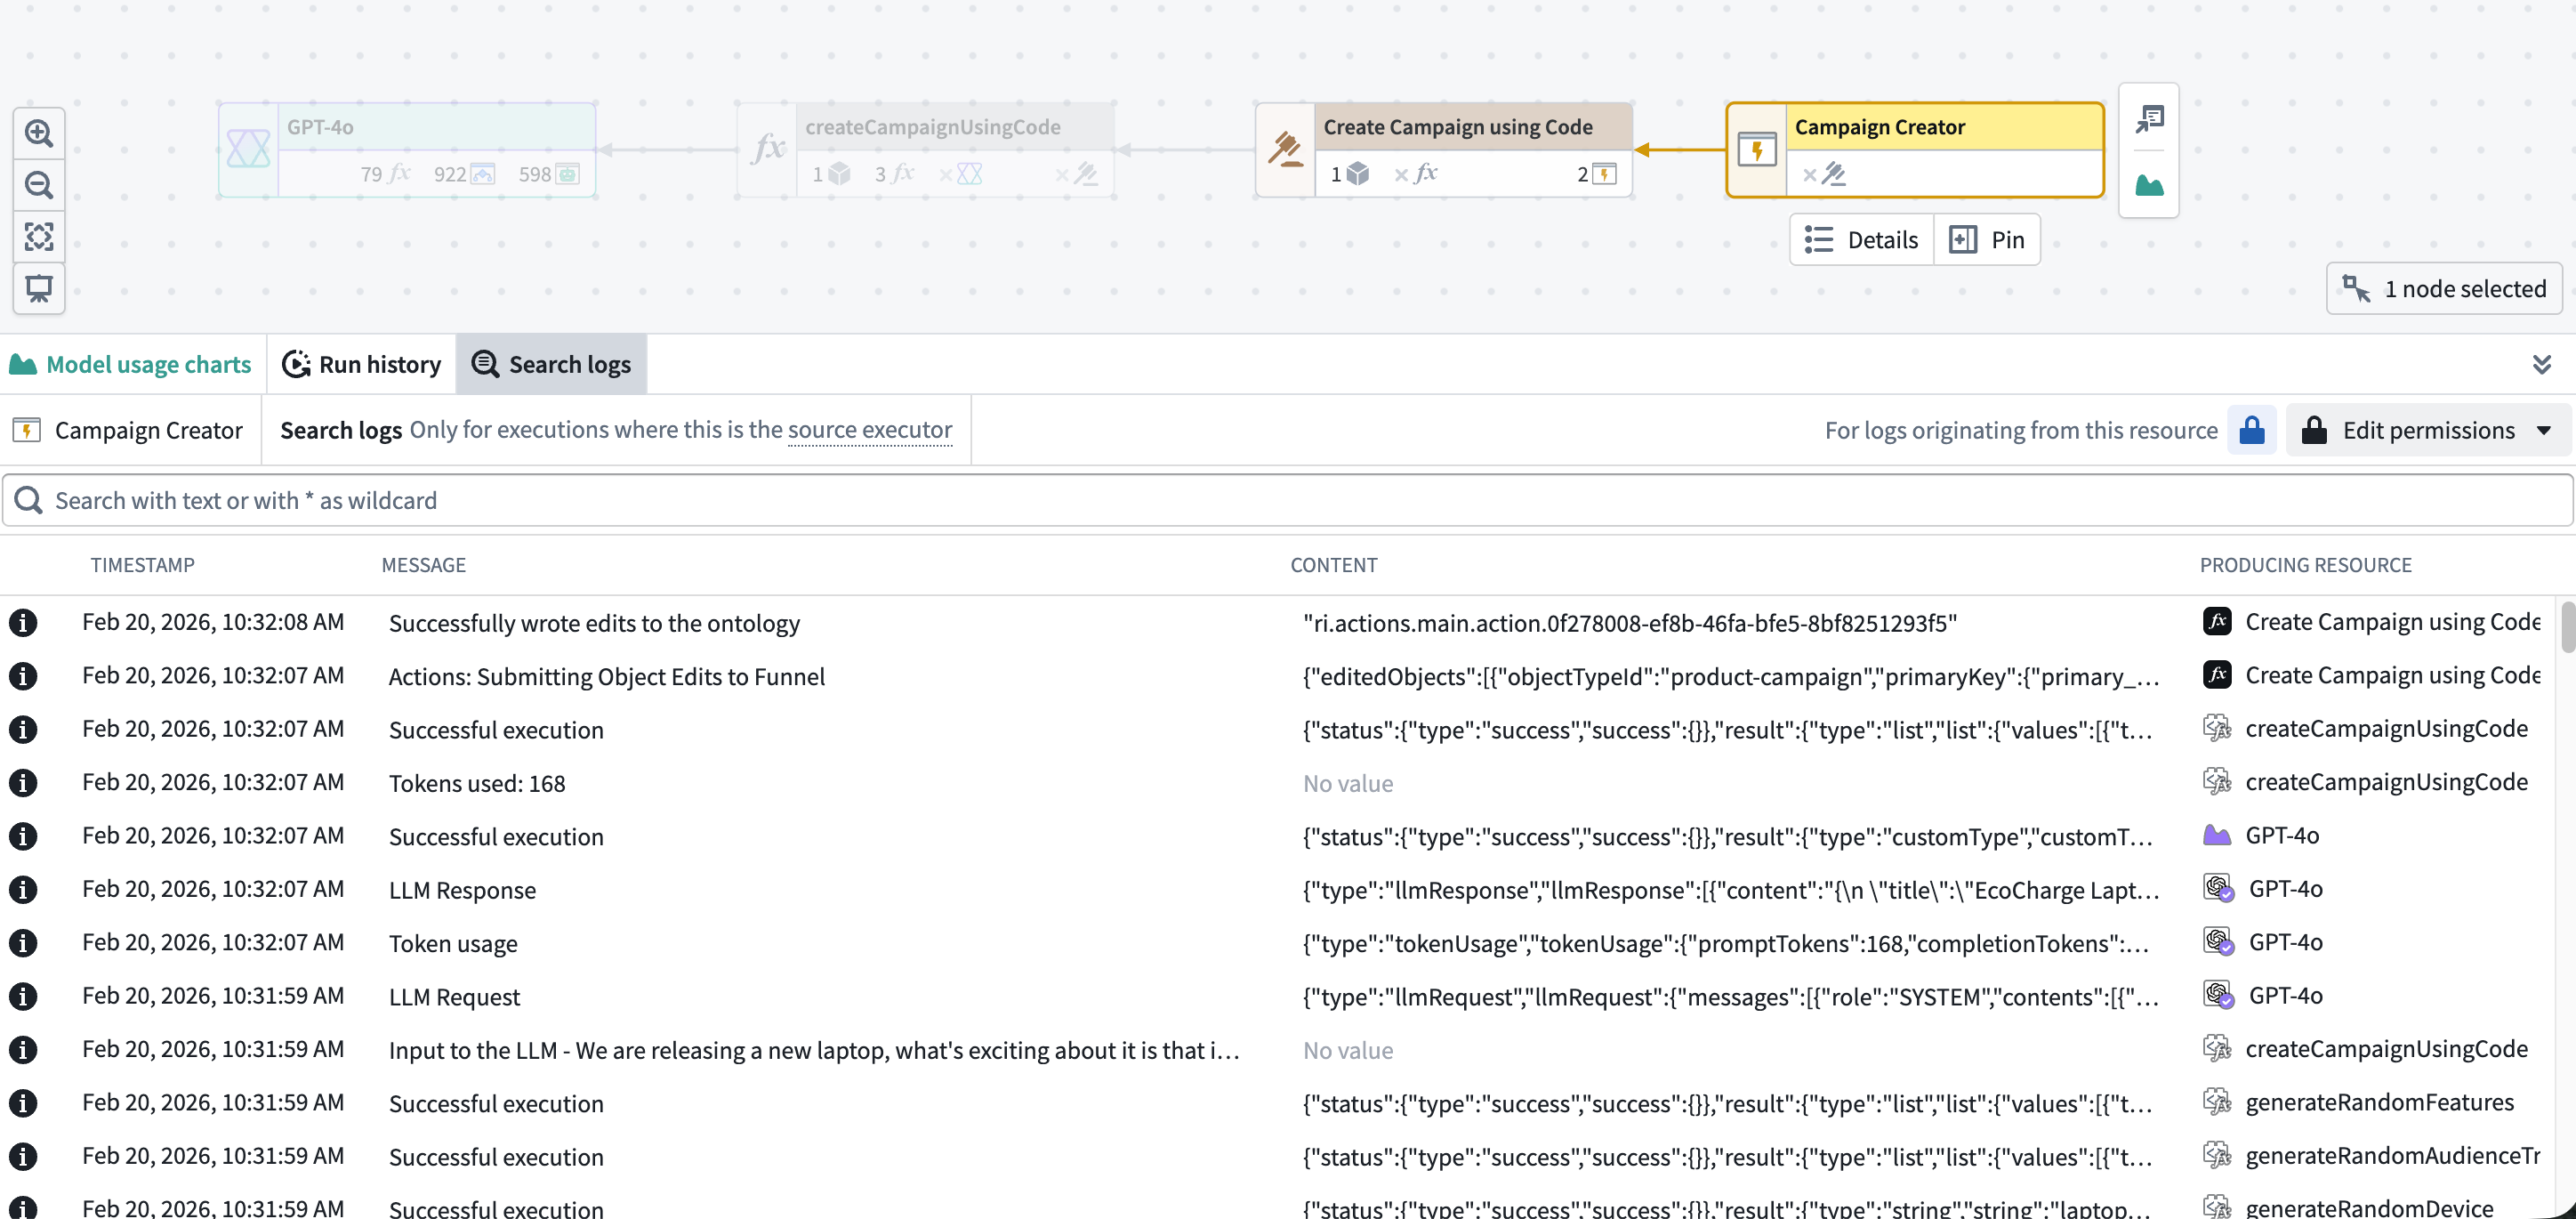
Single-source-executor search searches executions that originated from a specific source executor. A source executor is the first executable resource in a call chain, such as a function, action, automation, AIP Logic function, AIP Chatbot, or model live deployment.
If the selected resource was called by another resource, its logs are not included because it was not the source executor. Search from the resource that started the call chain instead.
Source executor suggestions
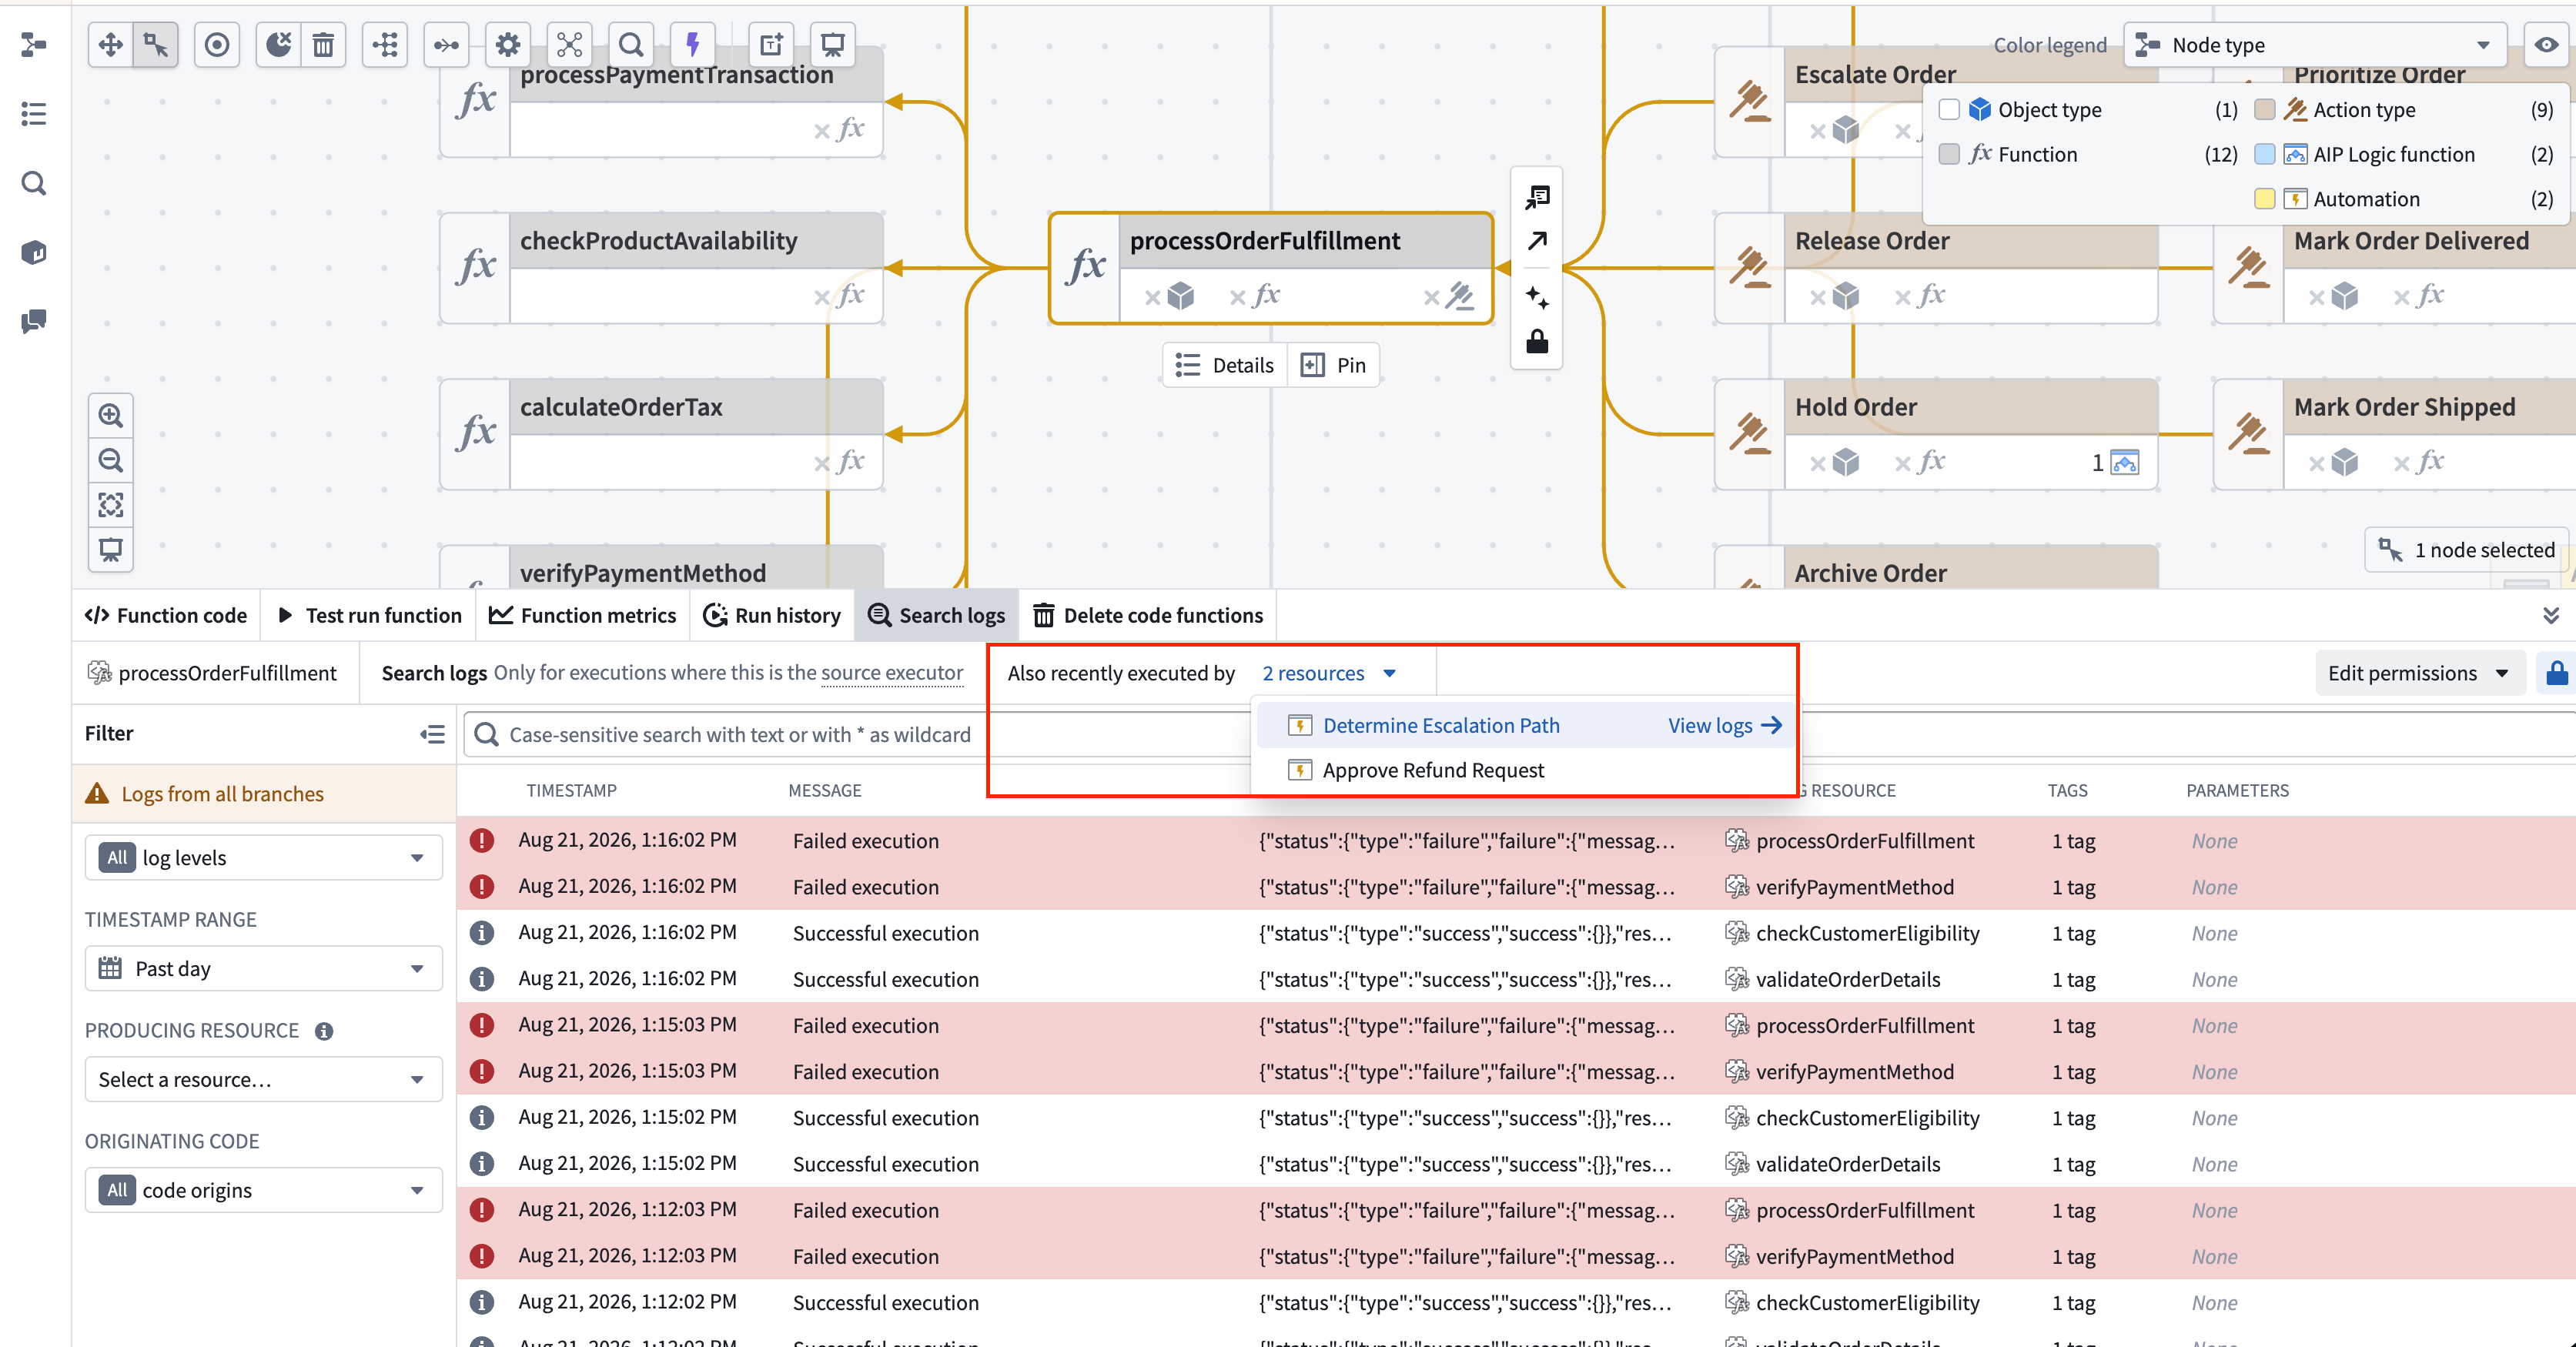
If no logs are found for the selected resource, the Search logs panel checks whether it was recently called by other source executors and displays them as suggestions. Select a suggested source executor to navigate to that node in the graph and search its logs instead.
The panel header also displays an Also recently executed by indicator. Select this indicator to view and navigate to source executors that recently called the selected resource.
Global log search
Global log search allows you to search executable resources across a Workflow Lineage graph. Unlike single-source-executor search, it does not always treat a selected node as the source executor.
With one supported node selected, the search behavior depends on its resource type:
- Functions, AIP Logic functions, actions, AIP Chatbots, model live deployments, and language models: Search logs emitted by the selected node as the log-producing resource. Results include logs from executions that originated from another source executor.
- Automations: Search logs from executions that originated from the selected automation.
Other resource types are not currently supported in global log search.
Language model logs only appear in global log search when the model is called from a supported source executor, such as a function or AIP Logic function. To search logs for a specific language model, select its node in the graph or choose Language model in the Producing resource filter.
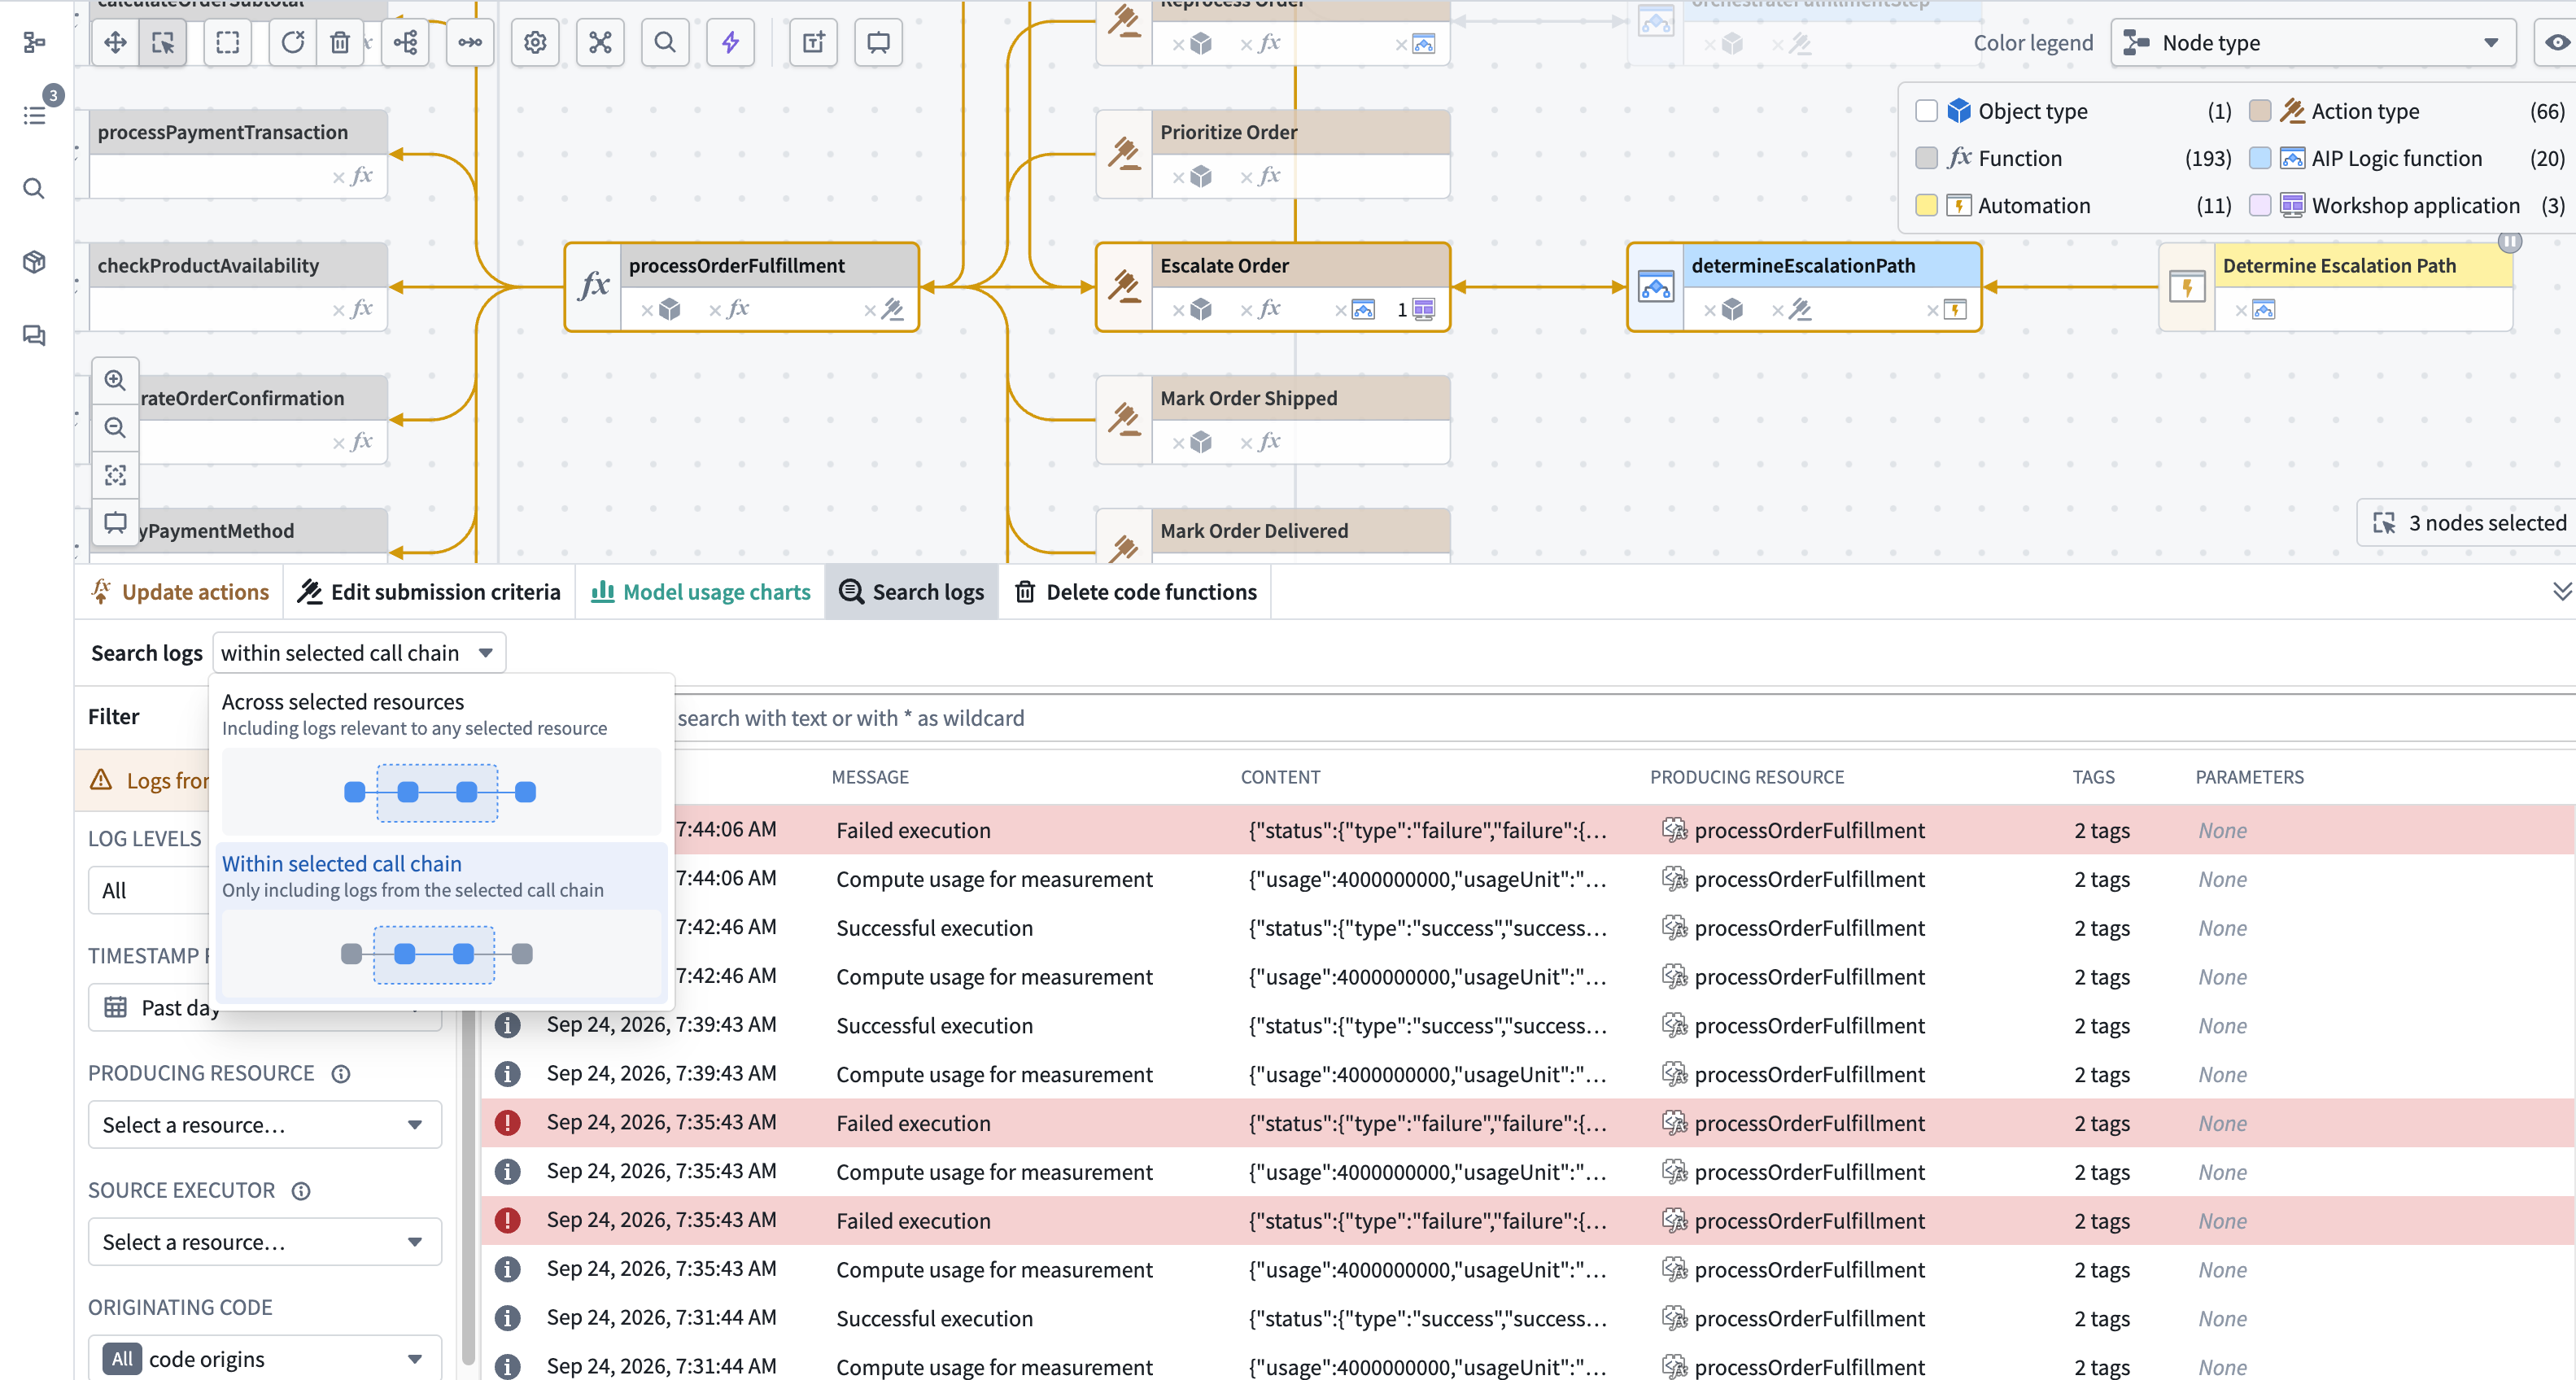
With multiple supported nodes selected, choose how to resolve the search scope:
- Across selected resources: Include logs where any selected resource is either the producing resource or the source executor, regardless of the call chain. Results can include logs from call chains that are not displayed in the graph. This option is selected by default.
- Within selected call chain: Restrict results to logs from call chains contained within the selection, where both the producing resource and source executor are selected.
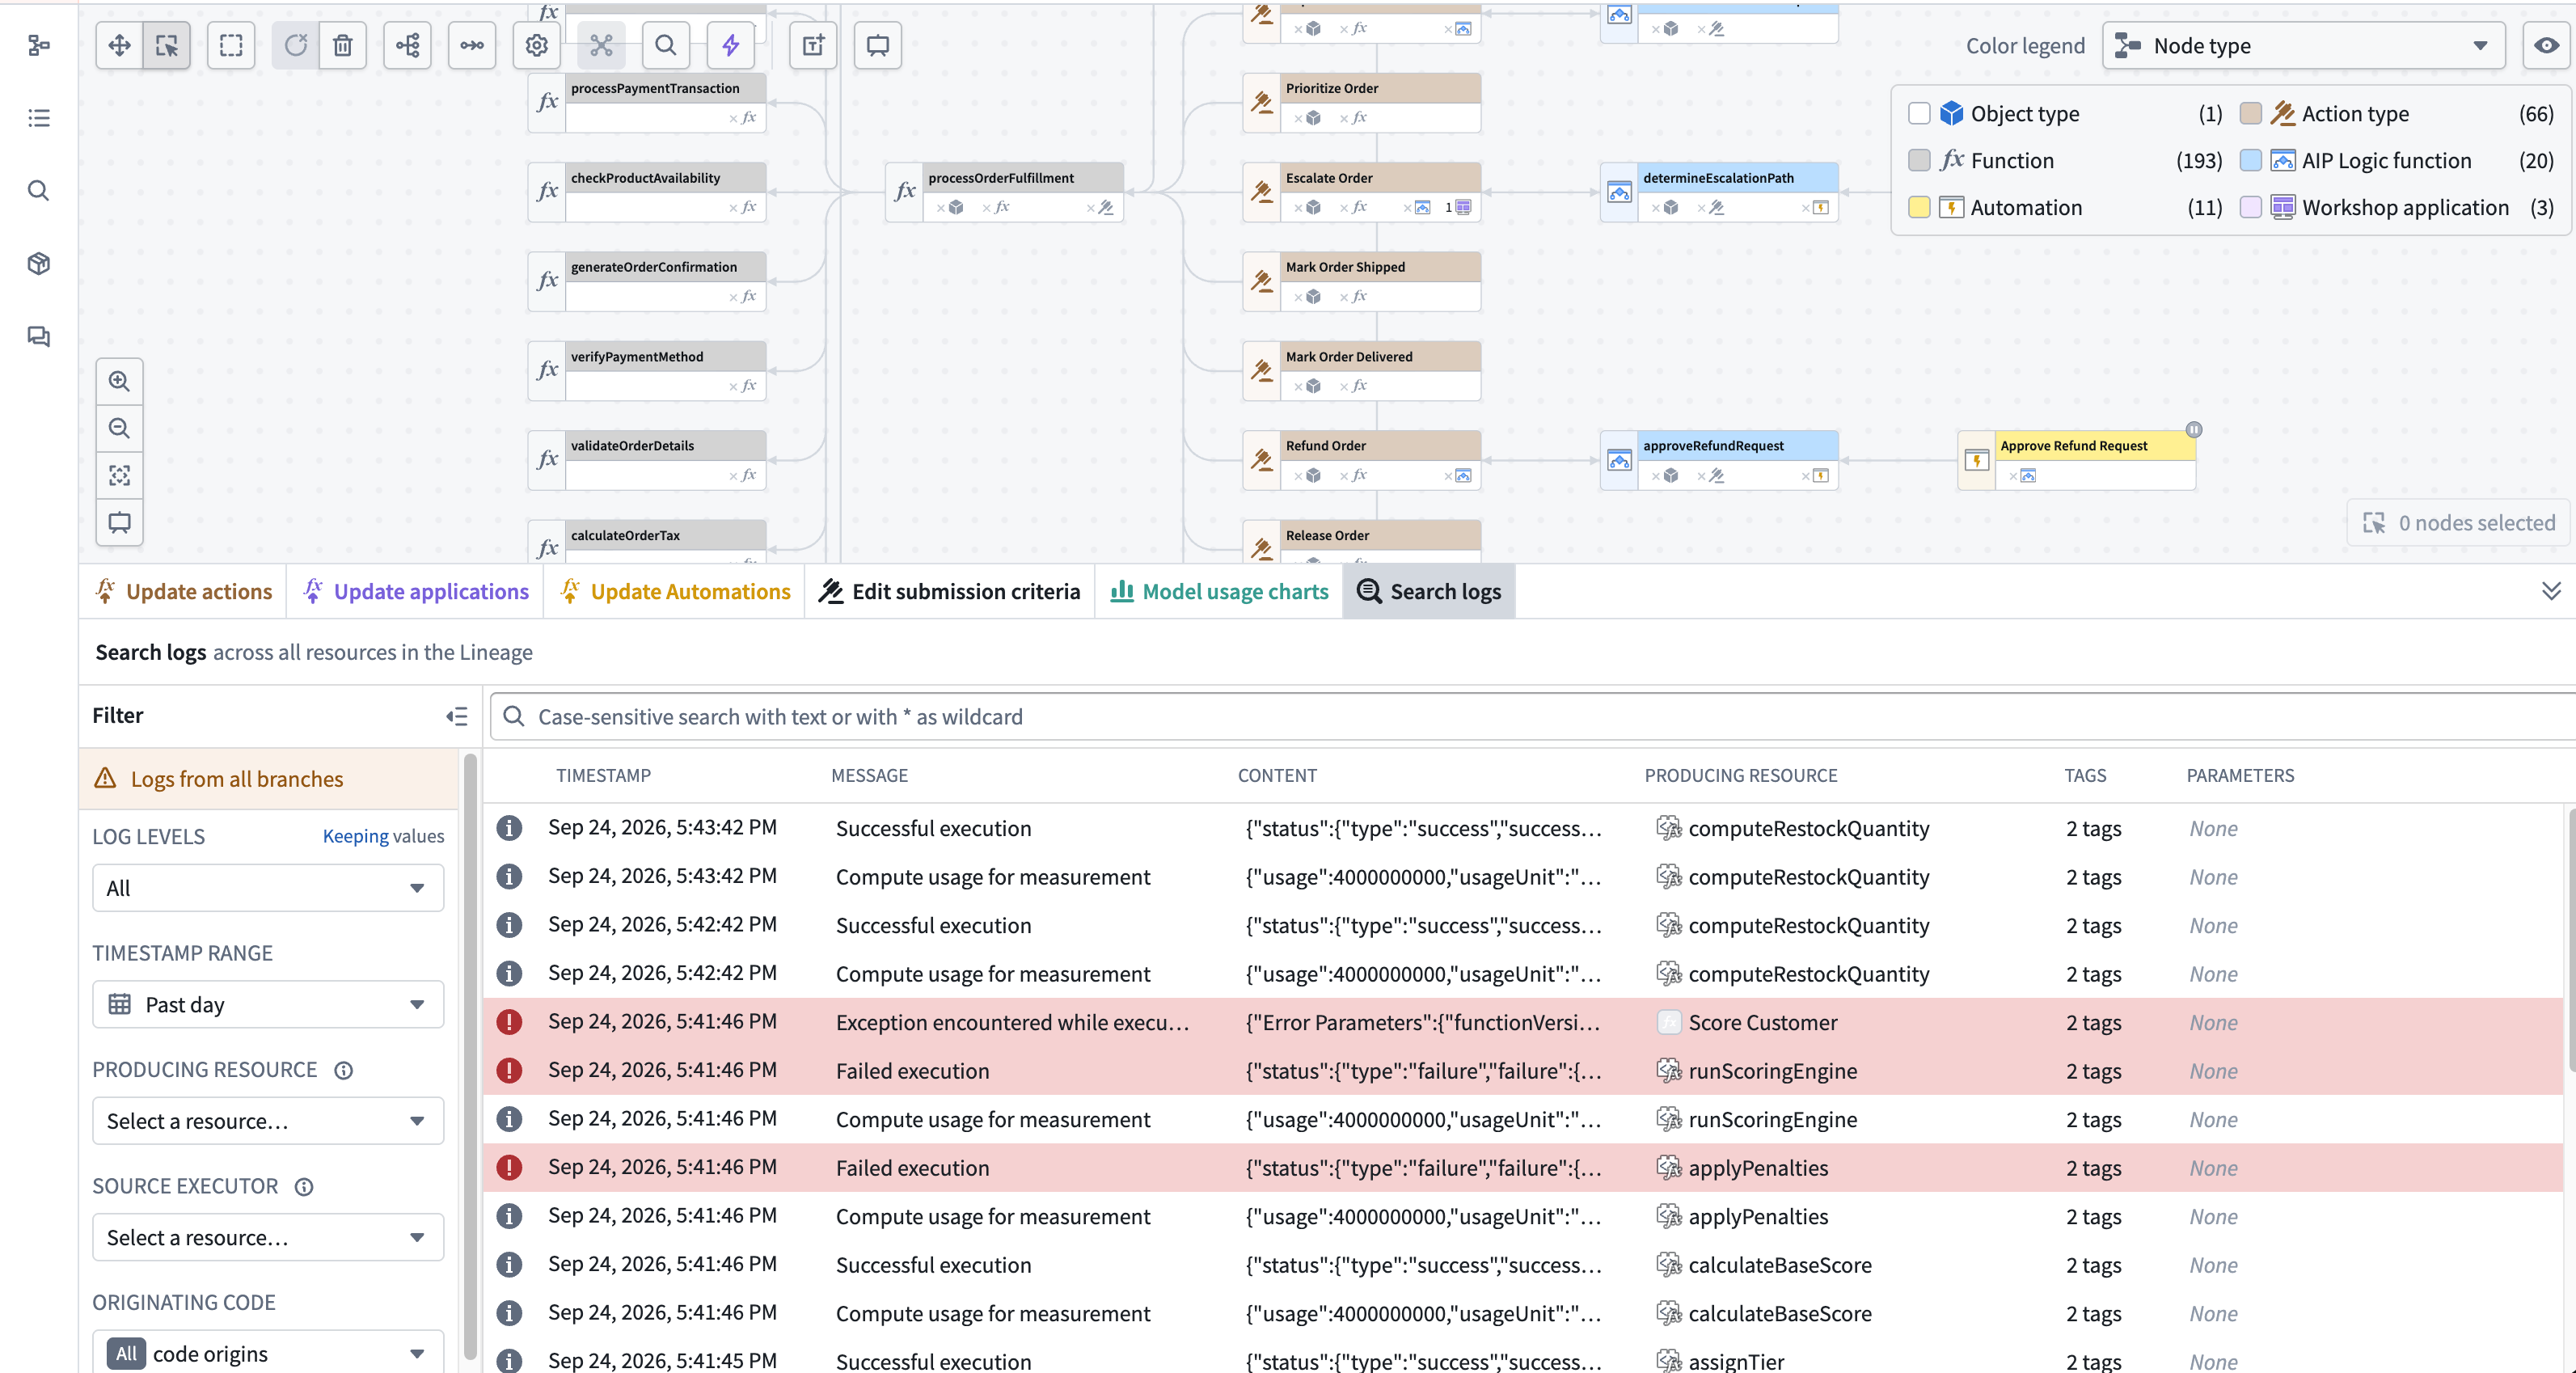
With no nodes selected, global log search searches across all supported resources in the graph.
Access log search
To access log search:
- Open Workflow Lineage and navigate to the workflow that you want to investigate.
- Select the resource nodes that you want to search. For global log search, you can leave all nodes unselected to search the entire graph.
- Select the Search logs tab in the bottom panel.
- If you selected multiple supported resources, use the scope menu next to Search logs to search Across selected resources or Within selected call chain.
Search and filter logs
Enter text in the search bar to match against the full log line, including the Message and Content fields. Search is case-sensitive. You can use * as a wildcard character to match any sequence of characters.
For example:
connection failedfinds log lines that contain that exact phrase.timeout*retryfinds log lines wheretimeoutis followed byretry, with any characters between them.ErrorfindsError, but noterrororERROR.
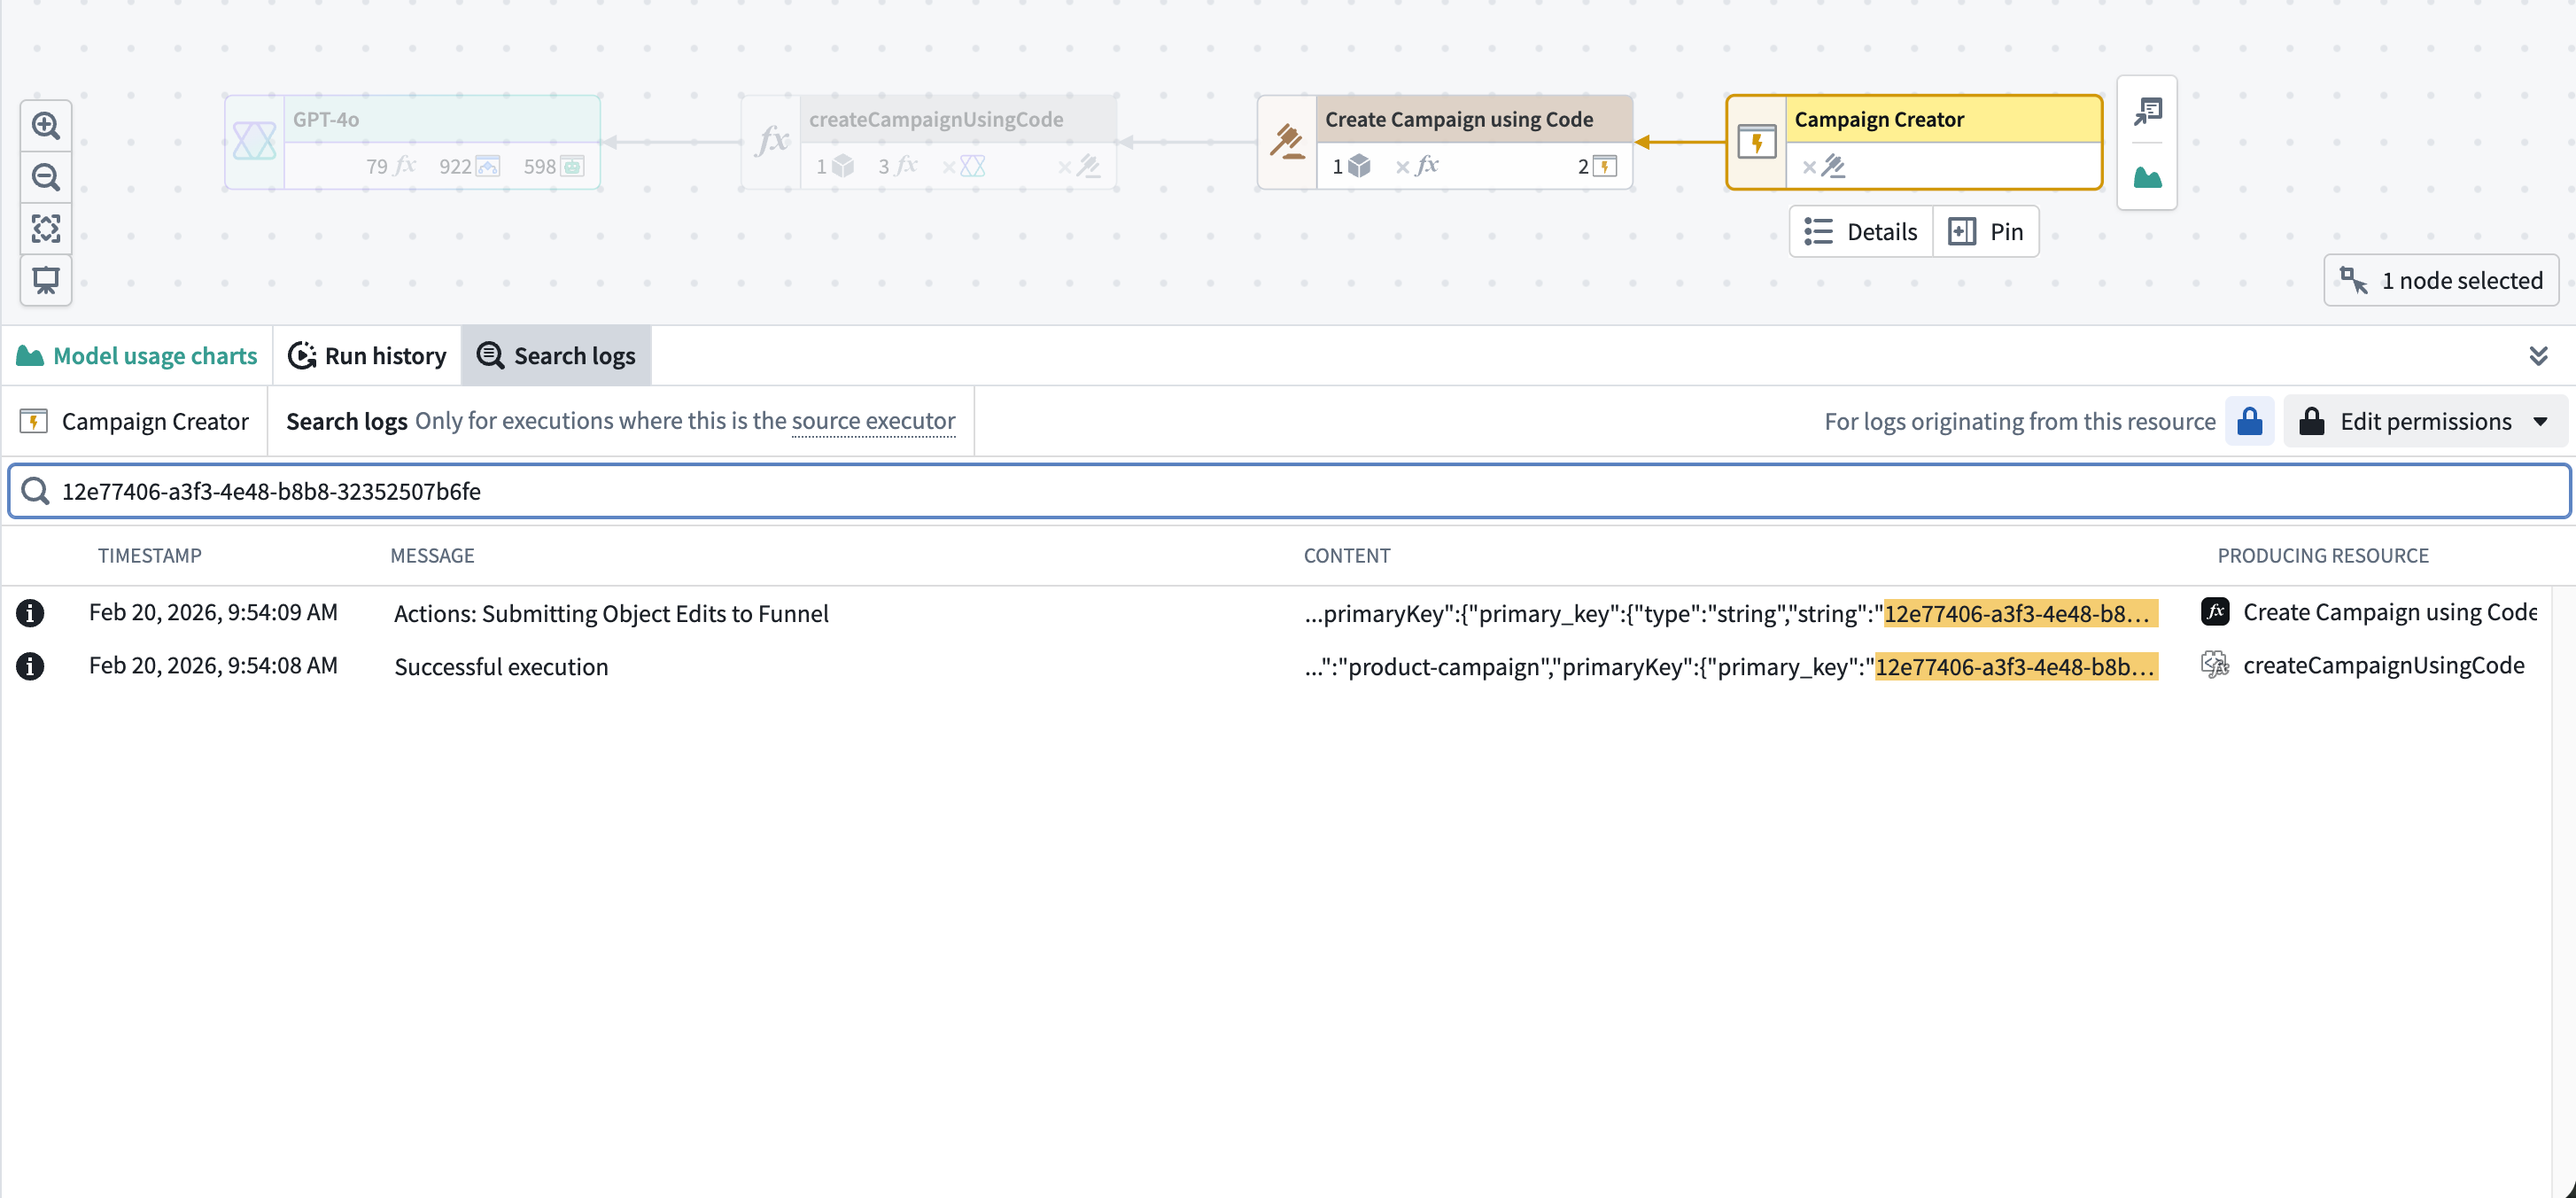
Use the filter sidebar to narrow the results. Depending on your search scope, available filters include:
- Log level: Show logs with a specific severity, such as
ERROR,WARN, orINFO. - Timestamp range: Choose a relative time range or a custom start and end time. The default is the past day. In single-source-executor search, the selectable range is limited to your enrollment's log retention period, which the date picker displays. In global log search, the maximum selectable range is 30 days.
- Producing resource: Show logs emitted by a specific resource in the call chain.
- Source executor: Show logs associated with a specific source executor.
- Originating code: Show logs from user code only, or from Foundry only.
When you apply multiple filters, a log must match every filter. Select Reset to restore the default filters.
Results table
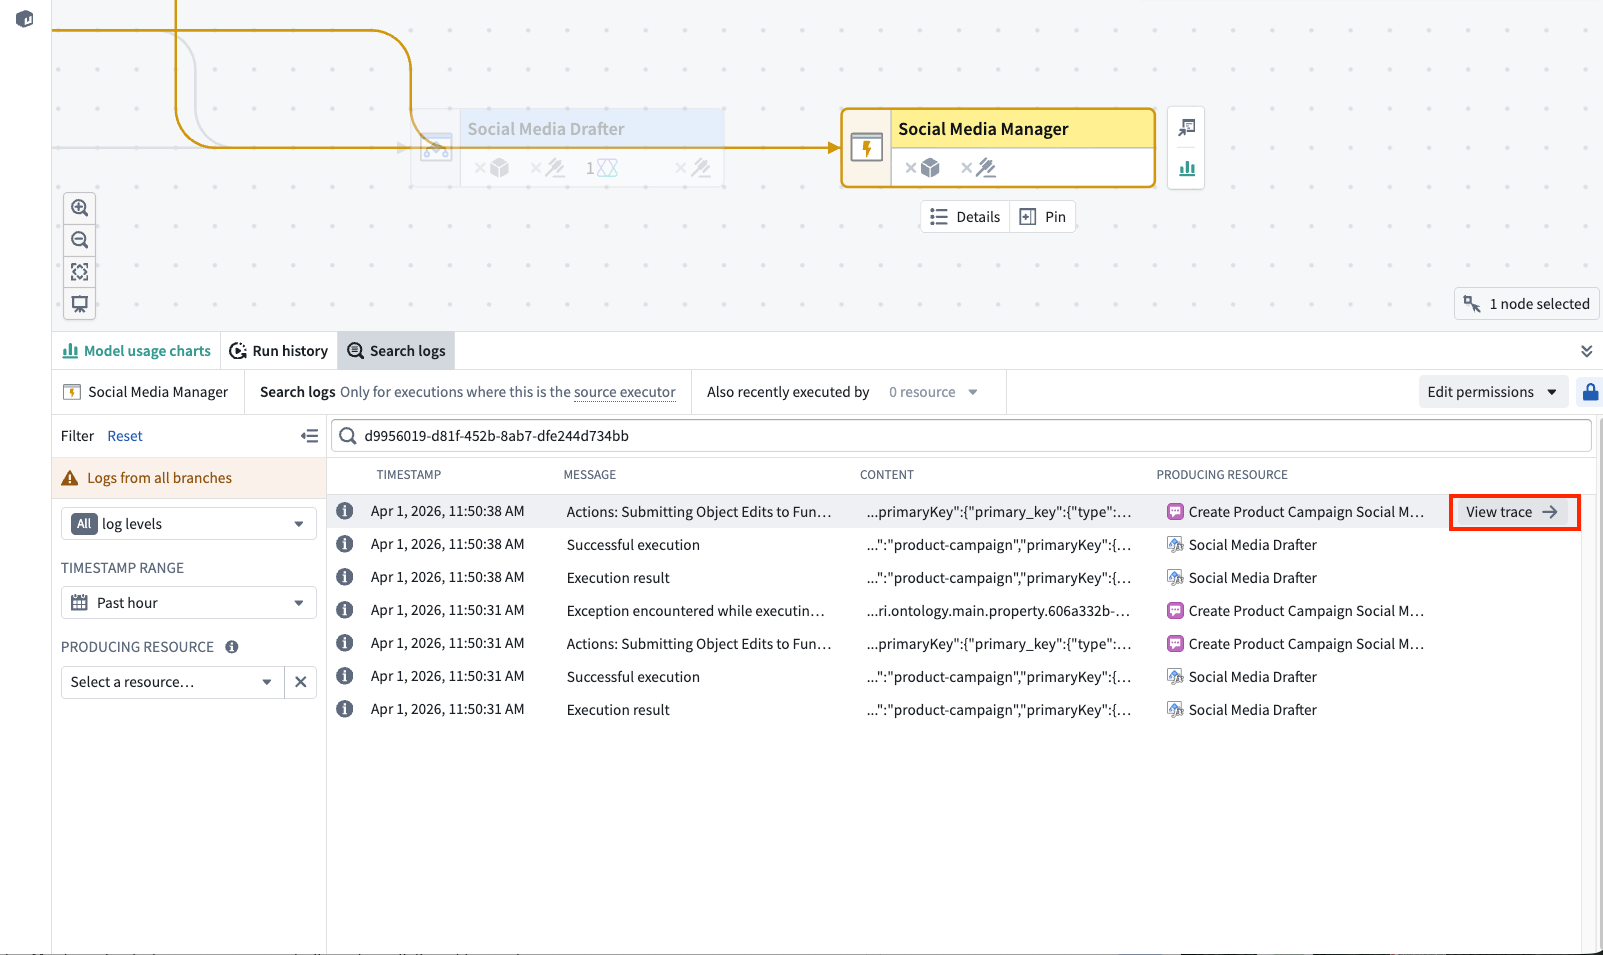
Results appear with the most recent logs first. The columns displayed can vary based on the search mode and scope:
| Column | Description |
|---|---|
| Log level | A color-coded icon indicating the log severity: red for ERROR and FATAL, orange for WARN, and neutral for INFO, DEBUG, and TRACE |
| Timestamp | The date and time when the log entry was recorded |
| Message | The primary log message |
| Content | Additional structured content, often in JSON format |
| Producing resource or Source executor | The resource that emitted the log entry, or the resource from which the execution originated. Only one of these two columns appears at a time |
| Tags | Tags associated with the log entry |
| Parameters | Parameters associated with the log entry |
Which one appears depends on the search scope. Single-source-executor search displays Producing resource, as does global log search across the graph or multiple resources. When global log search is narrowed to a specific log-producing resource, the table displays Source executor instead.
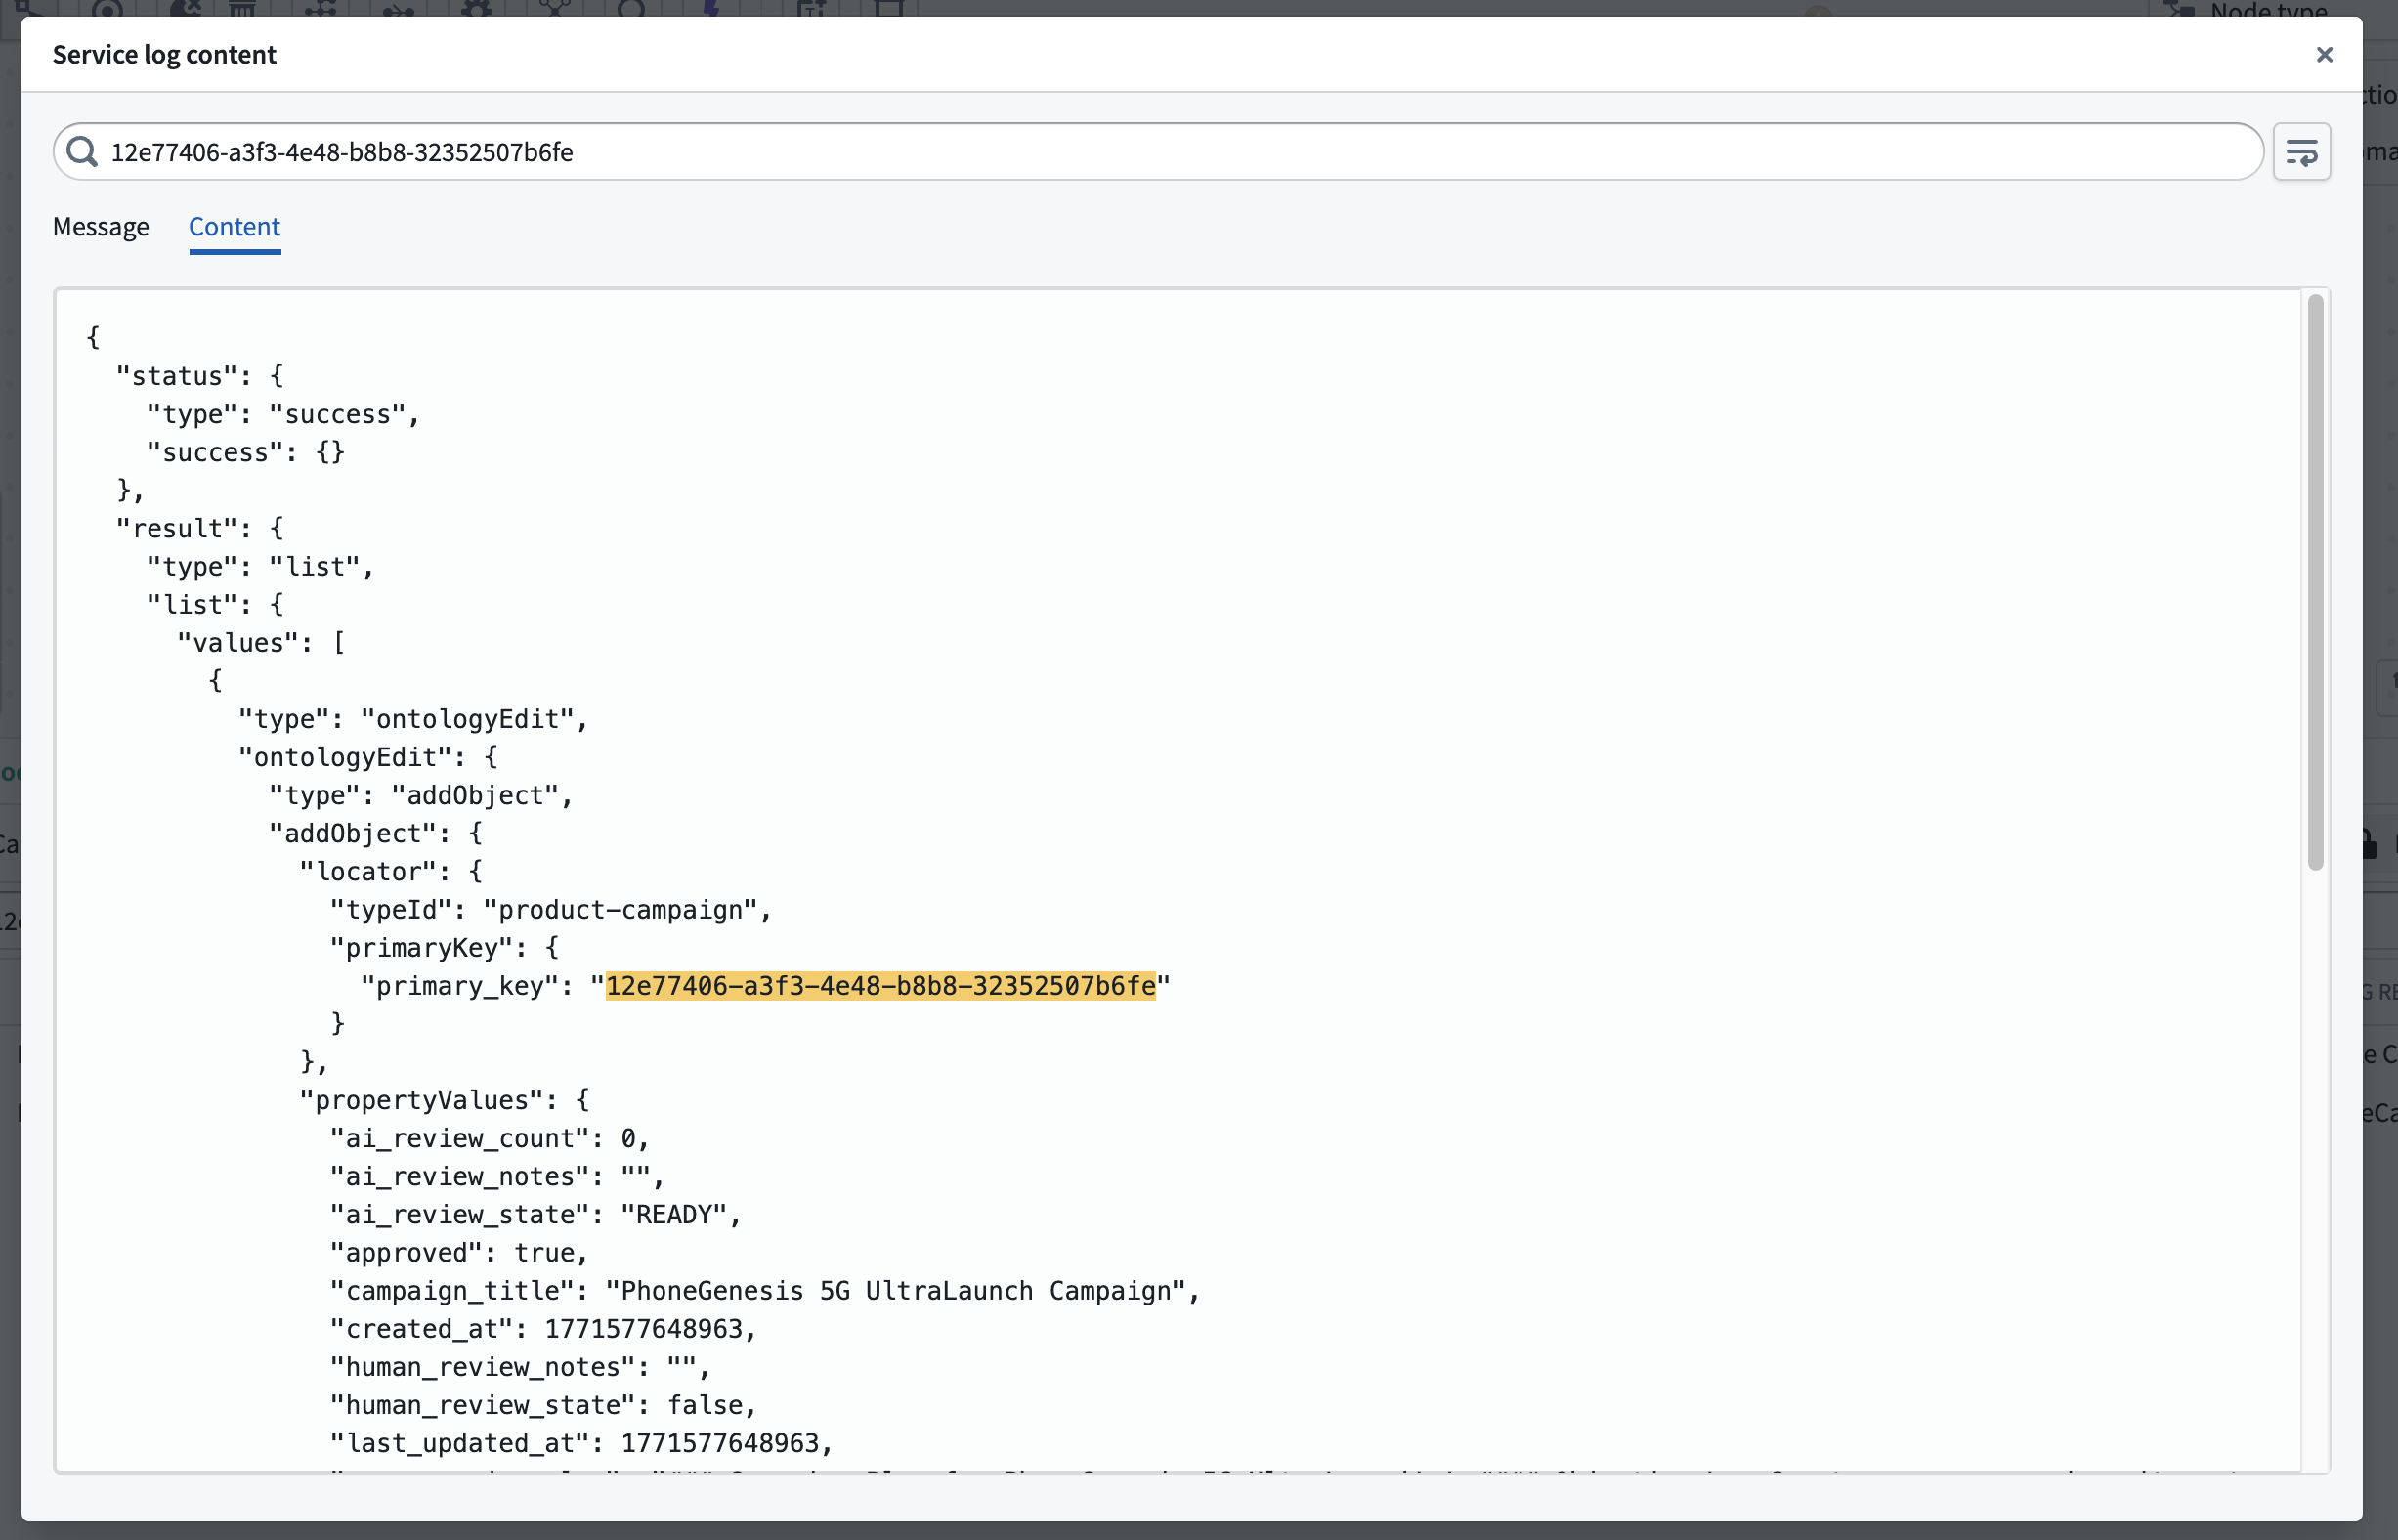
Matching search text is highlighted in the Message and Content columns.
Results load in pages of 100 entries for single-source-executor search and 25 entries for global log search. Scroll to the end of the table to load more results. The search is not a live stream. Change a filter or reload the view to include logs produced after the search began.
Select a Message or Content cell to inspect the complete log entry. The detail view provides Message and Content tabs, a search bar for finding text within the entry, and a Wrap lines toggle for long log lines.
To investigate the execution that produced a result, hover over the row and select View trace. Workflow Lineage opens the trace view, where you can review the execution timeline and the resources in the call chain.
Permissions and retention
Log search has additional access requirements beyond execution history. Access to an execution in run history does not necessarily grant access to its logs. To search shared execution logs, you need the foundry-telemetry-service:view-execution-history operation on the resource. By default, the Editor role grants this operation, but an enrollment administrator can grant it through a custom role. An administrator must also enable log access with markings that you can access.
If log access is not enabled, you can only search logs from your own executions during the past 24 hours. This exception is not available on CBAC enrollments, where log access must be enabled.
Available results are limited by your enrollment's log retention policy. Logs outside the retention period do not appear in search results.
For details about access requirements and configuration, see log permissions.
Related features
- Service logs: View logs for a specific execution.
- Execution history: Browse recent executions for a resource.
- Trace views: Review an execution timeline and correlate it with logs.
- Log permissions: Configure access to logs.