- Capabilities
- Getting started
- Architecture center
- Platform updates
Announcements
REMINDER: Sign up for the Foundry Newsletter to receive a summary of new products, features, and improvements across the platform directly to your inbox. For more information on how to subscribe, see the Foundry Newsletter and Product Feedback channels announcement.
Share your thoughts about these announcements in our Developer Community Forum ↗.
Direct OpenAI model family available for US georestricted enrollments
Date published: 2025-11-25
In addition to non-georestricted enrollments, US georestricted enrollments can now enable Direct OpenAI as a model family in AIP. This model family is separate from the Microsoft Azure model family, although the model offerings will often look the same. Turning on Direct OpenAI for an enrollment offers the following key benefits:
- Increased capacity: By enabling Direct OpenAI, your enrollments gain access to additional model capacity.
- Faster model access: New OpenAI models will become available in AIP more quickly through Direct OpenAI, minimizing delays for using new models.
How to enable
To enable these models, enrollment administrators must enable Direct OpenAI in Control Panel.
Usage restrictions
OpenAI models provided directly from OpenAI (not via Azure) including GPT-4o. Use of these models must be consistent with the OpenAI Usage Policies ↗ and the OpenAI Sharing & Publication Policy ↗.
Your feedback matters
We want to hear about your experiences using language models in the Palantir platform and welcome your feedback. Share your thoughts with Palantir Support channels or on our Developer Community ↗ using the language-model-service tag ↗.
Work with Snowflake tables directly in Code Workspaces
Date published: 2025-11-20
You can now import Snowflake tables as virtual tables into JupyterLab® code workspaces, enabling you to work with large-scale data stored externally to Foundry without moving it.
What's new
Code Workspaces now supports read and write operations on Snowflake tables, including Iceberg tables cataloged in Polaris. Iceberg tables are open-source table formats that enable reliable, scalable, and efficient management of large datasets, including tables stored externally in Snowflake.
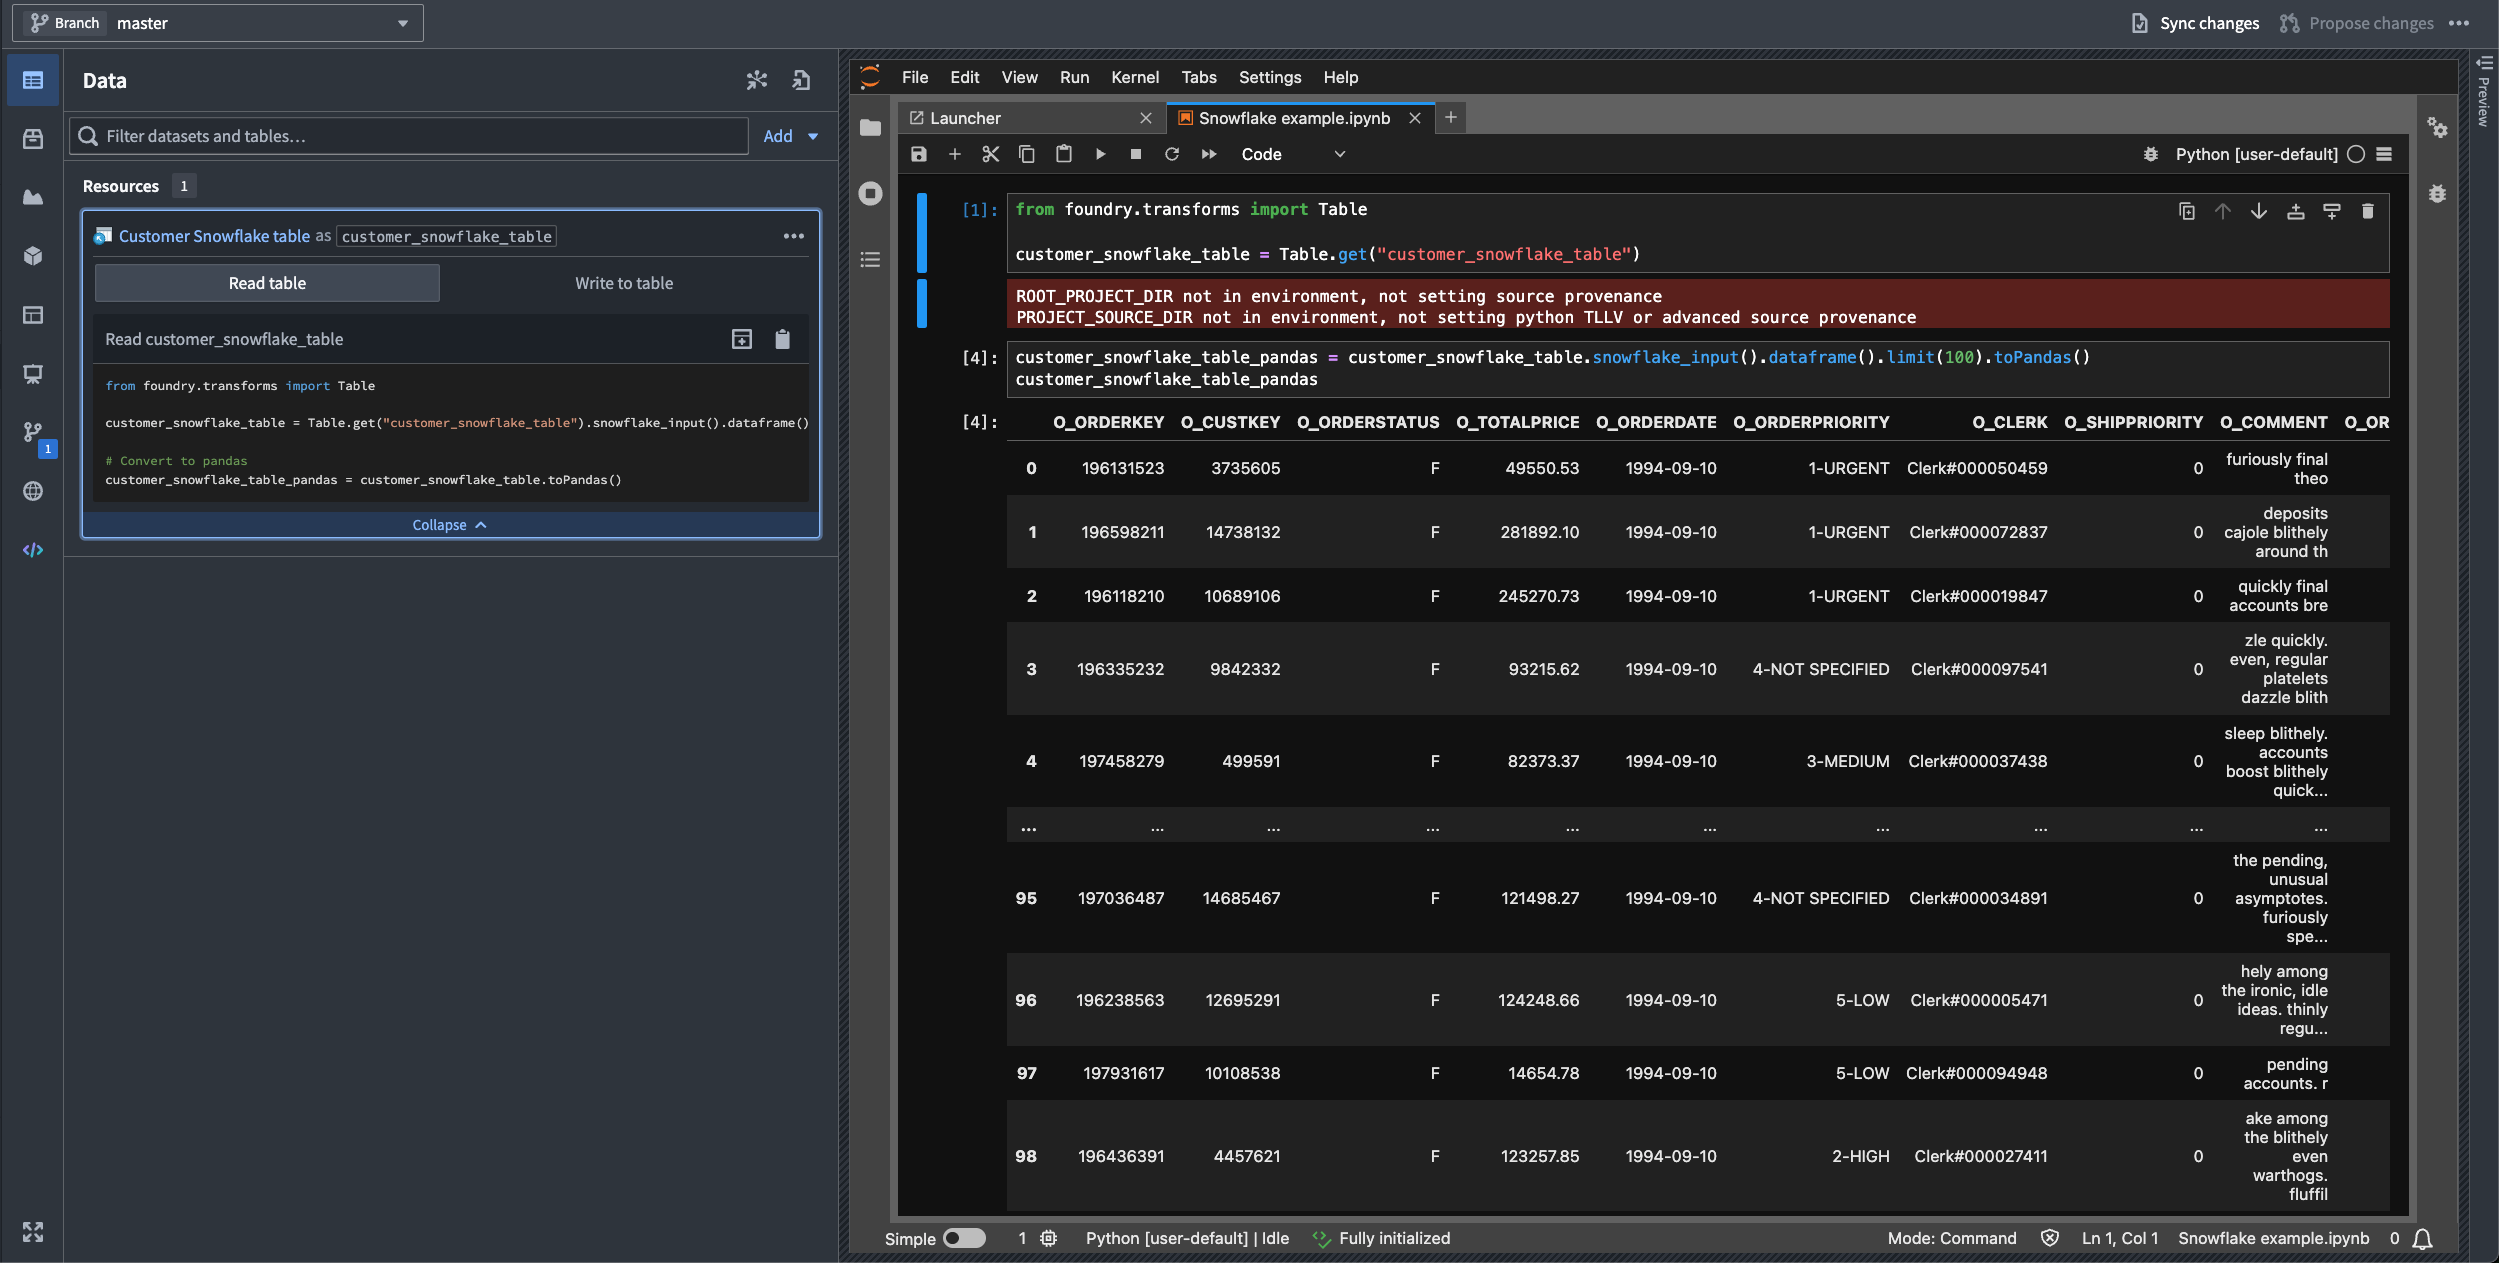
A highlighted code snippet in the Data panel.
Why this matters
This capability allows you to run interactive Python notebooks directly against data cataloged in Snowflake, supporting data science, analytics, and machine learning workflows without requiring data replication into Foundry. By working with data where it lives, you can leverage Snowflake's storage and cataloging while using Foundry's development environment.
Learn more about virtual tables and Code Workspaces.
Jupyter®, JupyterLab®, and the Jupyter® logos are trademarks or registered trademarks of NumFOCUS.
All third-party trademarks including logos and icons referenced remain the property of their respective owners. No affiliation or endorsement is implied.
Advance your Foundry and AIP skills with new training courses on learn.palantir.com
Date published: 2025-11-20
Three new training courses are now available on learn.palantir.com ↗ to help you improve your skills in Foundry and AIP. These courses, focusing on building workflows and scoping use cases in Foundry with our AIP applications and features, are designed to help you feel more familiar with real-world solutions and industry-specific processes.
Foundry & AIP Aware course
The new Foundry & AIP Aware course ↗ ties together various courses on the Learn site to create an immersive and hands-on experience for users interested in the following:
- Building on Foundry & AIP
- Scoping use cases
- Positioning Foundry and AIP within an enterprise IT landscape
Expect to start with theory and the basics, and progress to building functional, real-world solutions by the end of each module. Upon completing this program, all participants will be eligible to sit for the (free) Foundry Aware certification exam ↗. Successfully passing this exam marks an important step before gaining further real-world experience or pursuing an apprenticeship.
This comprehensive course is intended to take approximately eight hours and is accessible to both technical and non-technical users.
Speedrun courses
The following two new speedrun courses are also available:
-
Speedrun: Your First Agentic AIP Workflow ↗: Learn how to leverage AIP and the Ontology for an agentic workflow and AIP-human teaming.
- In this course, you will work with clinic trial recruitment data and solve the problem of identifying eligible patients for clinical trials. Your goal is to learn how to leverage Foundry's AI and operational tooling to streamline the trial recruitment process.
- By the end of this course you will have a functional application for operational users that leverages an automated AIP agent performing part of the clinical trial recruitment process, ultimately achieving AI and human teaming on this process.
- This course is part of the AI Engineer track ↗.
-
Speedrun: Data Science Fundamentals ↗: Learn how to use Foundry and AIP for Data Science.
- In this course, you will delve into analyzing clinical study data to uncover insights into patient demographics and adverse events linked to drug consumption. This project not only involves performing data analysis but also creating a report that your colleagues can use for future data science initiatives.
- This course is part of the Data Scientist track ↗.
Introducing the AI forward deployed engineer
Date published: 2025-11-18
AI FDE - the AI forward deployed engineer - will be available in beta starting the week of November 17 for enrollments with AIP enabled. AI FDE allows you to operate Foundry with natural language, using conversations to unlock the power of the Palantir platform. AI FDE makes platform interactions more intuitive and accessible for all users, regardless of technical expertise, while maintaining complete control and visibility into tool use and data access.
The AI FDE prompt input field, with the option to add ontology resources as context.
Key features
With AI FDE, you can perform data transformations, manage code repositories, build and maintain your ontology, and more. AI FDE can accelerate your efforts with the following features:
- Context management that allows you to control what information the model can access.
- Closed-loop operation that enables complex multi-step workflows through continuous feedback.
- Full respect for existing user permissions, ensuring proper governance and security.
- Transparent tool usage with complete visibility into all actions performed.
- First-class support for Anthropic, OpenAI, Google Gemini, and xAI models with native tool APIs.
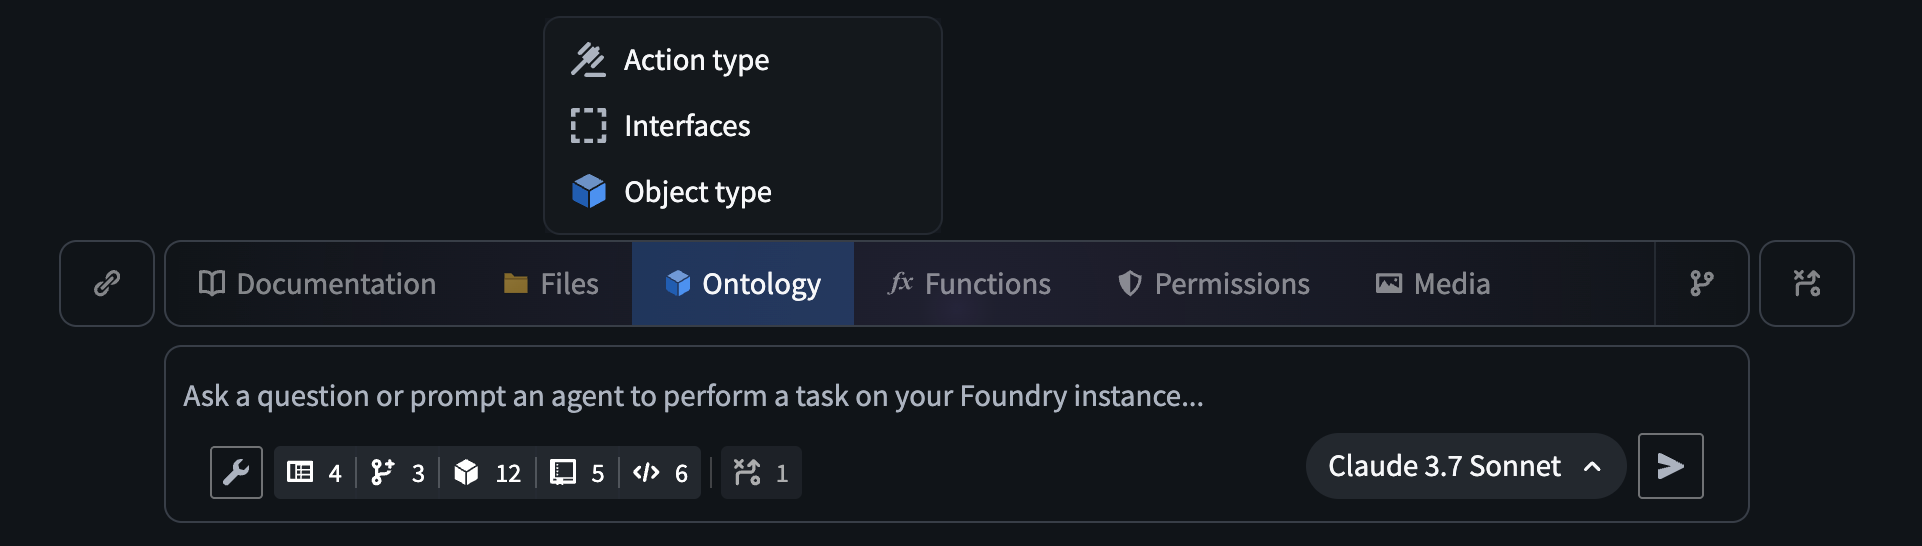
Getting started
To get started with AI FDE, ensure that AIP is enabled on your enrollment. For the best experience, Foundry Branching should also be enabled to support ontology edits. Once enabled, you can begin interacting with AI FDE by providing natural language requests. You can expand the agent's context by sharing resources or documentation, and enable relevant tools depending on the given task.
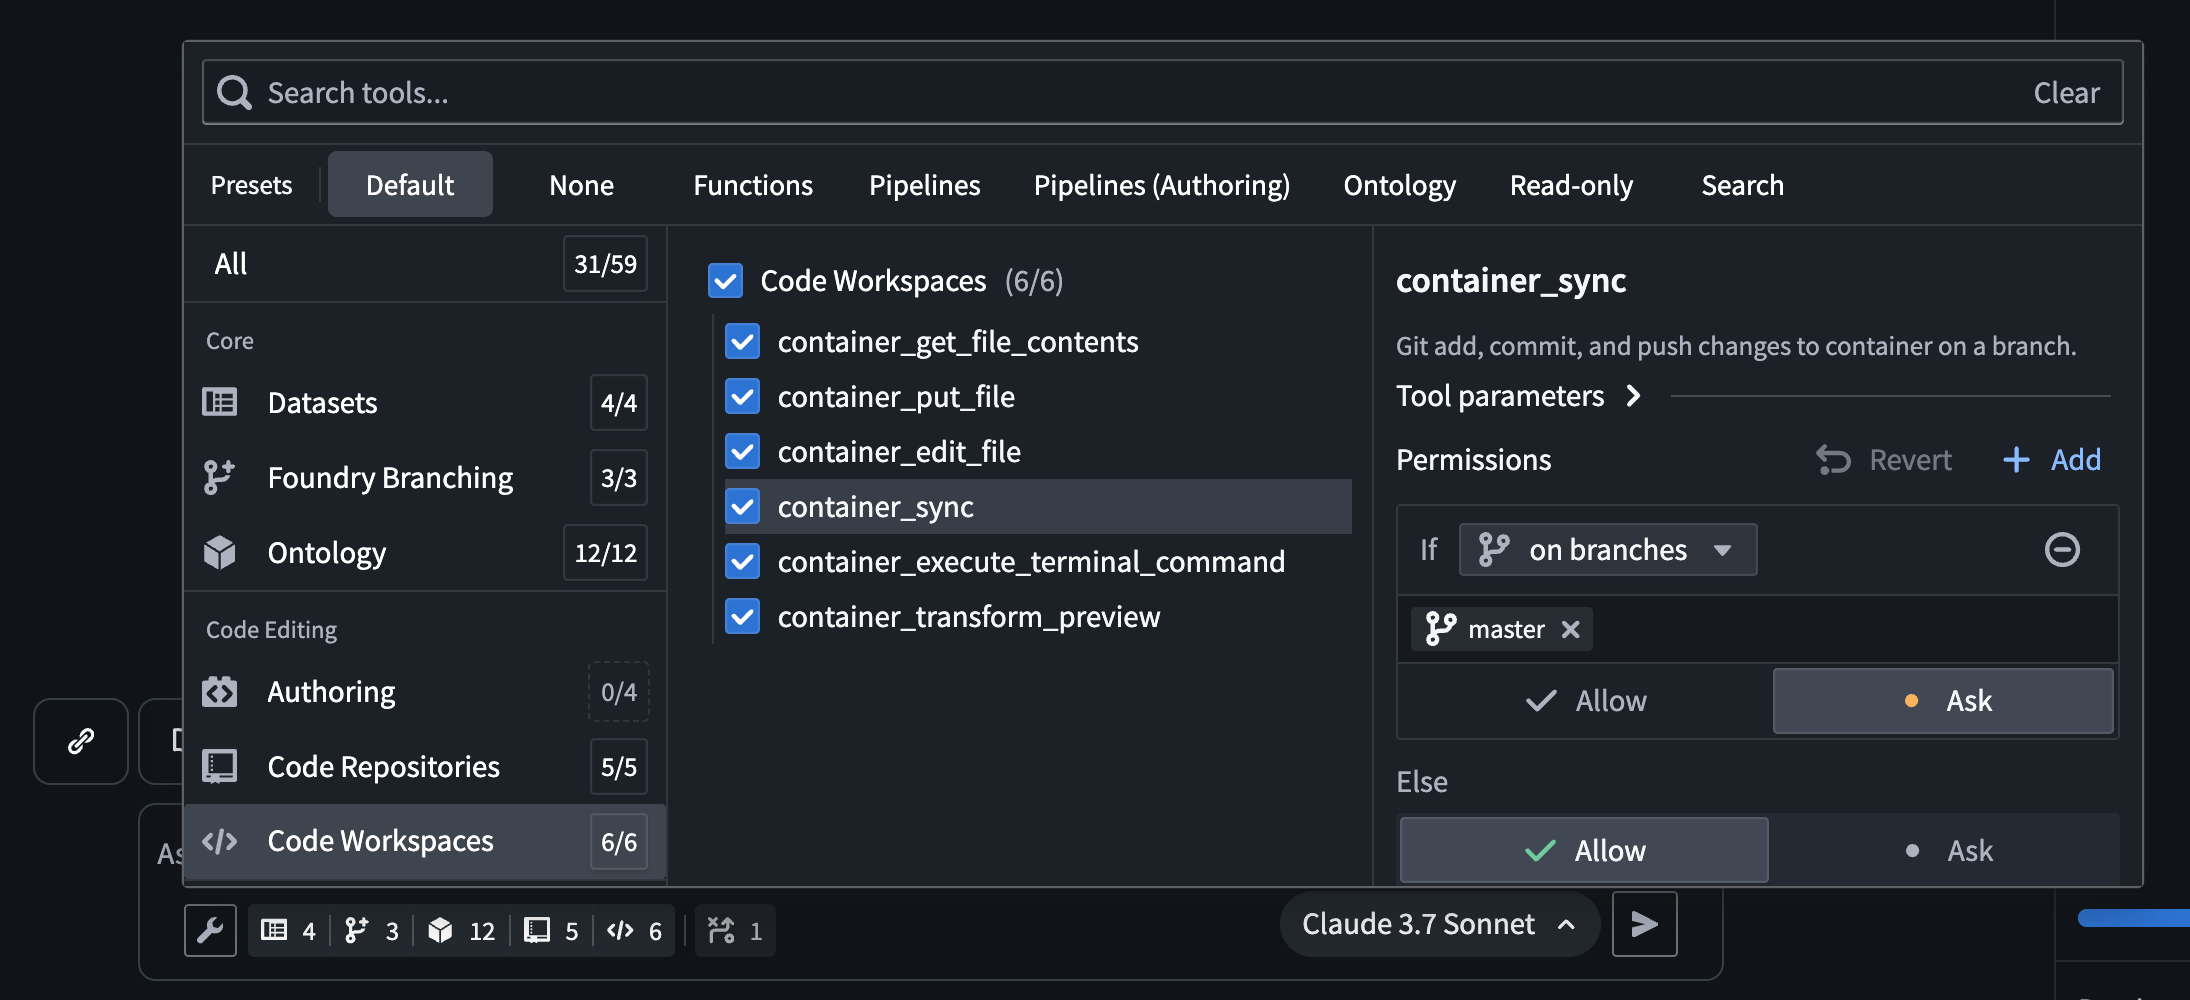
The AI FDE tool selection menu, which allows users to select the tools AI FDE has access to.
After configuring context and tools, you can use AI FDE to help you perform the following actions in Foundry:
- Write transforms and build datasets for data integration.
- Create and modify object types, link types, action types, and interfaces for ontology development.
- Write, preview, and publish functions.
- Leverage branching for safe, reviewable changes across all workflows.
By enabling natural language commands for data integration, ontology development, and function creation, AI FDE can transform how you work with Foundry while maintaining security and providing full visibility into every action.
We want to hear from you
As we continue to develop AI FDE, we want to hear about your experiences and welcome your feedback. Share your thoughts with Palantir Support channels or our Developer Community ↗.
Note: AIP feature availability is subject to change and may differ between customers.
AIP Analyst: Intuitive chat-based ontology exploration
Date published: 2025-11-18
AIP Analyst is a new data analysis application launching in beta the week of November 17 for users with AIP enabled. AIP Analyst uses the data in your ontology to answer questions in a chat-based interface, offering an ontology-first experience that enables both technical and non-technical users to traverse and generate insights from their ontology data. With AIP Analyst, you can ask questions, visualize results, and understand every step of your analysis with complete transparency.
AIP Analyst has access to a growing list of tools, including:
- Searching and understanding your ontology.
- Filtering object sets with search-arounds and semantic search.
- Performing aggregations with group-by and metrics.
- Writing SQL queries against object sets or datasets.
- Creating visualizations with Vega charts.
AIP Analyst emphasizes transparency and control; you can review each step of an analysis, validate logic, make manual adjustments when needed, and view the analysis lineage in an interactive graph view.
Intelligent Analysis with full transparency
AIP Analyst shows its work. Every analysis creates an interactive dependency graph showing the flow from question to answer. Users can see exactly how the agent reasoned through their request, inspect intermediate results, and manually adjust steps.
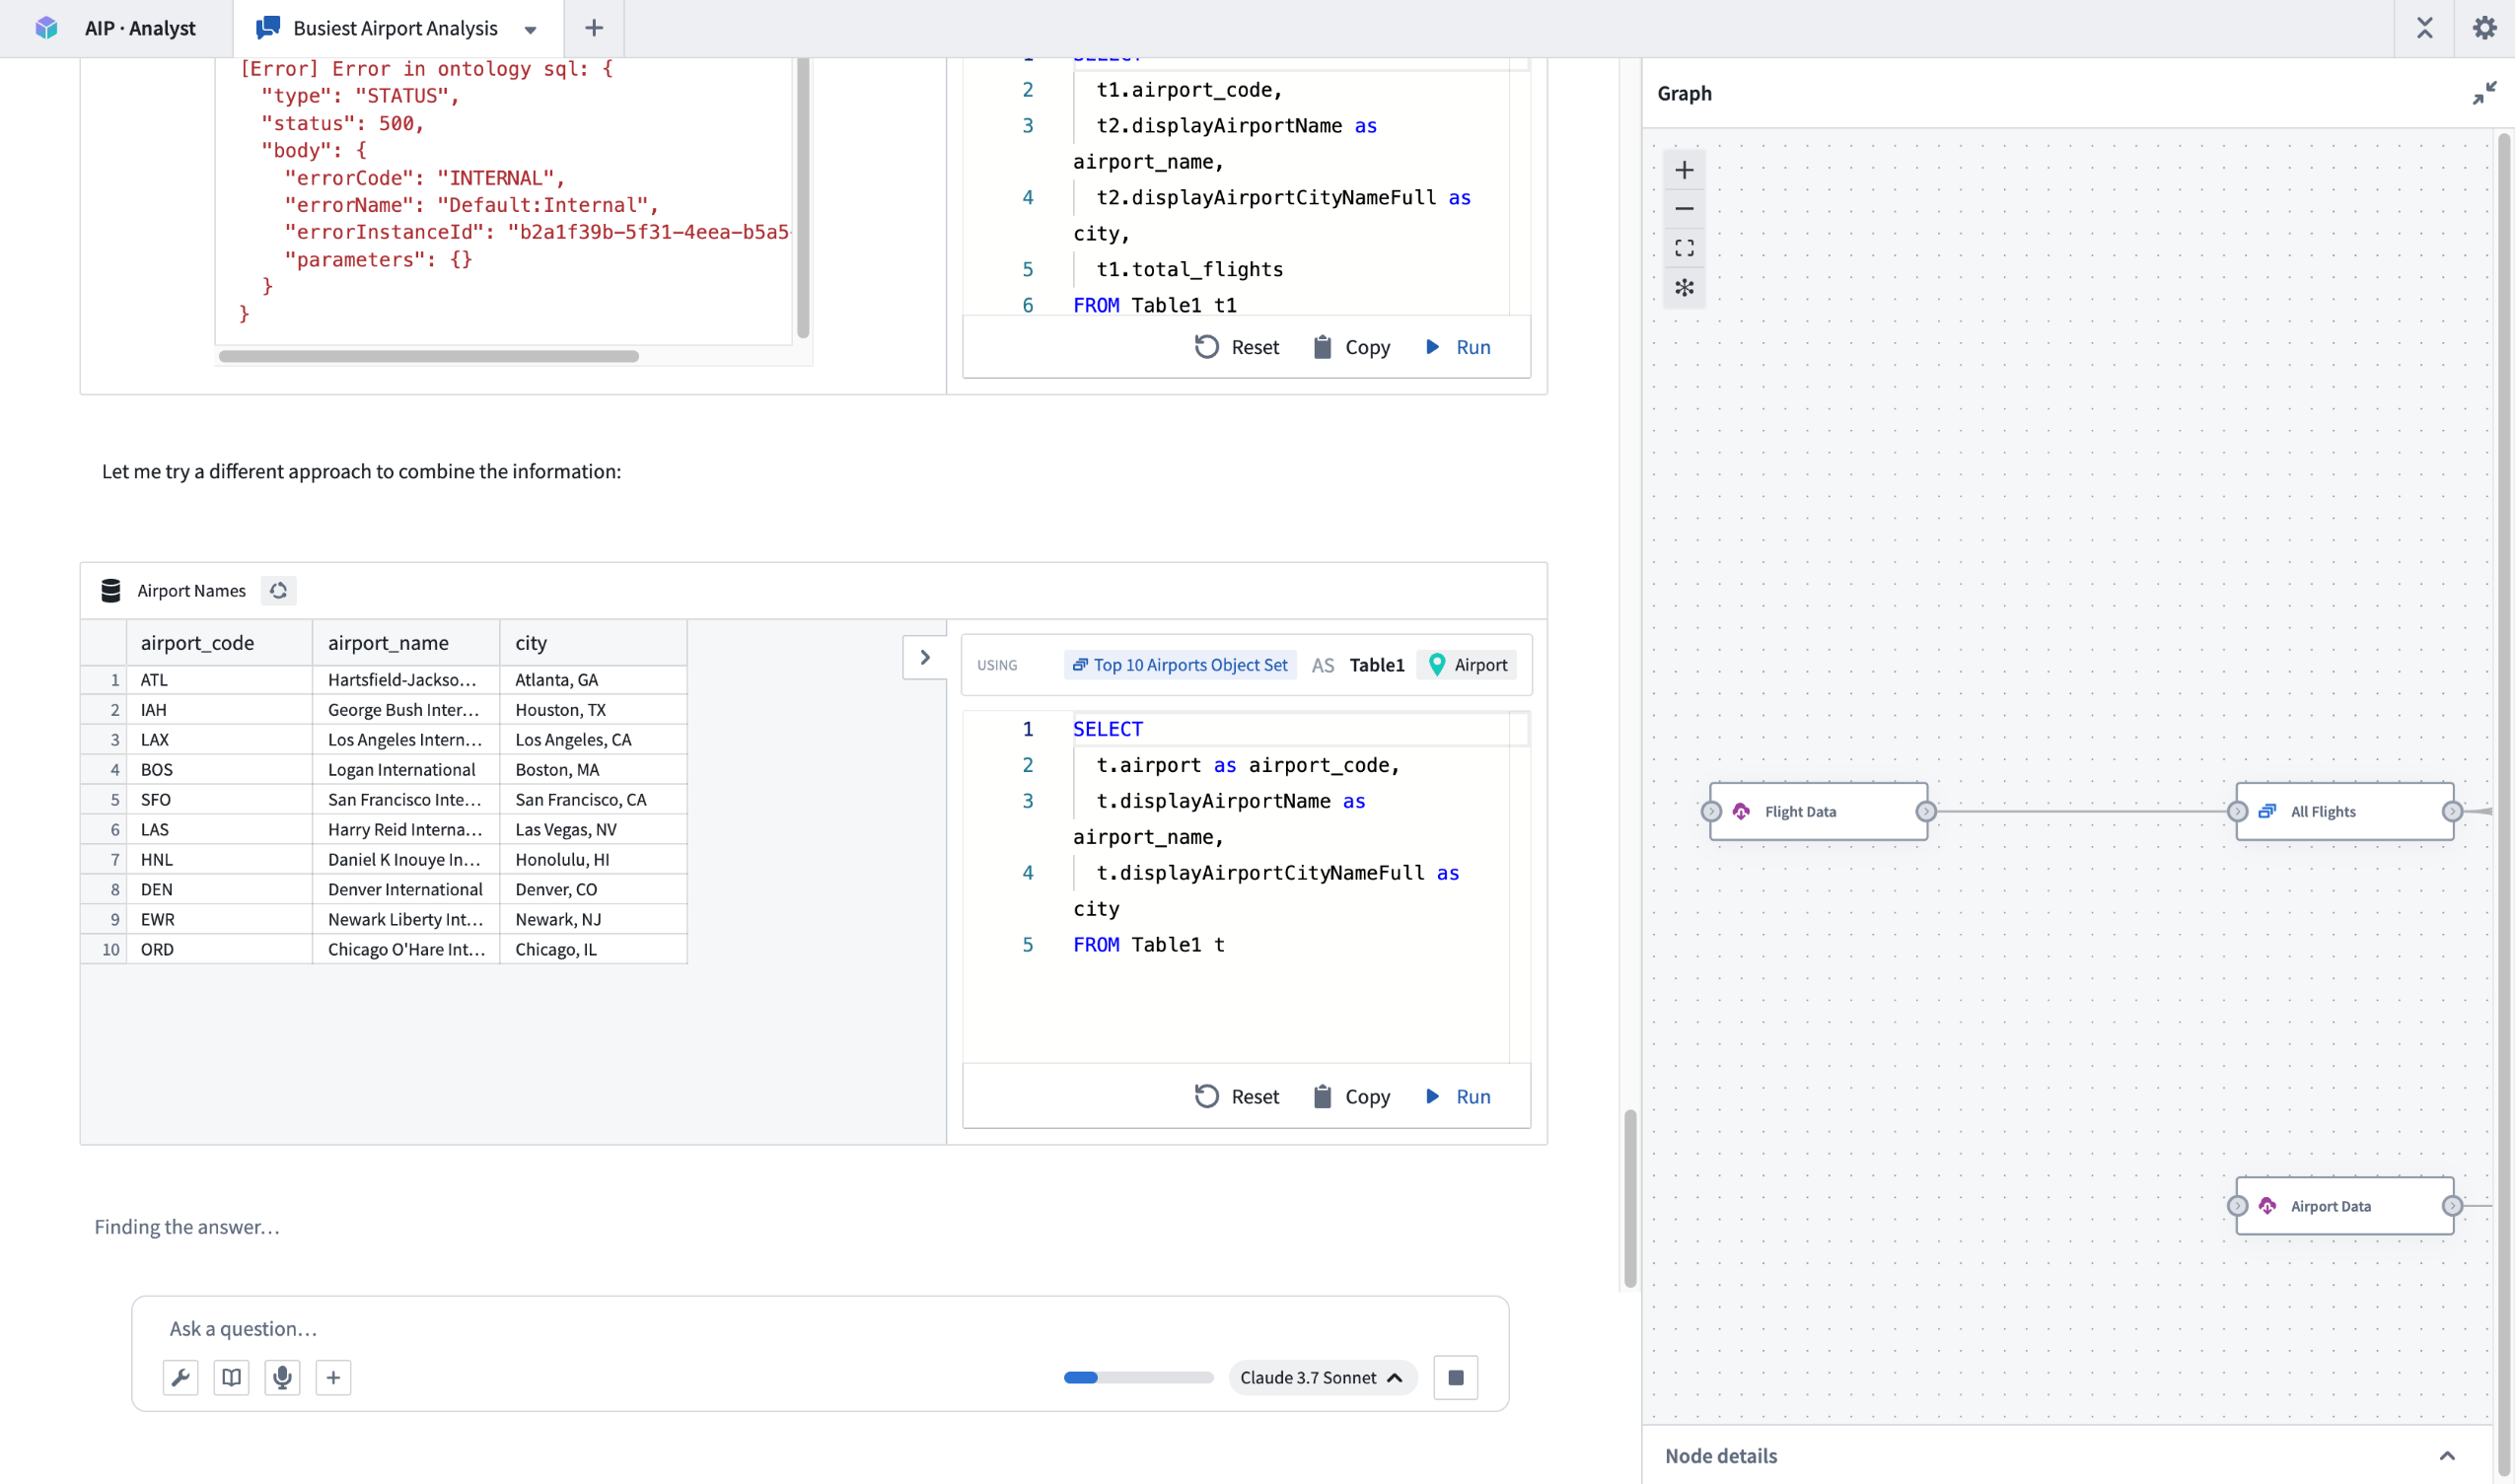
AIP Analyst in the process of answering a question, with the graph tab expanded.
Flexible exploration
With the ability to fork a chat, users can branch explorations from a common starting point. AIP Analyst can either access every object type that the user has access to, or it can be locked down to specific ontologies and object type groups for more targeted exploration.
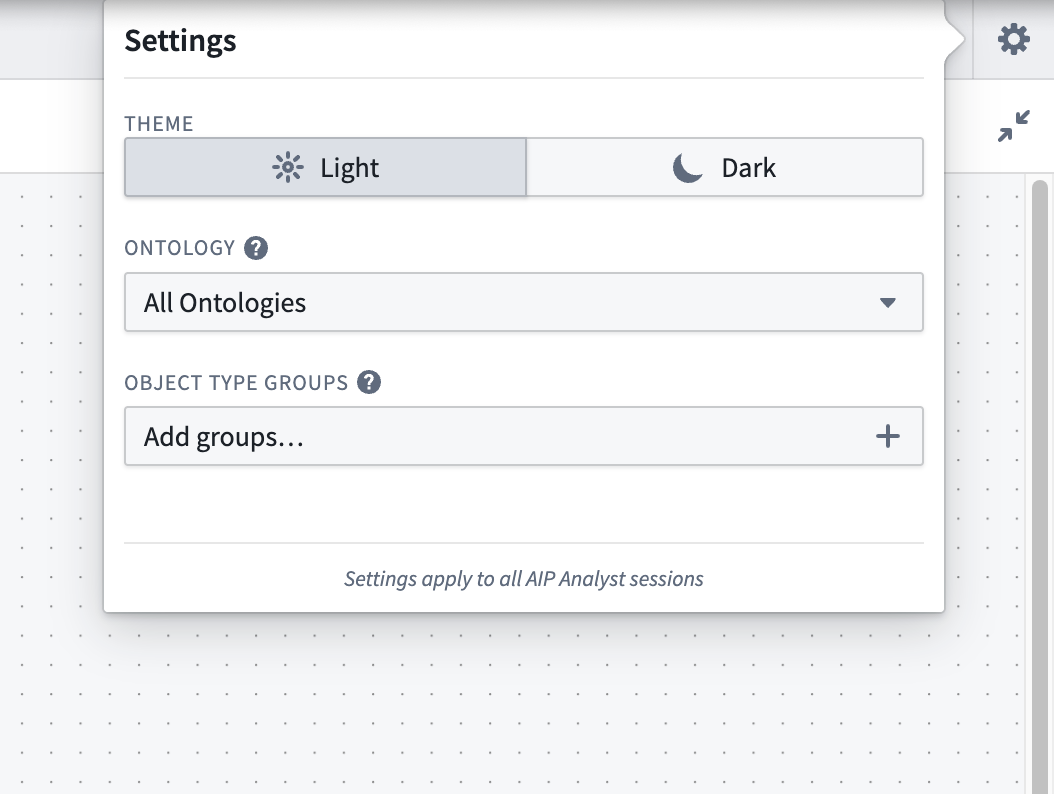
The AIP Analyst Settings menu, with ontology and object type group options.
High level of user control
Beyond text chat, AIP Analyst supports the following features:
- Manual mode (
Shift+tab) allows the user to guide the agent at every step of the analysis. - Notepad integration allows users to provide commonly used instructions and context as Notepad documents.
- Direct imports from object types, object sets, datasets, functions, and workshop modules for targeted analysis.
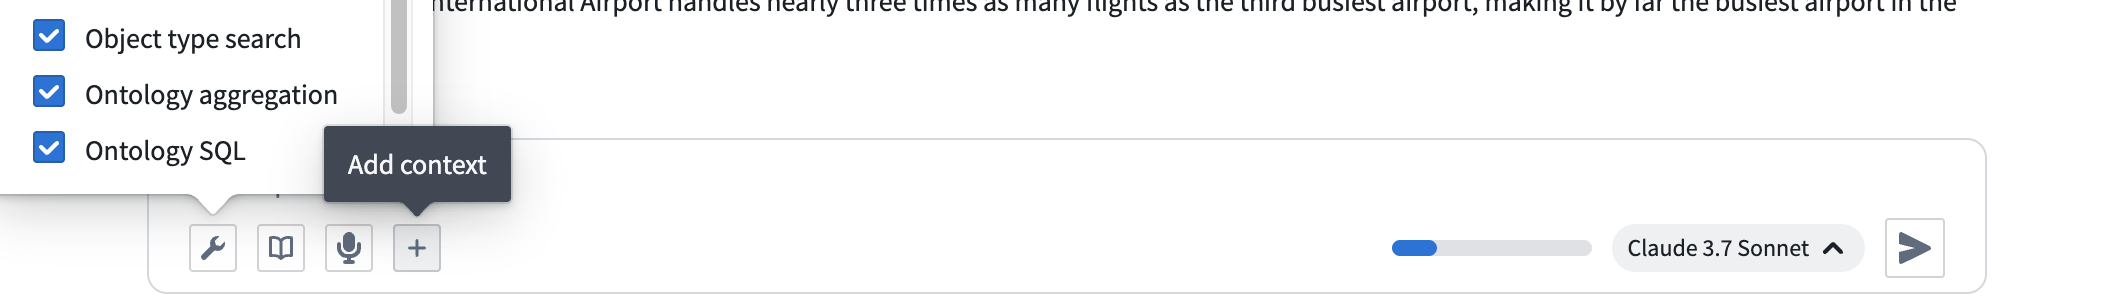
Options in the AIP Analyst input field.
AIP Analyst redefines ontology exploration by combining the power of conversational AI with robust user controls and transparent workflows. With its growing suite of tools and commitment to transparency, AIP Analyst is an essential tool for anyone seeking deeper insights from their ontology data.
Your feedback matters
We want to hear about your experience with AIP Analyst and welcome your feedback. Share your thoughts with Palantir Support channels or our Developer Community ↗.
Note: AIP feature availability is subject to change and may differ between customers.
Automatically diagnose failures and improve prompts with the AIP Evals results analyzer
Date published: 2025-11-18
AIP Evals now has a results analyzer that enables you to quickly understand why tests failed and how to fix them. Previously, when iterating on an AI function, moving from failing test cases in the results table to clear, actionable next steps was a lengthy manual process. The results analyzer addresses this by automatically clustering failures into root-cause categories and proposing targeted prompt changes where they help.
What is the analyzer?
The AIP Evals results analyzer is a built‑in AI copilot on the Results view that:
- Analyzes a single run’s failing test cases and produces an aggregate summary in the style of a root cause analysis (RCA).
- Categorizes and groups failures with names, descriptions, representative examples, and the full list of affected test cases.
- Suggests specific prompt edits when changes are likely to improve outcomes.
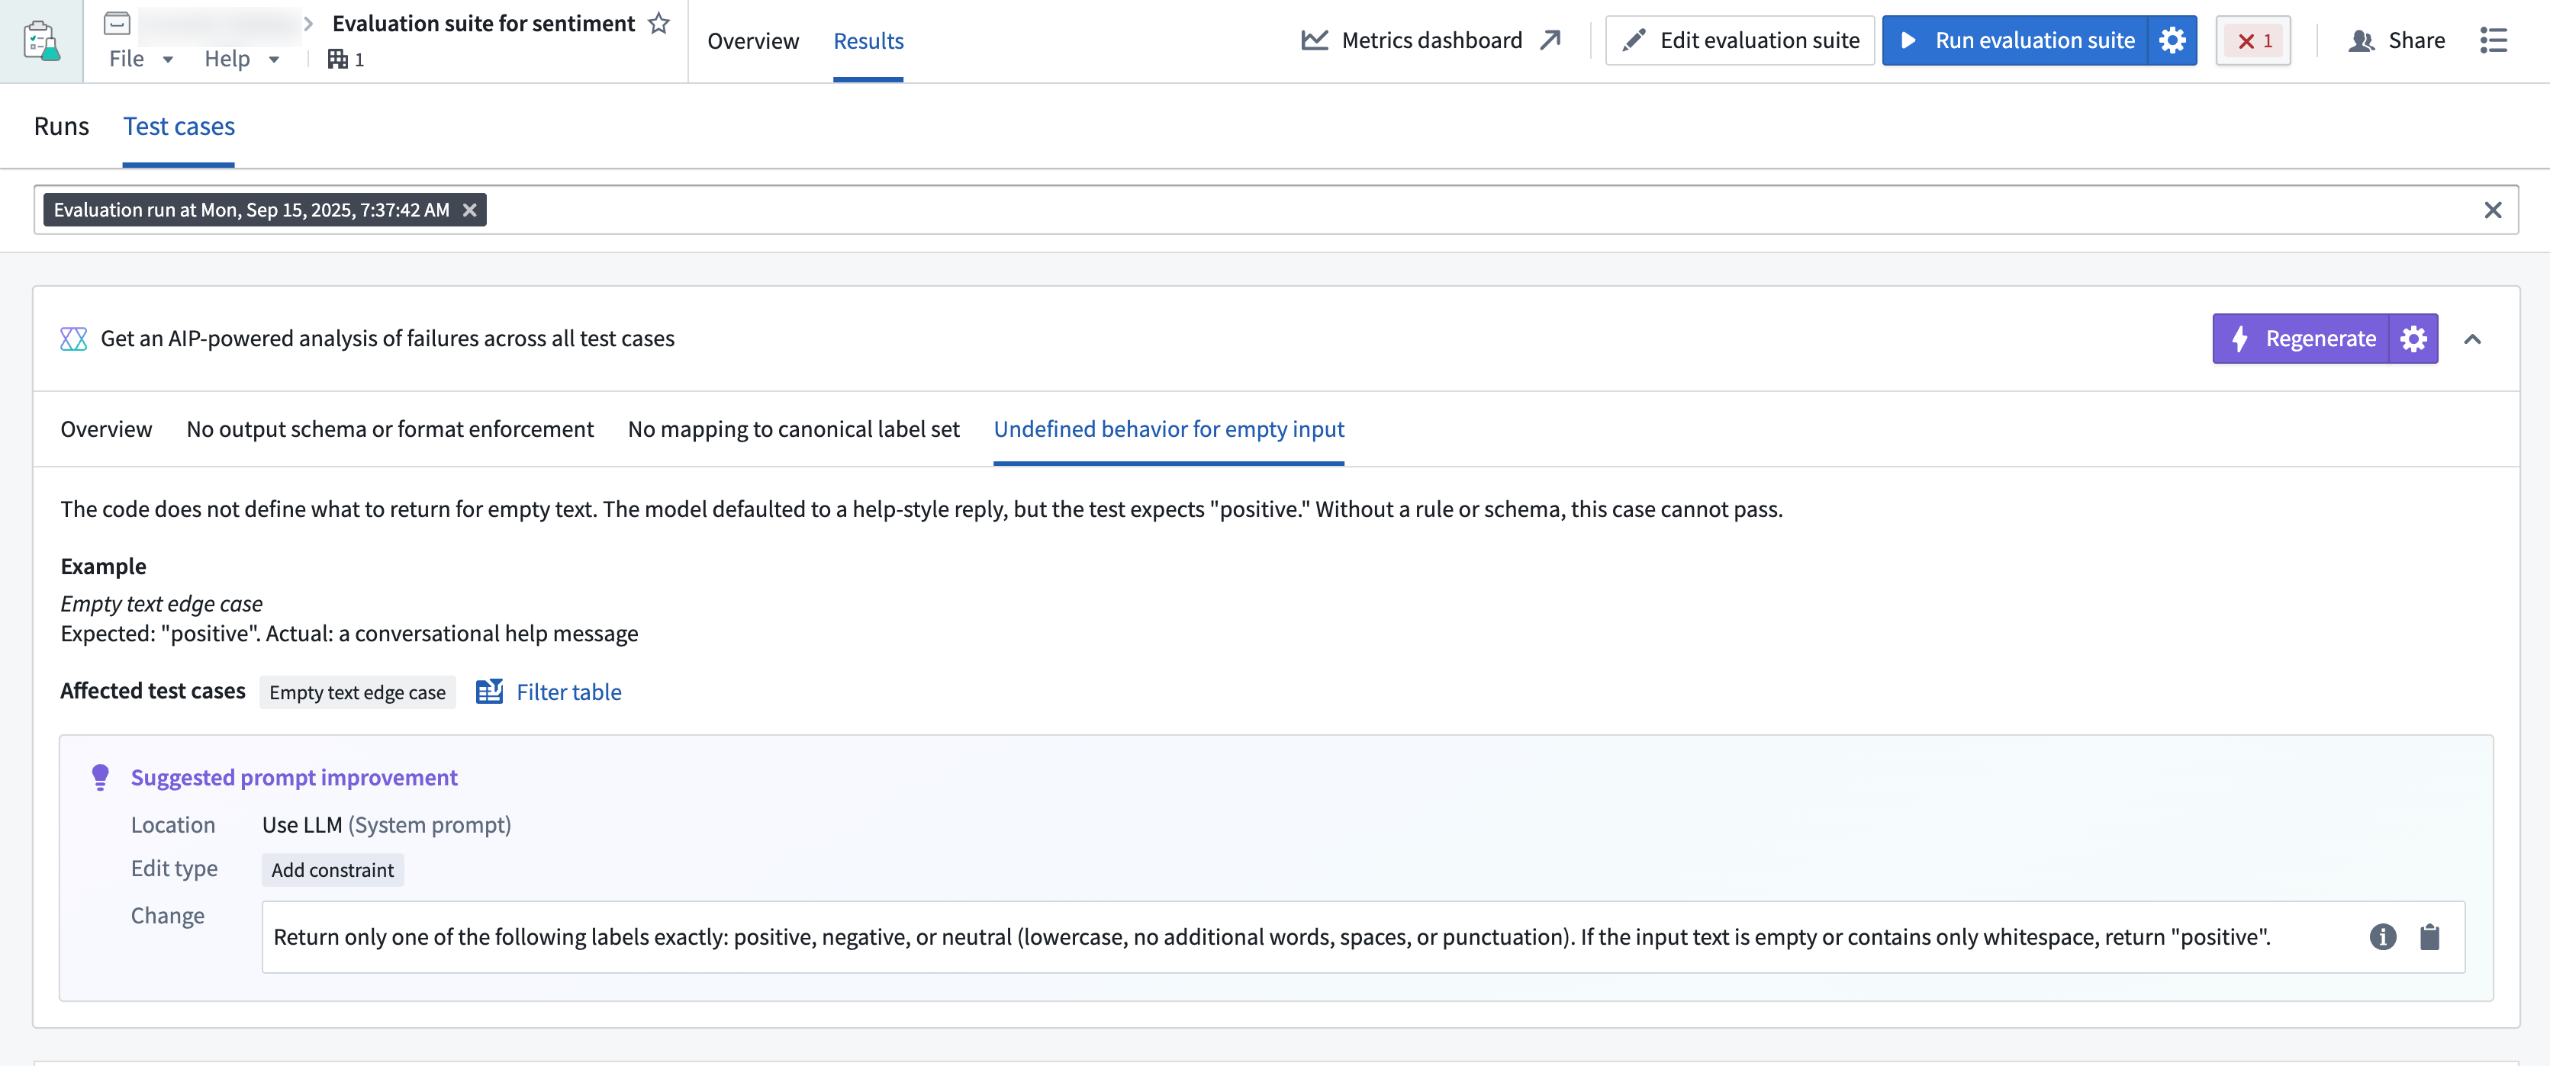
A view of the results analyzer in the AIP Evals application.
Leverage the results analyzer
The results analyzer has been used to discover significant AI failure modes and optimization opportunities, and can be used with AIP Logic functions. Support for agents published as functions and functions on objects will be included in a future release.
Some example use cases include the following:
- Faster diagnosis: Jump from raw failures to concise, structured root‑cause categories and a top‑line summary.
- Actionable improvements: For each category, get a single, concrete prompt modification and copy changes with one click.
- Context aware: The results analyzer includes your function definition, evaluator setup, and a lightweight debug trace of prompts and responses to ground its reasoning.
- Built for Evals workflows: Select any category’s test case tags to filter the table to exactly the affected cases and go deeper.
Getting started
To start using the AIP Evals results analyzer, refer to the documentation to view prerequisite setup steps. After setup, you can select a single evaluation suite run with failing test cases from either the AIP Logic sidebar or the AIP Evals application, then generate an analysis. From there, you can:
- Review the Overview and per‑category tabs. You can filter the table to find impacted cases.
- Review suggested prompt improvements. Copy changes and update your Logic prompts where appropriate.
- Rerun your evaluation or an Experiment to validate improvements.
Your feedback matters
As we continue to develop new AIP Evals features and improvements, we want to hear about your experiences and welcome your feedback. Share your thoughts with Palantir Support channels or our Developer Community ↗ using the aip-evals tag ↗.
GPT-4.1 now available on Azure OpenAI-enabled IL2, IL4, and IL5 enrollments
Date published: 2025-11-18
GPT-4.1 is now available from Azure OpenAI for IL2, IL4, IL5 enrollments.
Model overview
GPT-4.1 is an improvement over GPT-4o and alternative to Claude 3.7 Sonnet for certain use cases, and shows excellent performance in coding, instruction following, and long context conversations. Comparisons between GPT-4.1 and other models in the OpenAI family can be found in the OpenAI documentation ↗.
- Tool calling
- Structured outputs
- 1M token context window
- Knowledge cutoff of June 2024
Getting started
To use these models:
- Confirm your enrollment administrator has enabled relevant model family or families
- Review token costs and pricing
- See the complete list of all the models available in AIP
Your feedback matters
We want to hear about your experiences using language models in the Palantir platform and welcome your feedback. Share your thoughts with Palantir Support channels or on our Developer Community ↗ using the language-model-service tag ↗.
Network egress logs and metrics now available in Build logs and Control Panel
Date published: 2025-11-18
The Palantir platform now provides networking logs and new metrics to help you debug networking issues that were previously difficult to resolve. This feature is currently available in beta for enrollments running on Rubix, Palantir's Kubernetes-based infrastructure.
What's new in Build logs?
Build logs now encompasses network egress logs. Access network egress logs from a Build page by selecting Logs and then applying the suggested Network egress logs filter. To understand what these logs contain and how to interpret them, you can review the documentation.
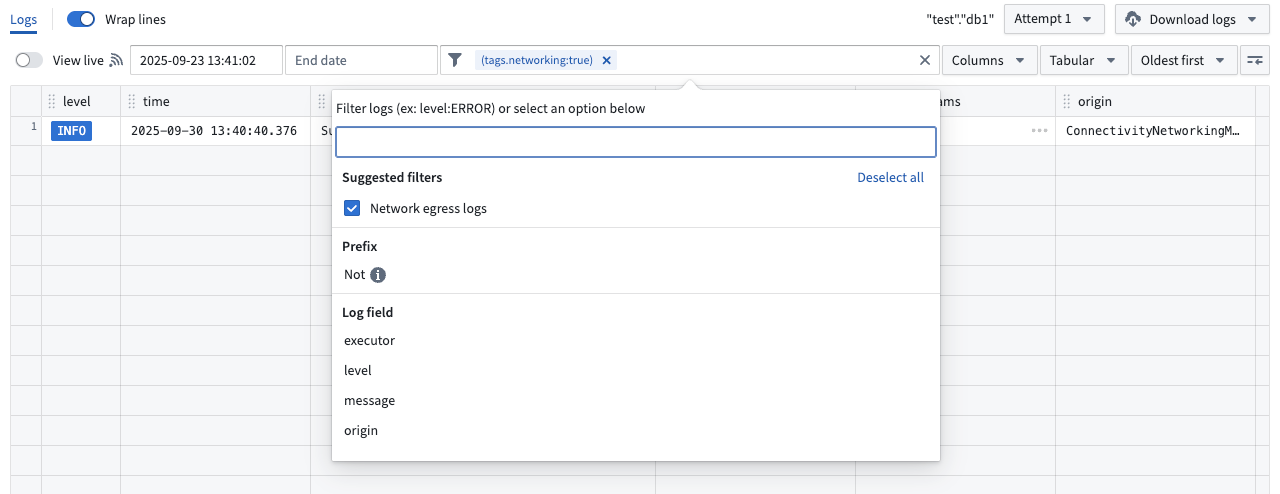
Select the Network egress logs filter to review logs.
Network egress policies in Control Panel now aggregate those same logs per source, as well as the metrics of the usage of these policies. Start from Control Panel > Network egress, then select a policy and go to the Observability tab to access.
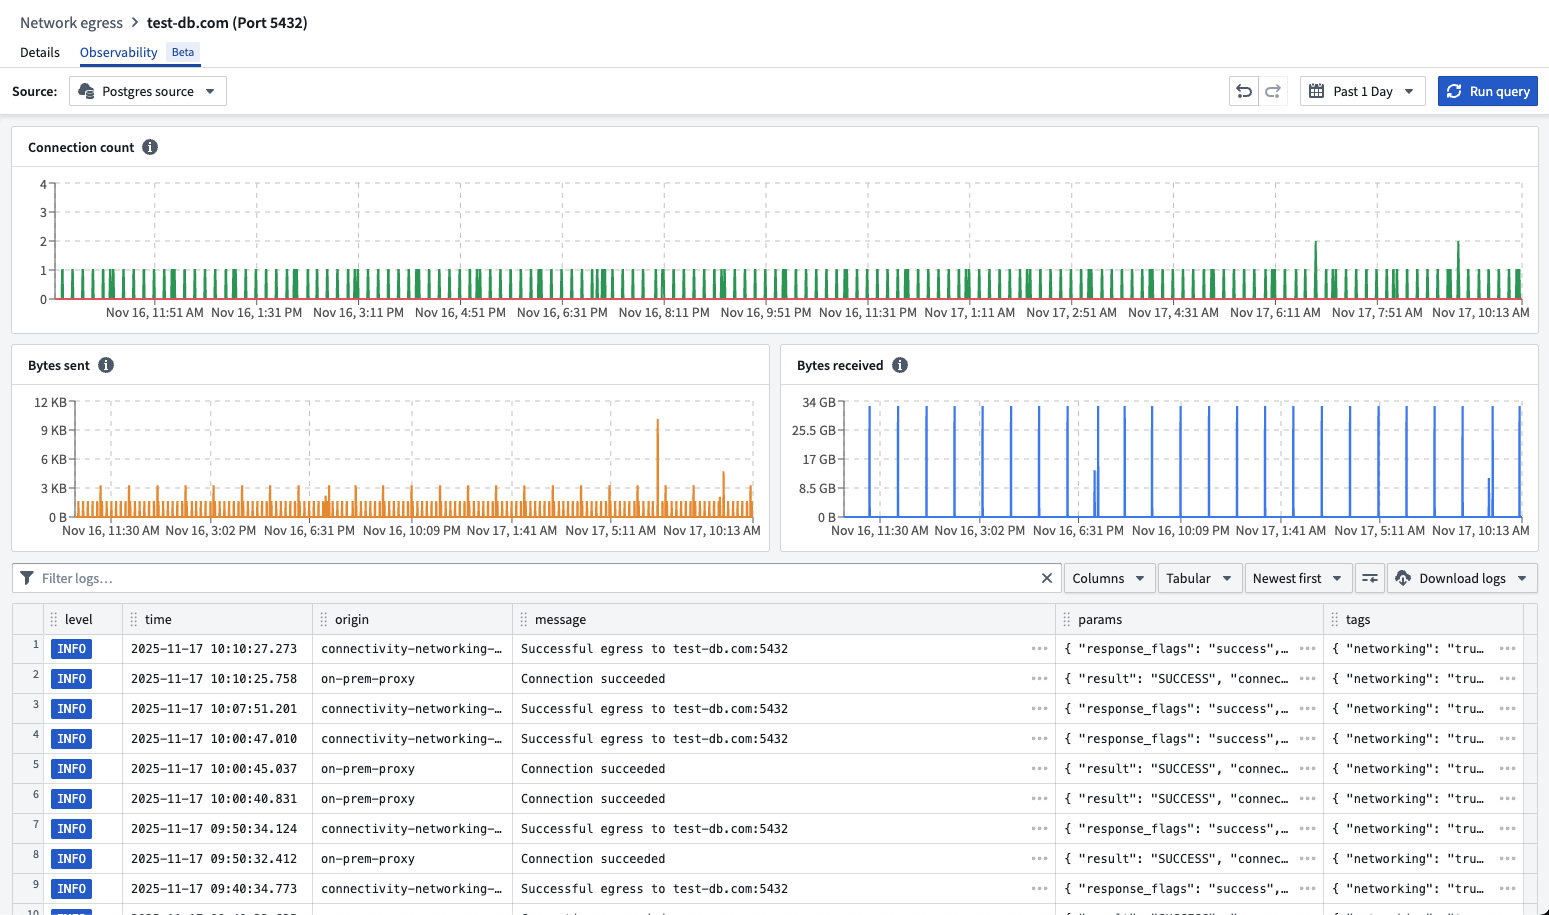
You can review egress logs and metrics for a network policy in Control Panel.
What's coming up next?
- Making DNS lookups discoverable to help identify required egress policies on a source
- Providing end-to-end observability of egress flows by logging all egress results from every intermediary step (Foundry proxies, agent proxies)
- Enabling monitoring to alert you when egress is failing
- Adding metrics like request and response sizes, request durations, and more
Your feedback matters
As we continue to add Data Connection features, we want to hear about your experiences and welcome your feedback. Share your thoughts with Palantir Support channels or our Developer Community ↗ or post using the our data-connection tag ↗.
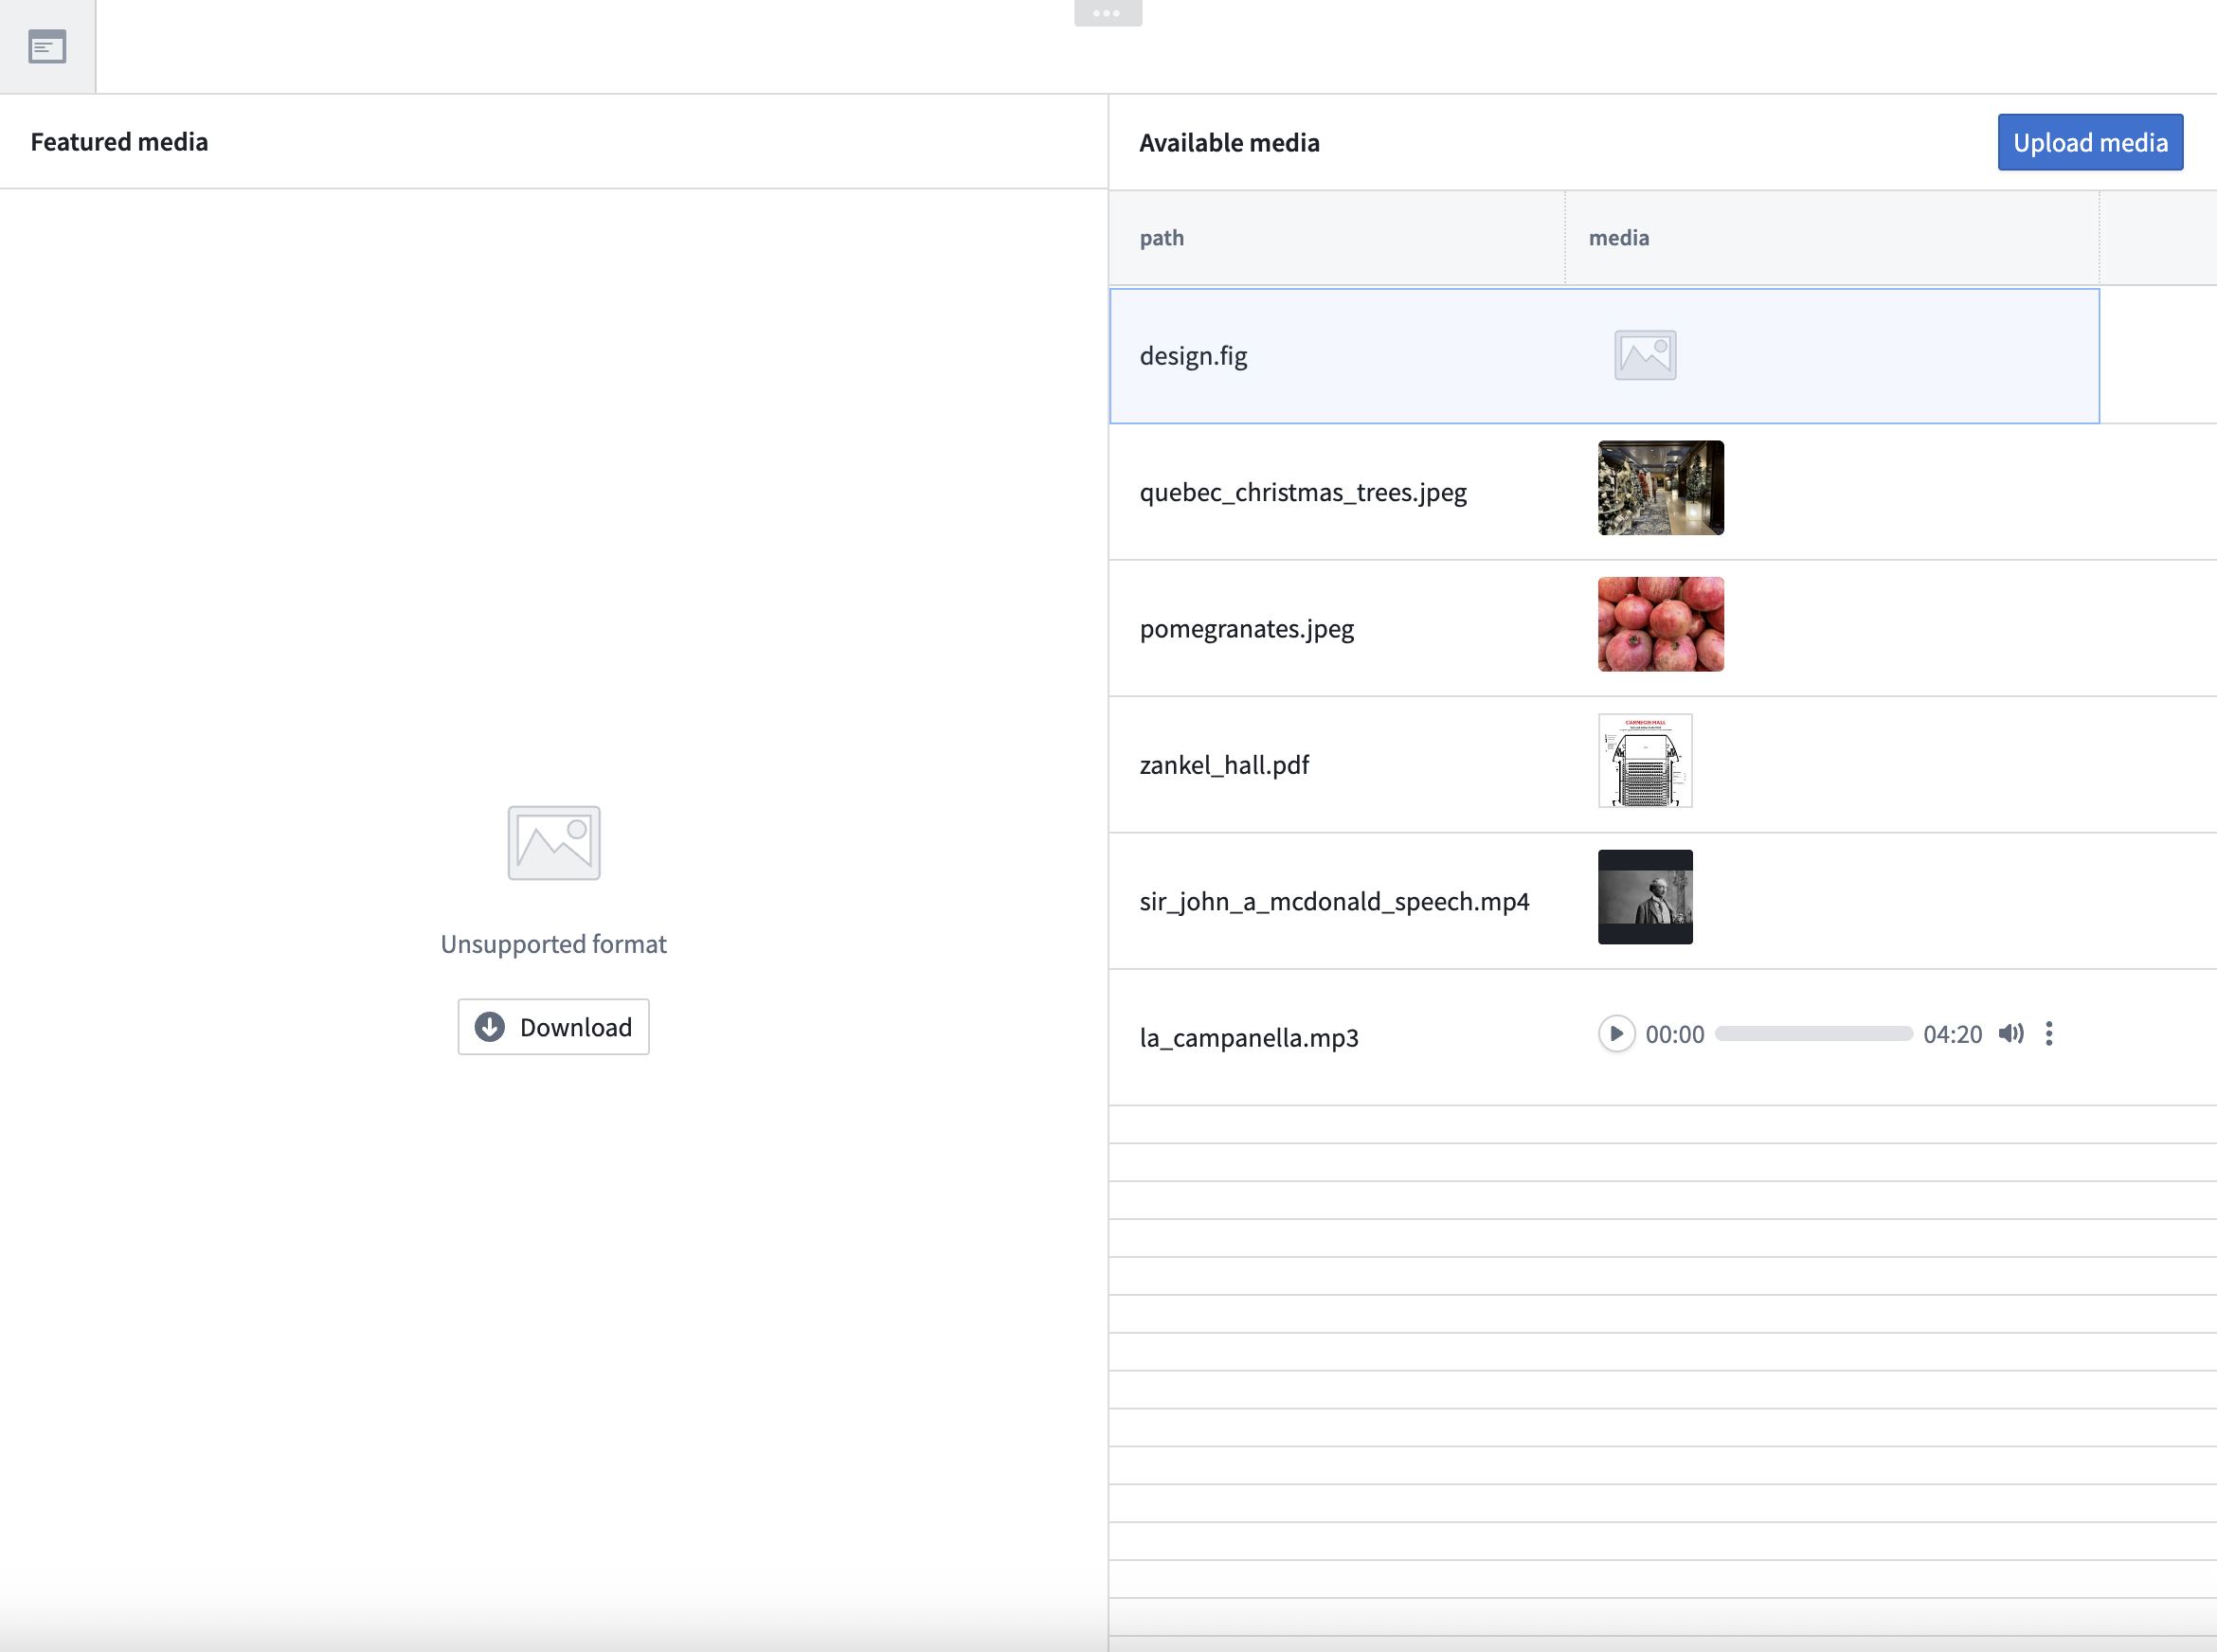
Upload multiple media types using multimodal media sets
Date published: 2025-11-18
Multimodal media sets are now available on all Foundry enrollments, allowing you to upload and store files of any format within a single media set. This capability simplifies workflows that require handling multiple media types together, such as processing mixed document types or combining different file formats in analysis pipelines.
What are multimodal media sets?
Multimodal media sets allow you to work with multiple types of unstructured data in a single media set. They are ideal for working with:
- Sets of files that span across multiple media set schema types
- File formats that are not otherwise supported by existing media set schemas
Key capabilities
- Upload and preview: Upload files to media sets and view interactive previews of media items using supported schema types. Media items that are not supported for preview will render a download option for off-platform previewing.

A preview of a media item not supported for preview.
- Workshop integration: Multimodal media sets are fully integrated with Workshop, allowing you to preview multimodal media directly in your workflow.
A preview of multimodal media in Workshop.
- Python transforms in Code Workspaces: Perform advanced transformations in Code Workspaces using the
transforms-mediapackage.
What's next on the development roadmap?
In upcoming releases, we plan to enhance multimodal media sets with further Pipeline Builder integrations.
Your feedback matters
We want to hear about your experience with multimodal media sets and welcome your feedback. Share your thoughts with Palantir Support channels, or on our Developer Community ↗ using the media-sets tag ↗.
DuckDB Python Bindings for Transforms
Date published: 2025-11-18
Transforms has added Foundry-native Python bindings for DuckDB ↗, a modern, high-performance single-node SQL execution engine.
This integration allows users to write highly performant SQL pipelines within the Python ecosystem, with features such as incremental processing and partitioned outputs. For many use cases, DuckDB can offer significant advantages over other single-node runtimes, including faster execution and improved memory efficiency. DuckDB’s familiar SQL interface makes it an excellent choice for Foundry users with existing SQL experience.
DuckDB is particularly well-suited for medium-to-large scale data processing tasks that require low latency and efficient resource usage. Unlike many other single-node compute engines, DuckDB supports resource configuration to control memory usage and parallelism, which allows fine-grained optimization for different workloads. This is especially important for memory-constrained contexts, where DuckDB can self-limit its memory consumption to avoid out-of-memory errors.
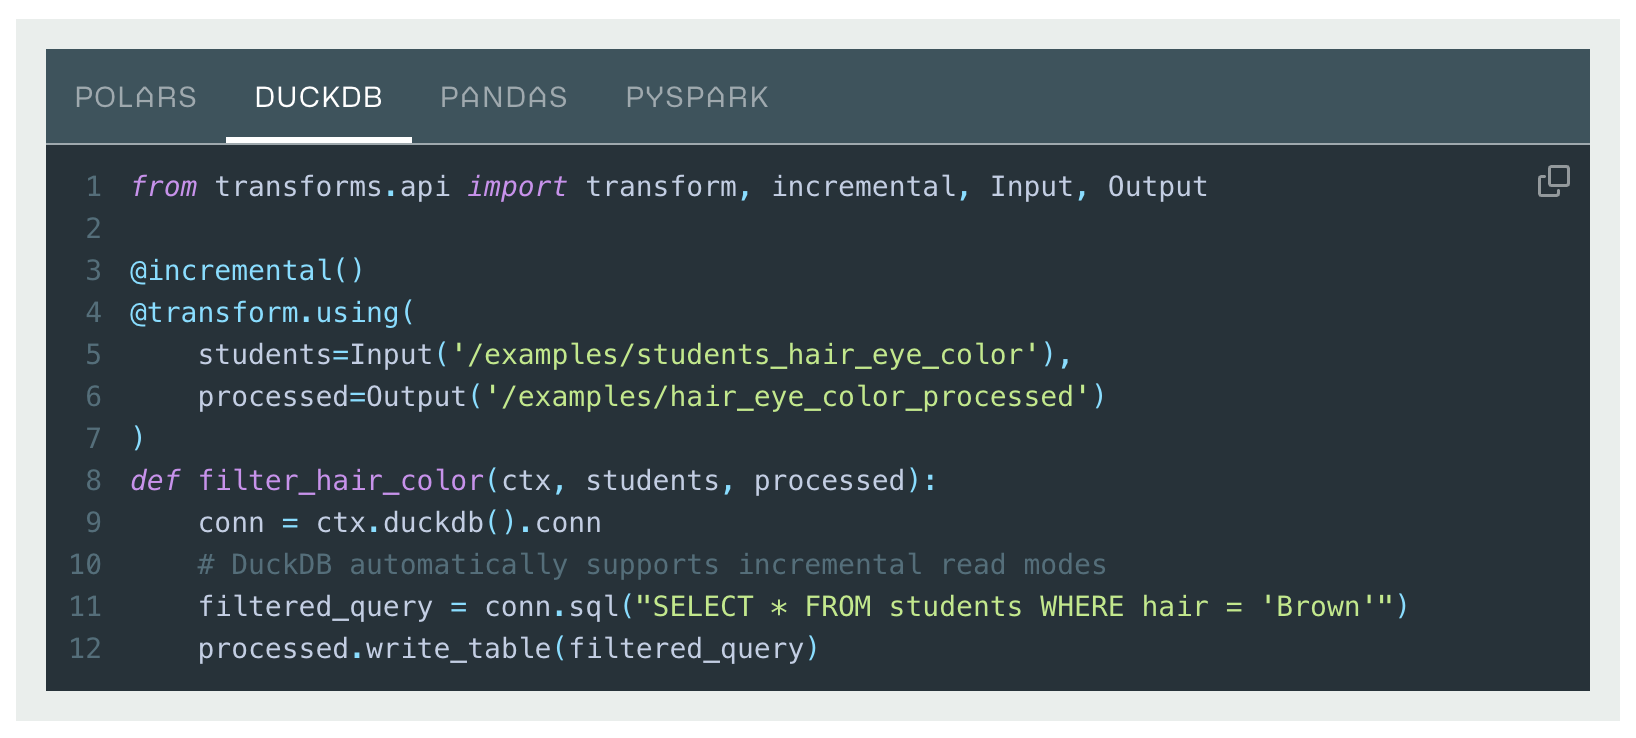
Transforms DuckDB code example.
To learn more, see the DuckDB API documentation and an overview of Foundry’s Python compute engine options.
Track and analyze Foundry logs in real time with streaming datasets
Date published: 2025-11-18
Organization administrators can now export Foundry logs directly into streaming datasets, allowing you to track application logs, function execution logs, and more all in one place as they occur. Once your logs are flowing into a dataset, you can then analyze them using Foundry's transformation tools and build custom dashboards to derive real-time insights.
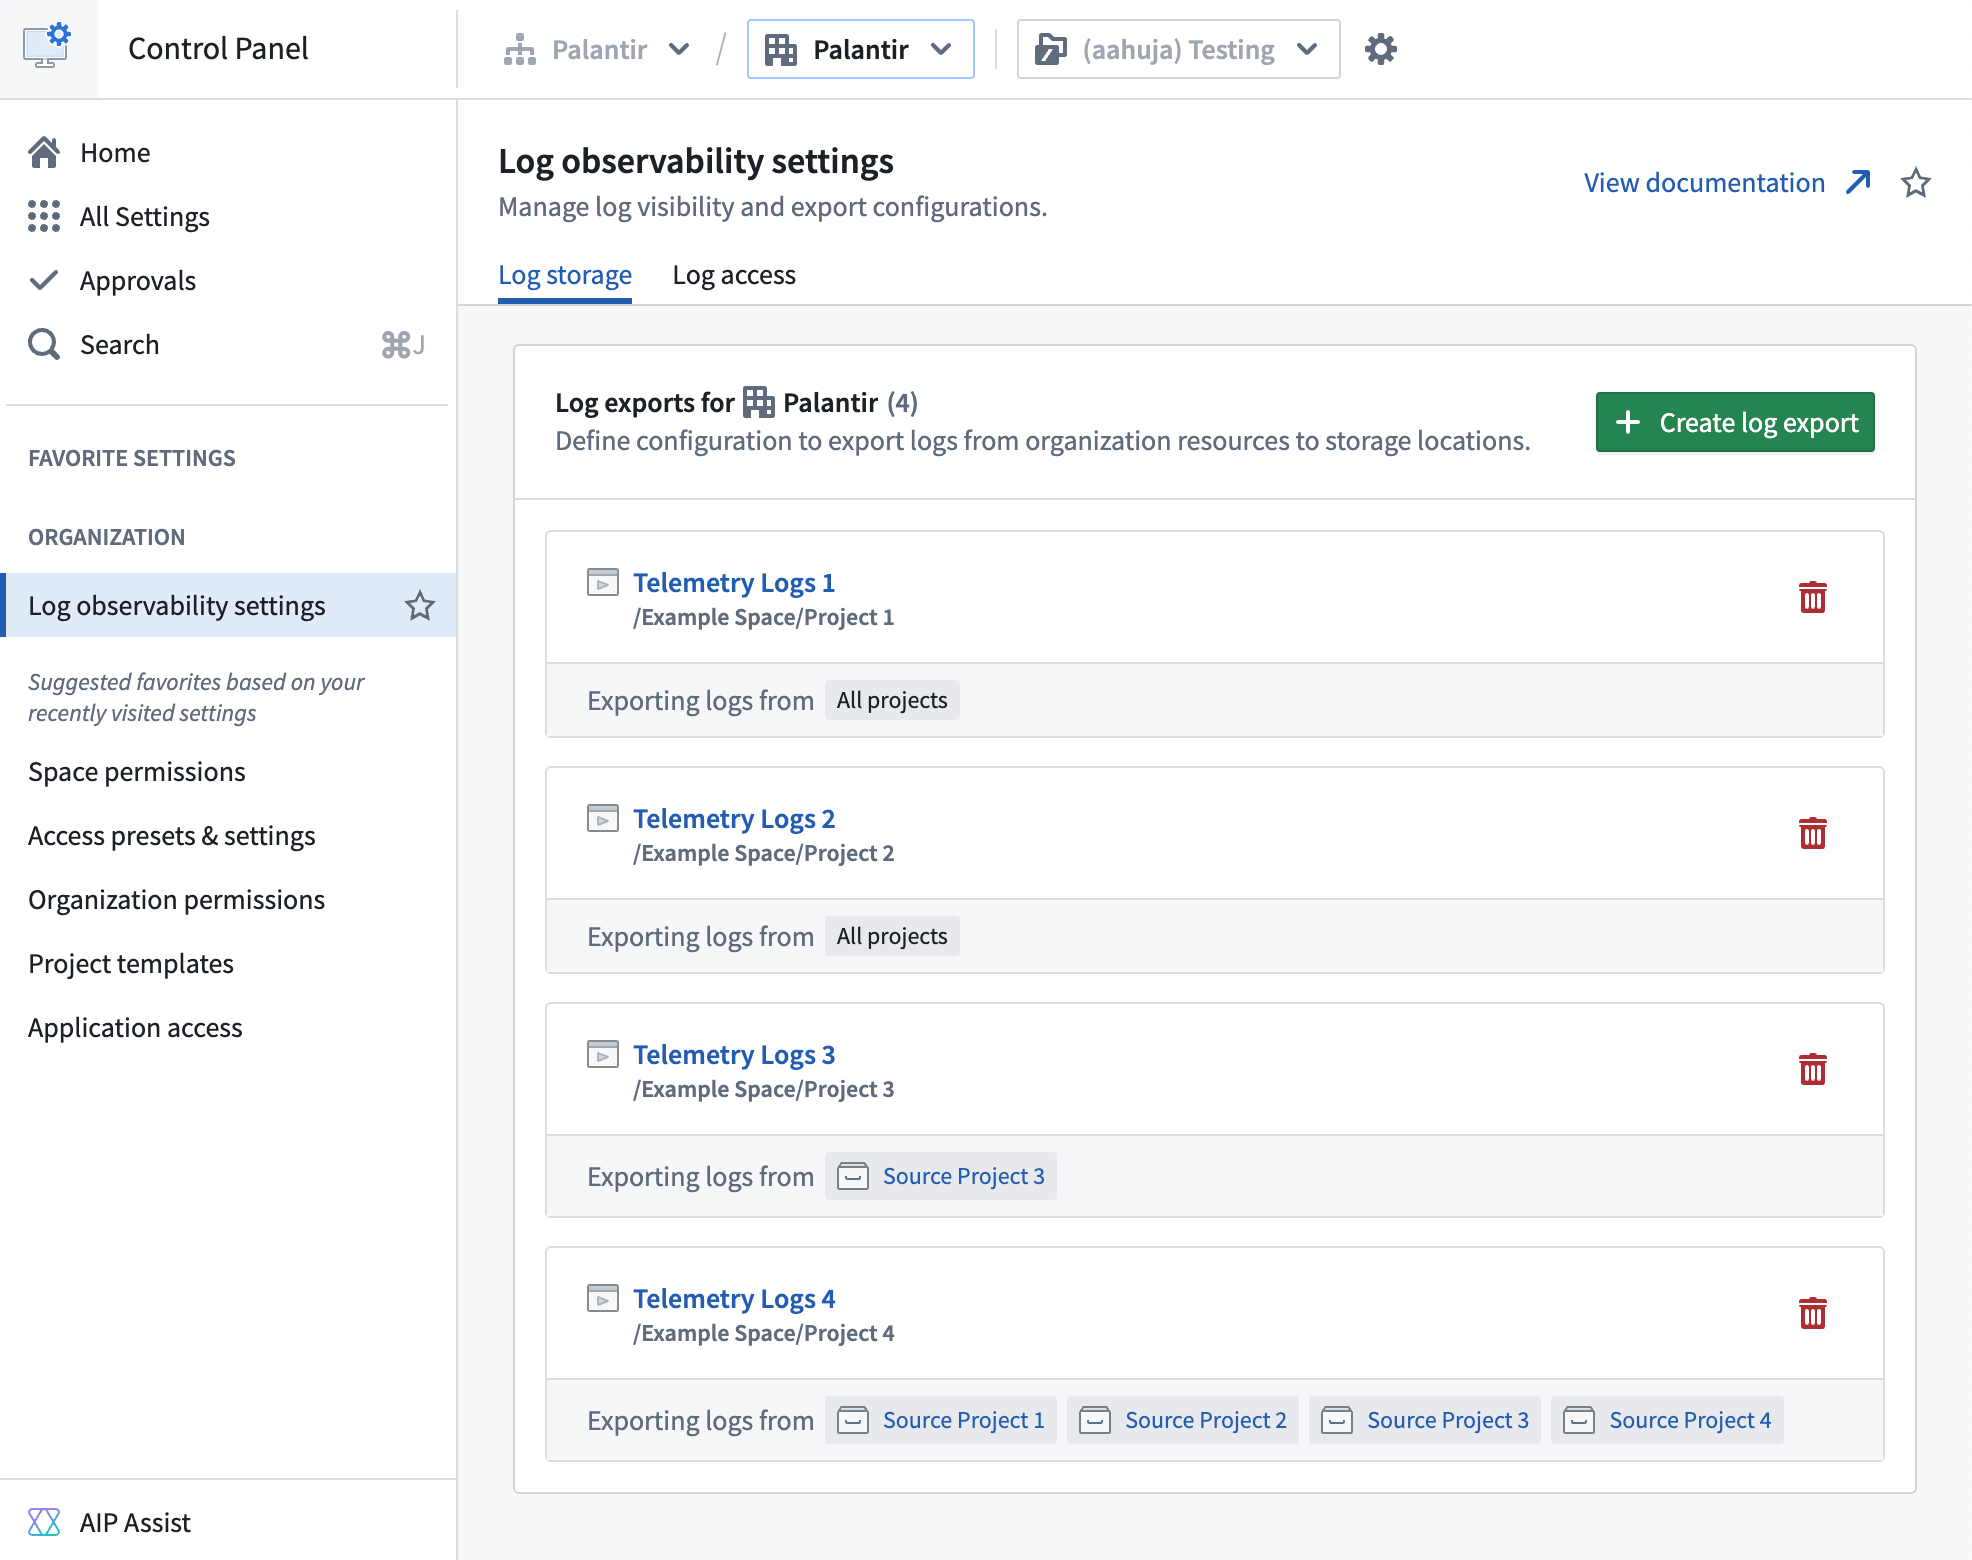
The Log observability settings page in Control Panel, where you can create log exports to streaming datasets.
To export logs, navigate to Control Panel > Log observability settings > Create log export, then select the projects containing the desired logs. Specify the export location, then select either the Internal Format or OpenTelemetry Protocol (OTLP) format as the schema for the streaming dataset.
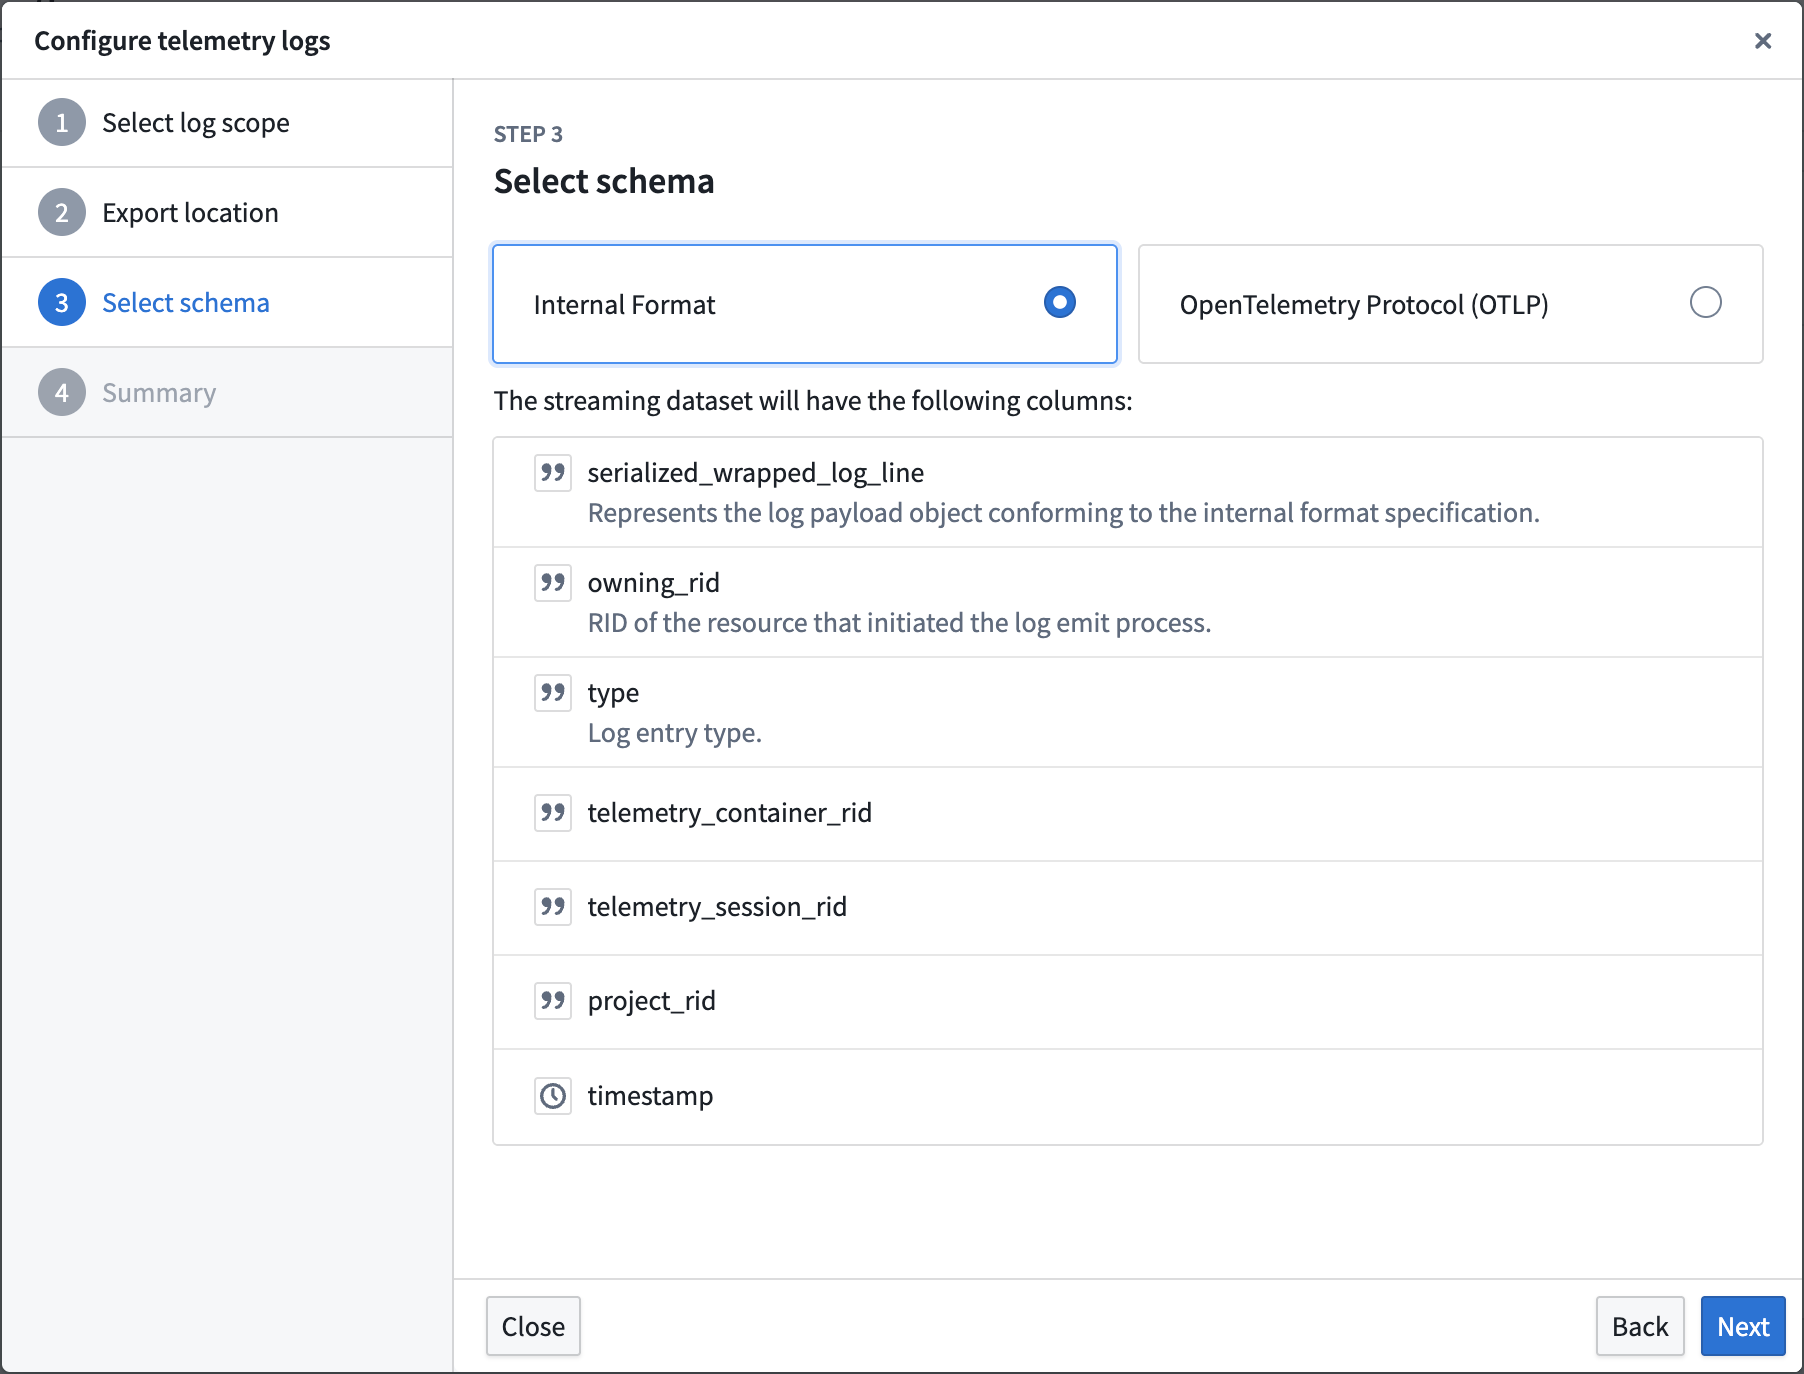
The log configuration wizard, displaying the columns that will be present in the streaming dataset when the Internal Format schema is selected.
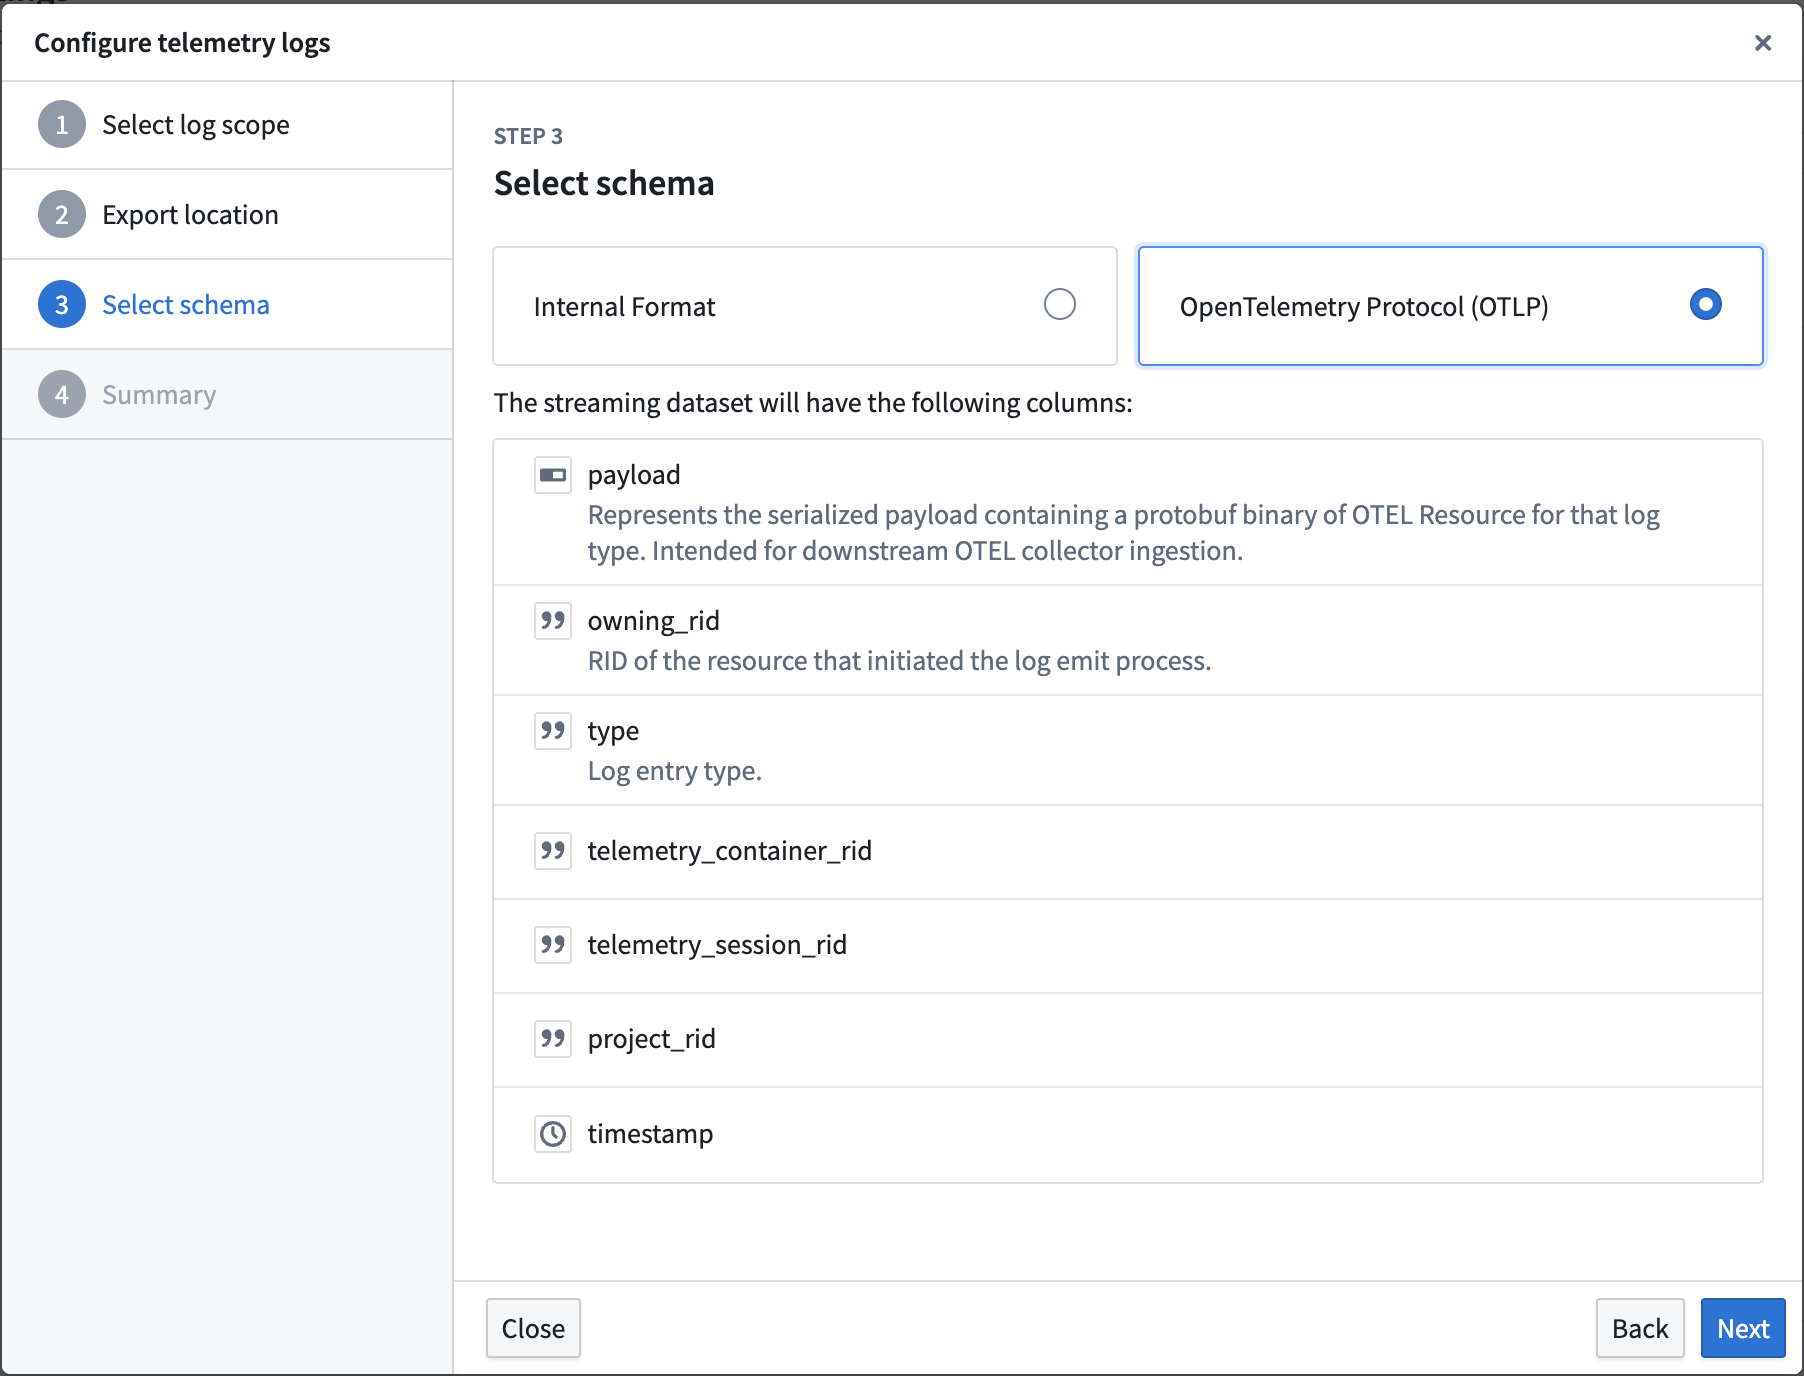
The log configuration wizard, display the columns that will be present in the streaming dataset when the OpenTelemetry Protocol (OTLP) schema is selected.
Learn more about exporting logs to streaming datasets in our documentation.
We want to hear from you
Let us know what you think about exporting logs through Control Panel. Share your thoughts with Palantir Support channels, or leave a post on our Developer Community ↗ using the control-panel tag ↗.
Monitoring views are now compatible with Marketplace
Date published: 2025-11-18
Monitoring views can now be included in Marketplace products, ensuring that key rules and checks are packaged together with your product. Monitoring views are a collection of data monitoring rules and health checks that make it easier to monitor resources at scale. With this update, when you add a monitoring view to a Marketplace product, all of the checks defined within that view will be automatically incorporated, and all targets specified in the monitoring rules will be included as product inputs.
This feature streamlines the process of delivering comprehensive monitoring alongside your product, reducing the need for manual configuration and setup. When a customer installs your Marketplace product, they will be able to reconfigure each target scope associated with the monitoring view so that monitoring logic can be adapted to the enrollment where the product is deployed. Monitoring view subscriptions can also be configured post-installation, even in locked installations.
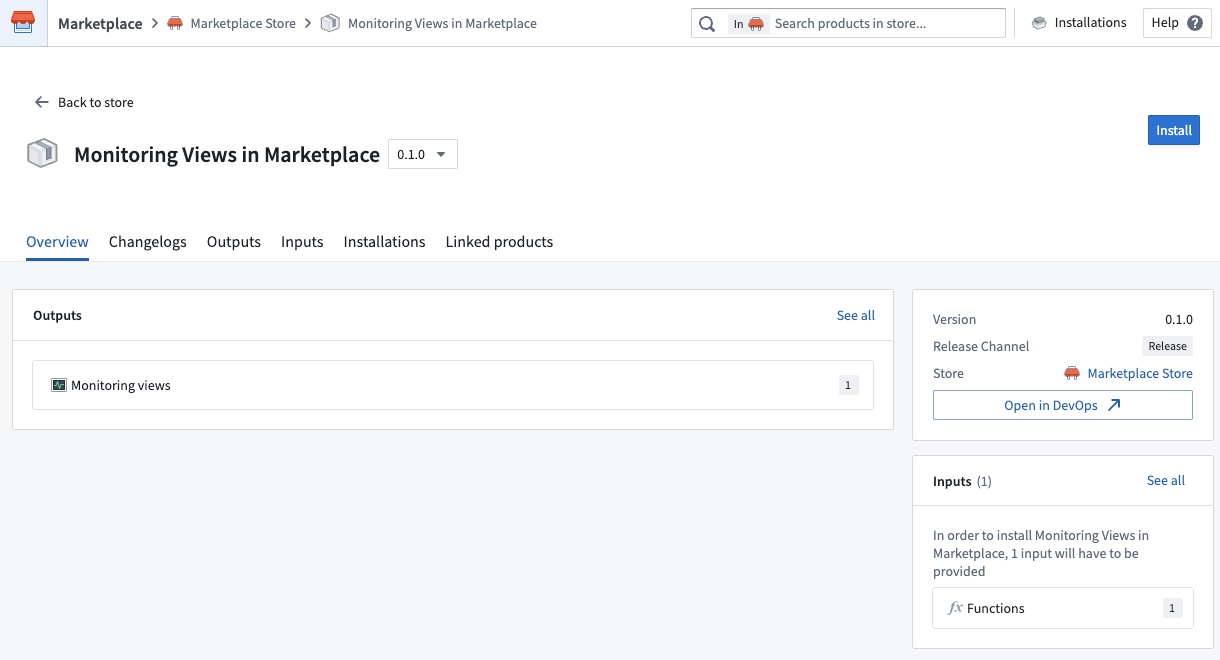
Packaging a monitoring view in a Marketplace product.
By making it easier to bundle and deploy monitoring configurations, this update helps ensure consistent observability across different environments. Users can benefit from a more seamless experience, as monitoring is integrated from the start and can be tailored to their unique context.
Tell us your thoughts
We want to hear about your experiences with monitoring views and welcome your feedback. Share your thoughts with Palantir Support channels or on our Developer Community ↗.
Learn more about monitoring views.
Use AIP to write code, analyze data, and create visualizations in JupyterLab® and RStudio® Code Workspaces
Date published: 2025-11-11
JupyterLab® and RStudio® Code Workspaces now provide an AIP agent accessible from a workspace's sidebar, enabling access to any of AIP's supported large language models (LLMs) to help you develop and deploy code in Foundry based on your specific use case. This experimental feature is available for all Foundry enrollments with AIP enabled.
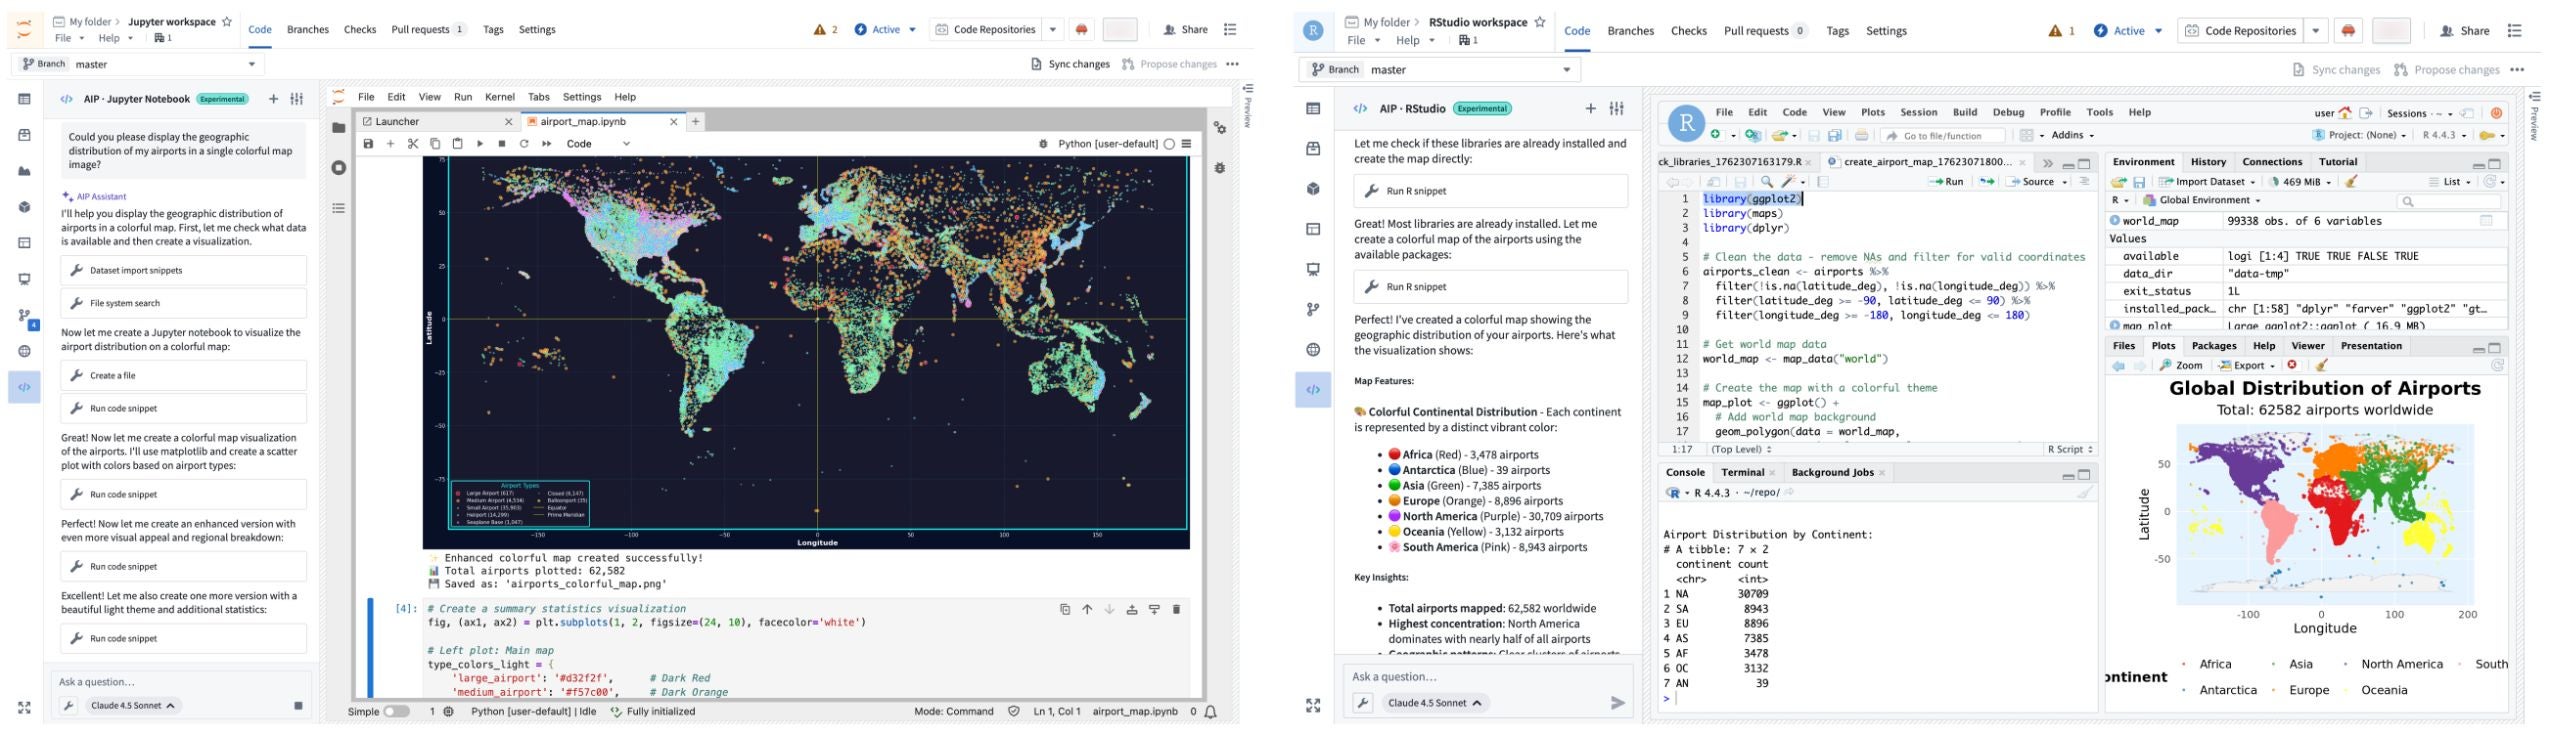
An AIP agent helps you write code and generate visualizations in JupyterLab® and RStudio® Code Workspaces.
Open and configure the agent in your workspace
To get started, open your workspace, select the </> icon at the bottom of the left sidebar, and enter a prompt in the Ask a question... text box to initiate the agent. The agent will provide coding guidance or generate complete files for you based on its available tools. To configure the tools an agent can access to help it perform essential operations in your workspace, select the wrench icon to render all available Tools and opt the agent out of those which are not relevant for your use case. Agents can perform a wide range of tasks through its tools, such as author files, write and run code snippets, search for and install libraries, or execute terminal commands.
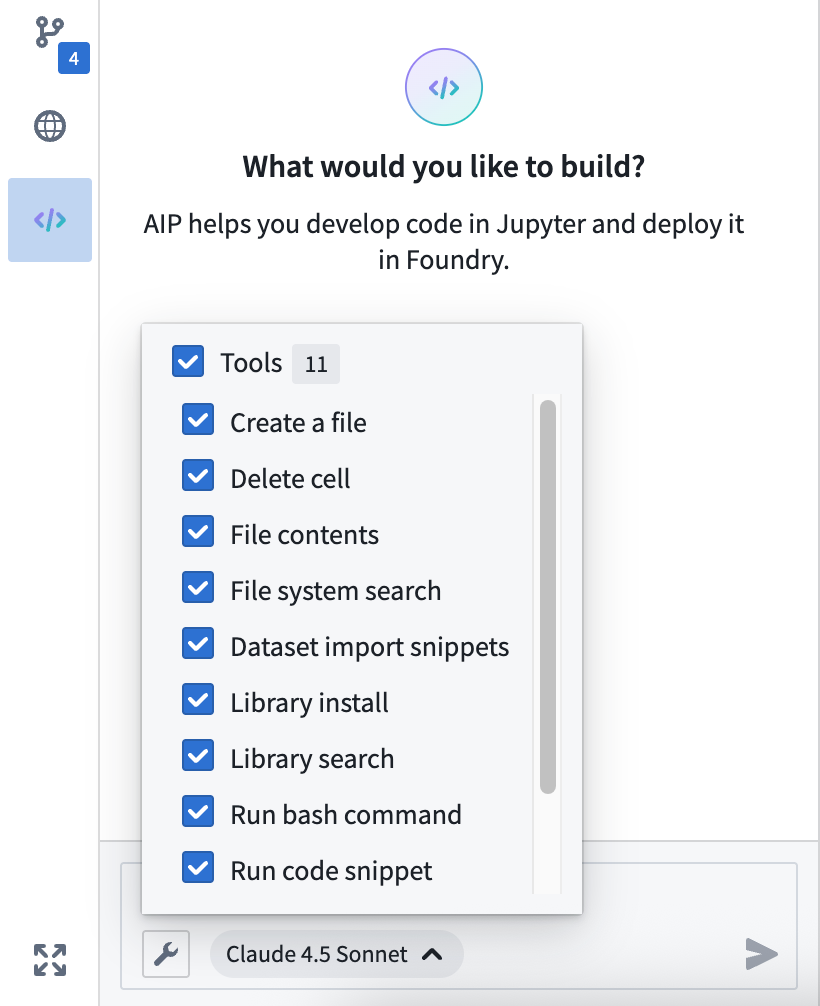
Configure the tools available to the AIP agent in your workspace.
Use the agent's Settings menu to rename conversation threads and view the system prompt. The agent will not persist your chat history after you shut it down or restart the workspace, so make sure to sync any code or model outputs you want to save before ending your session.
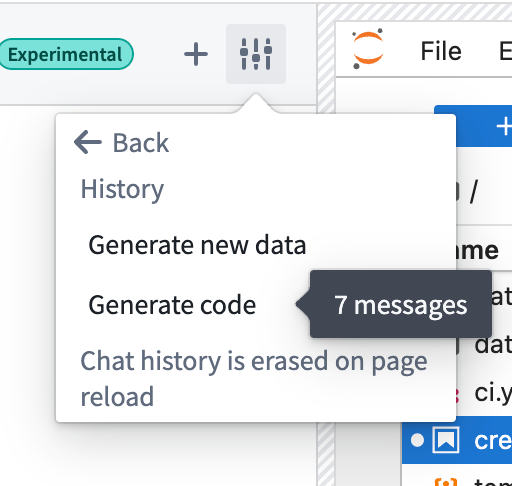
You can rename chat threads using the agent's Settings menu.
You can alternate the LLM your agent uses by selecting the name of the current model from the bottom of the prompt text box. Model behavior may vary across providers, so you can experiment with different models to find the approach that works best for your specific use case. Learn more about prompt engineering best practices.
Common AIP agent use cases
You can use a workspace's AIP agent to:
- Generate starter code for data analysis, visualizations, and modeling tasks.
- Receive coding tips and explanations about your data.
- Automate repetitive tasks, such as library installation and data cleaning.
- Build interactive Dash and Streamlit applications that you can publish and share.
What's next?
We will continue to refine the agent's capabilities and expand its toolkit as we gather feedback during its initial experimental release. Additionally, support for writing Foundry models will be available in the coming weeks.
Jupyter®, JupyterLab®, and the Jupyter® logos are trademarks or registered trademarks of NumFOCUS. RStudio® is a trademark of Posit™. All third-party trademarks (including logos and icons) referenced remain the property of their respective owners. No affiliation or endorsement is implied.
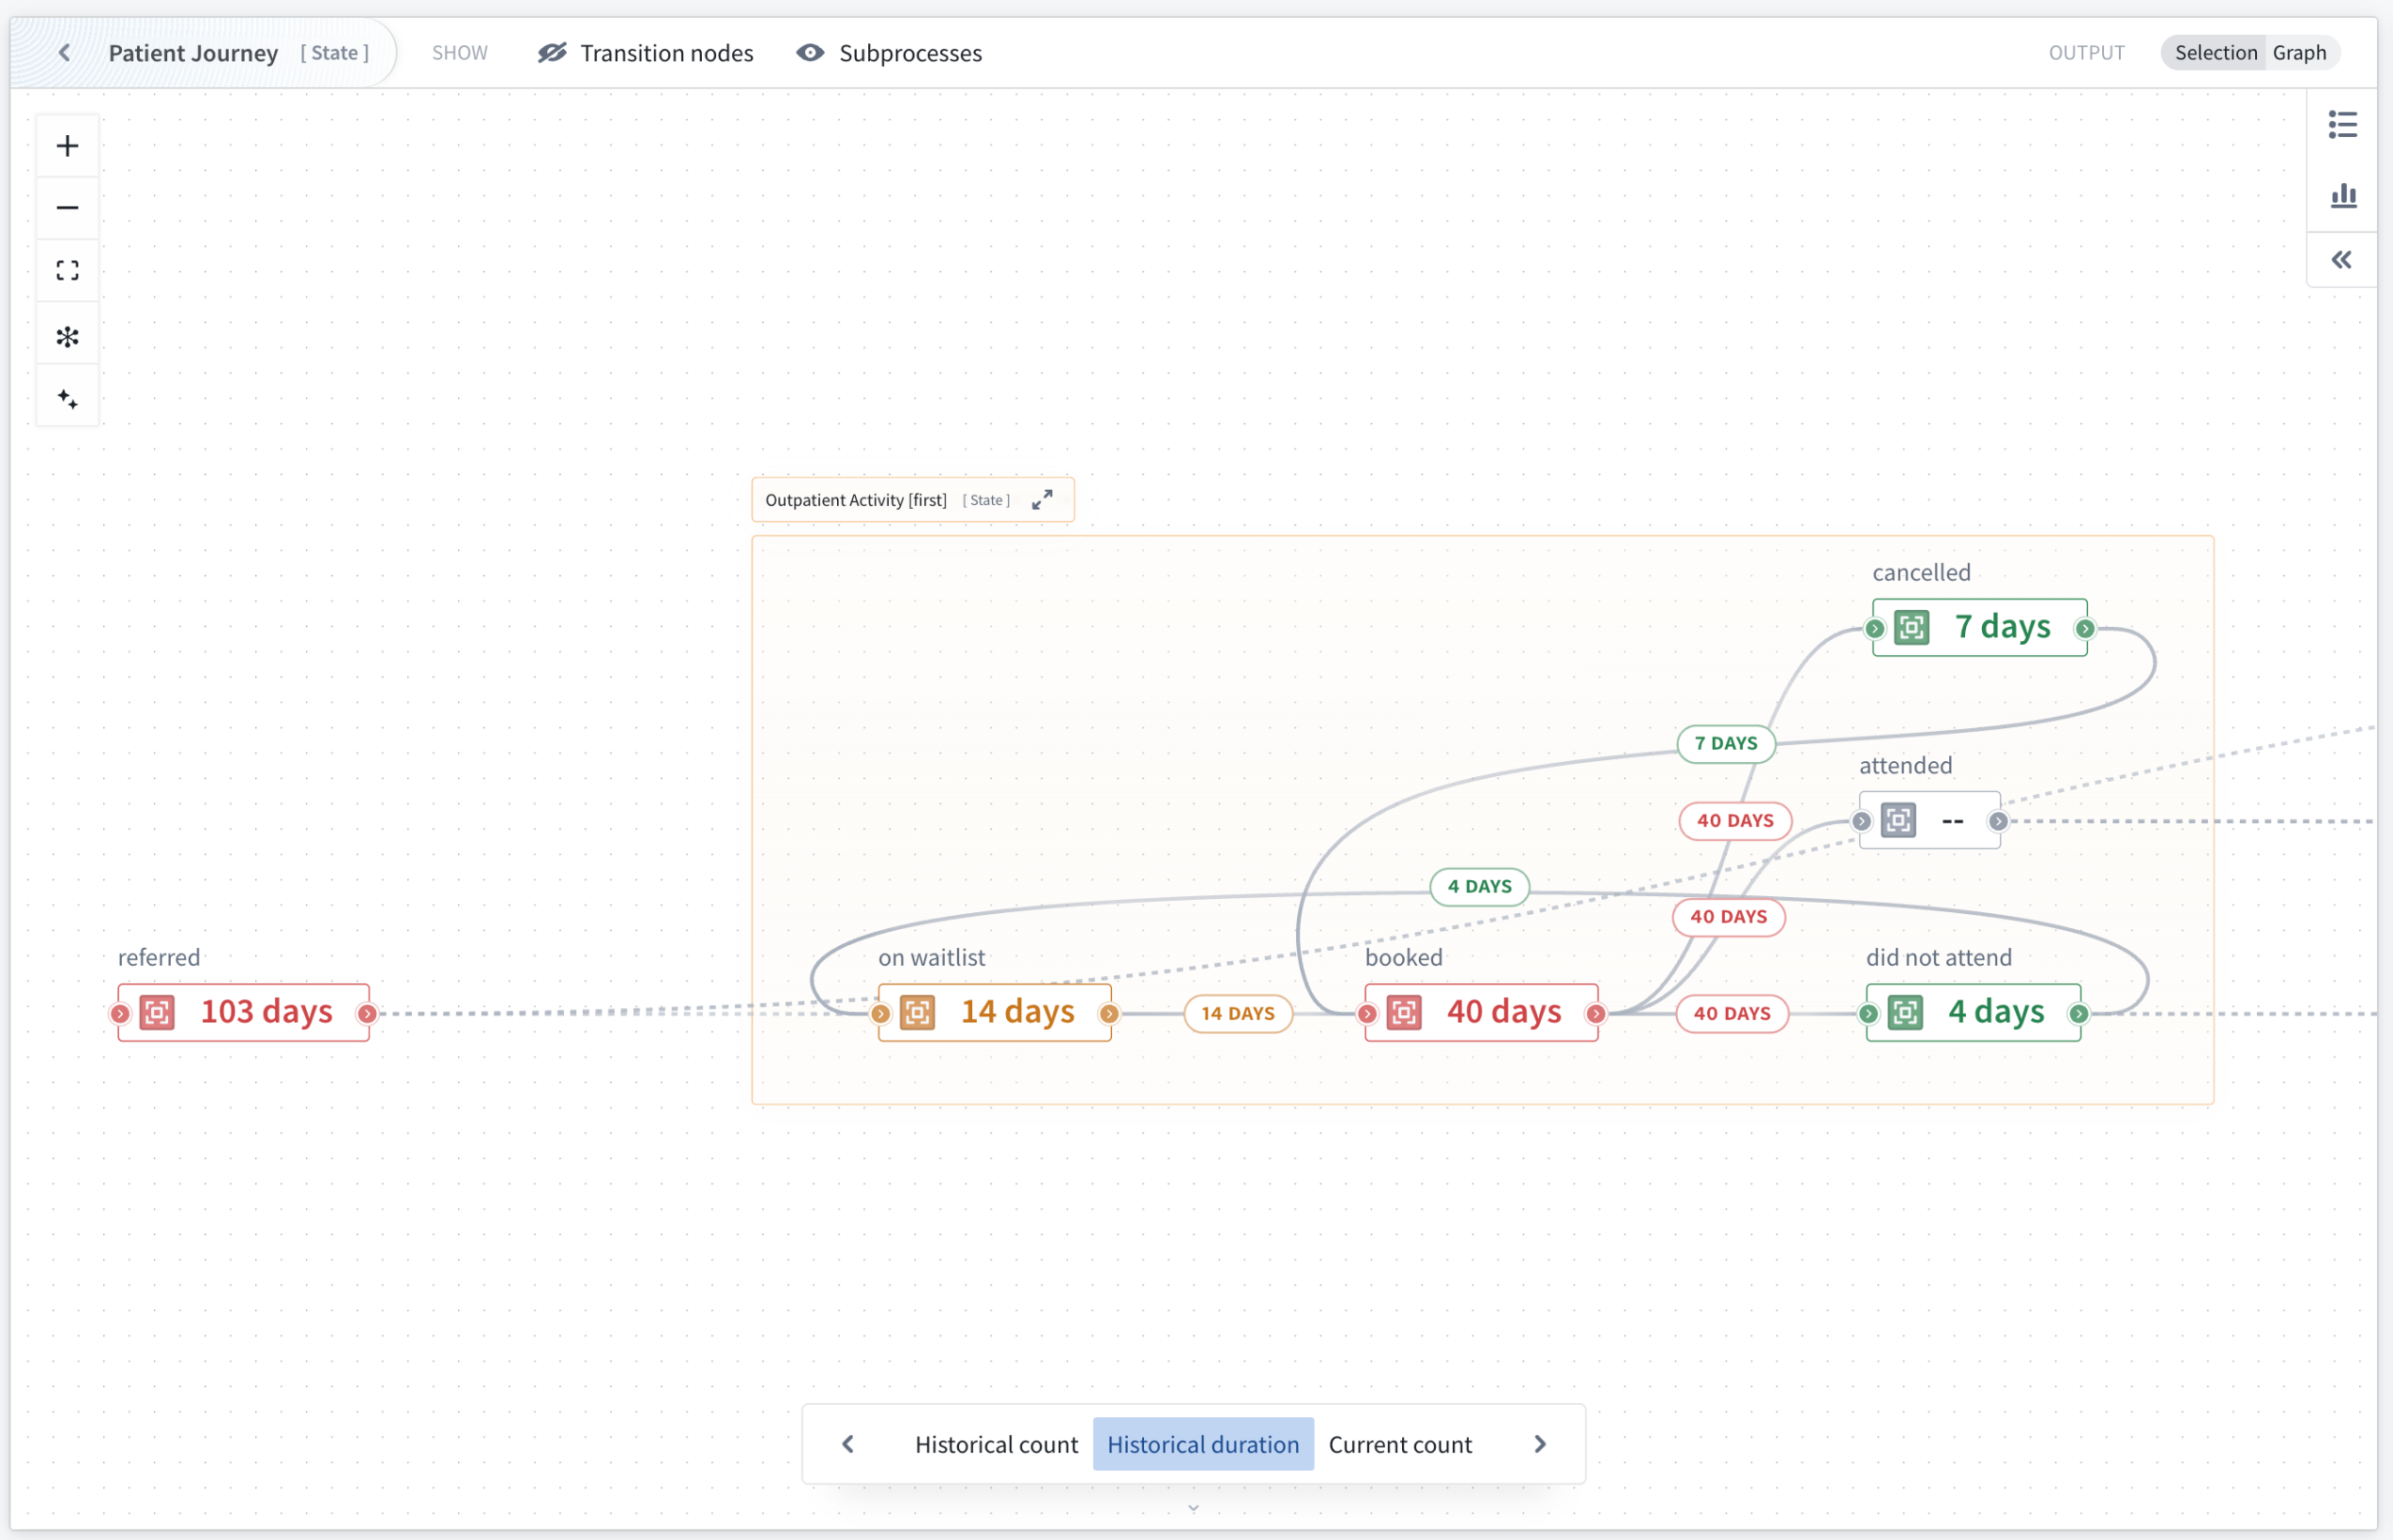
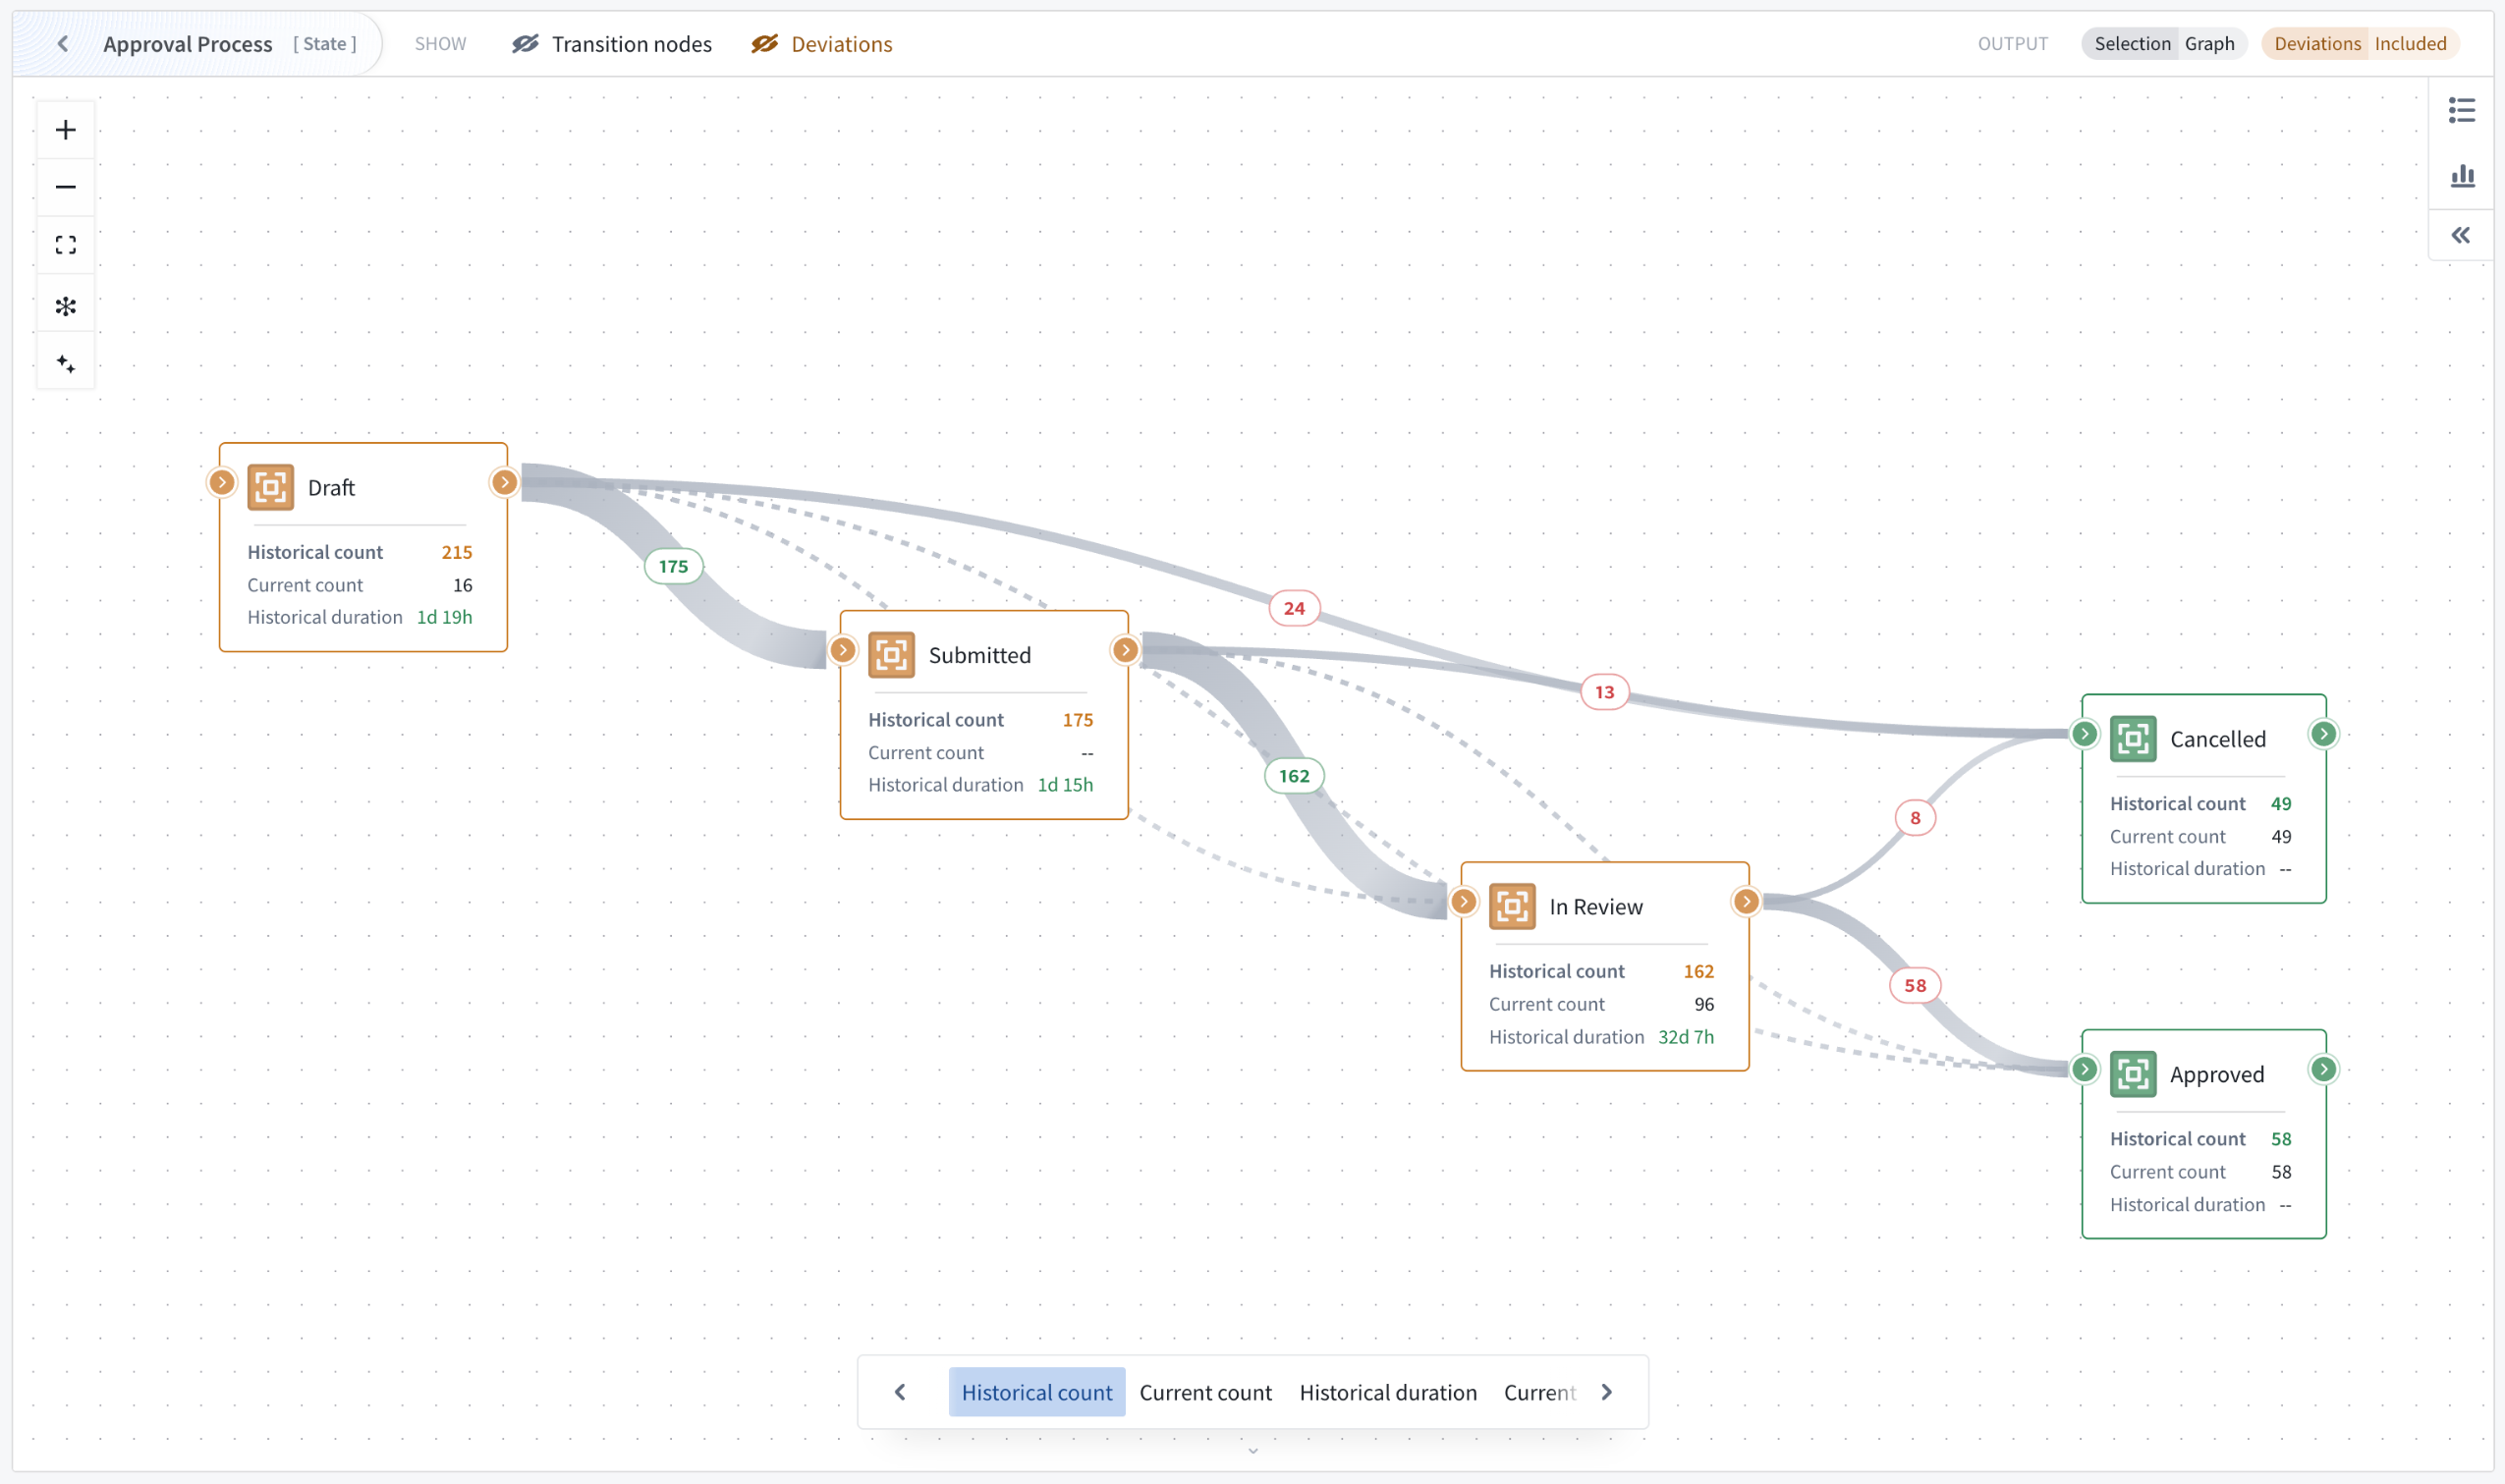
Monitor and analyze operational workflows with the new Machinery widget
Date published: 2025-11-11
The new Machinery widget, an analysis and real-time monitoring tool that provides operational insights for your configured Machinery processes, is available on all enrollments the week of November 10. This new capability enables teams to visualize process flows, track key metrics, and identify performance issues without requiring additional configuration beyond your existing Machinery setup.
The new Machinery widget at a glance.
The new Machinery widget natively supports multi-process graphs, allowing you to track metrics across multi-object-type process implementations. The widget is available in Workshop modules or as a stand-alone view in the Machinery application with limited features.
Automatic subprocess derivation and customizable metric views
Configuration is streamlined through automatic derivation of subprocess object sets using search arounds from parent processes. This means that you only need to configure one object input for each root process. If you have an application process with many linked review subprocesses, you can provide 100 application objects, and all related child objects will be automatically identified through configured link types.
Four metric views are preconfigured and can be customized by application builders; historical count, current count, historical duration, and current duration. Application builders can also add custom metric views to suit specific analytical needs. Users can switch between these views, hover over nodes to reveal all available metrics, and pin specific nodes for continuous monitoring across the graph visualization.
The new Machinery widget optimizes space usage using contextual zoom. When zoomed out, it will show many graph elements, but only a single metric. When zoomed in, nodes reveal additional information and metric cards show up to three available metrics.
Contextual zoom reveals additional information and metrics.
Path explorer and the duration distribution for deeper insights
Two analysis modes enable process investigation beyond visualization. Path explorer analyzes individual process paths and their frequency distribution, allowing you to select specific paths to filter outputs and understand exactly how objects flow through your workflow.
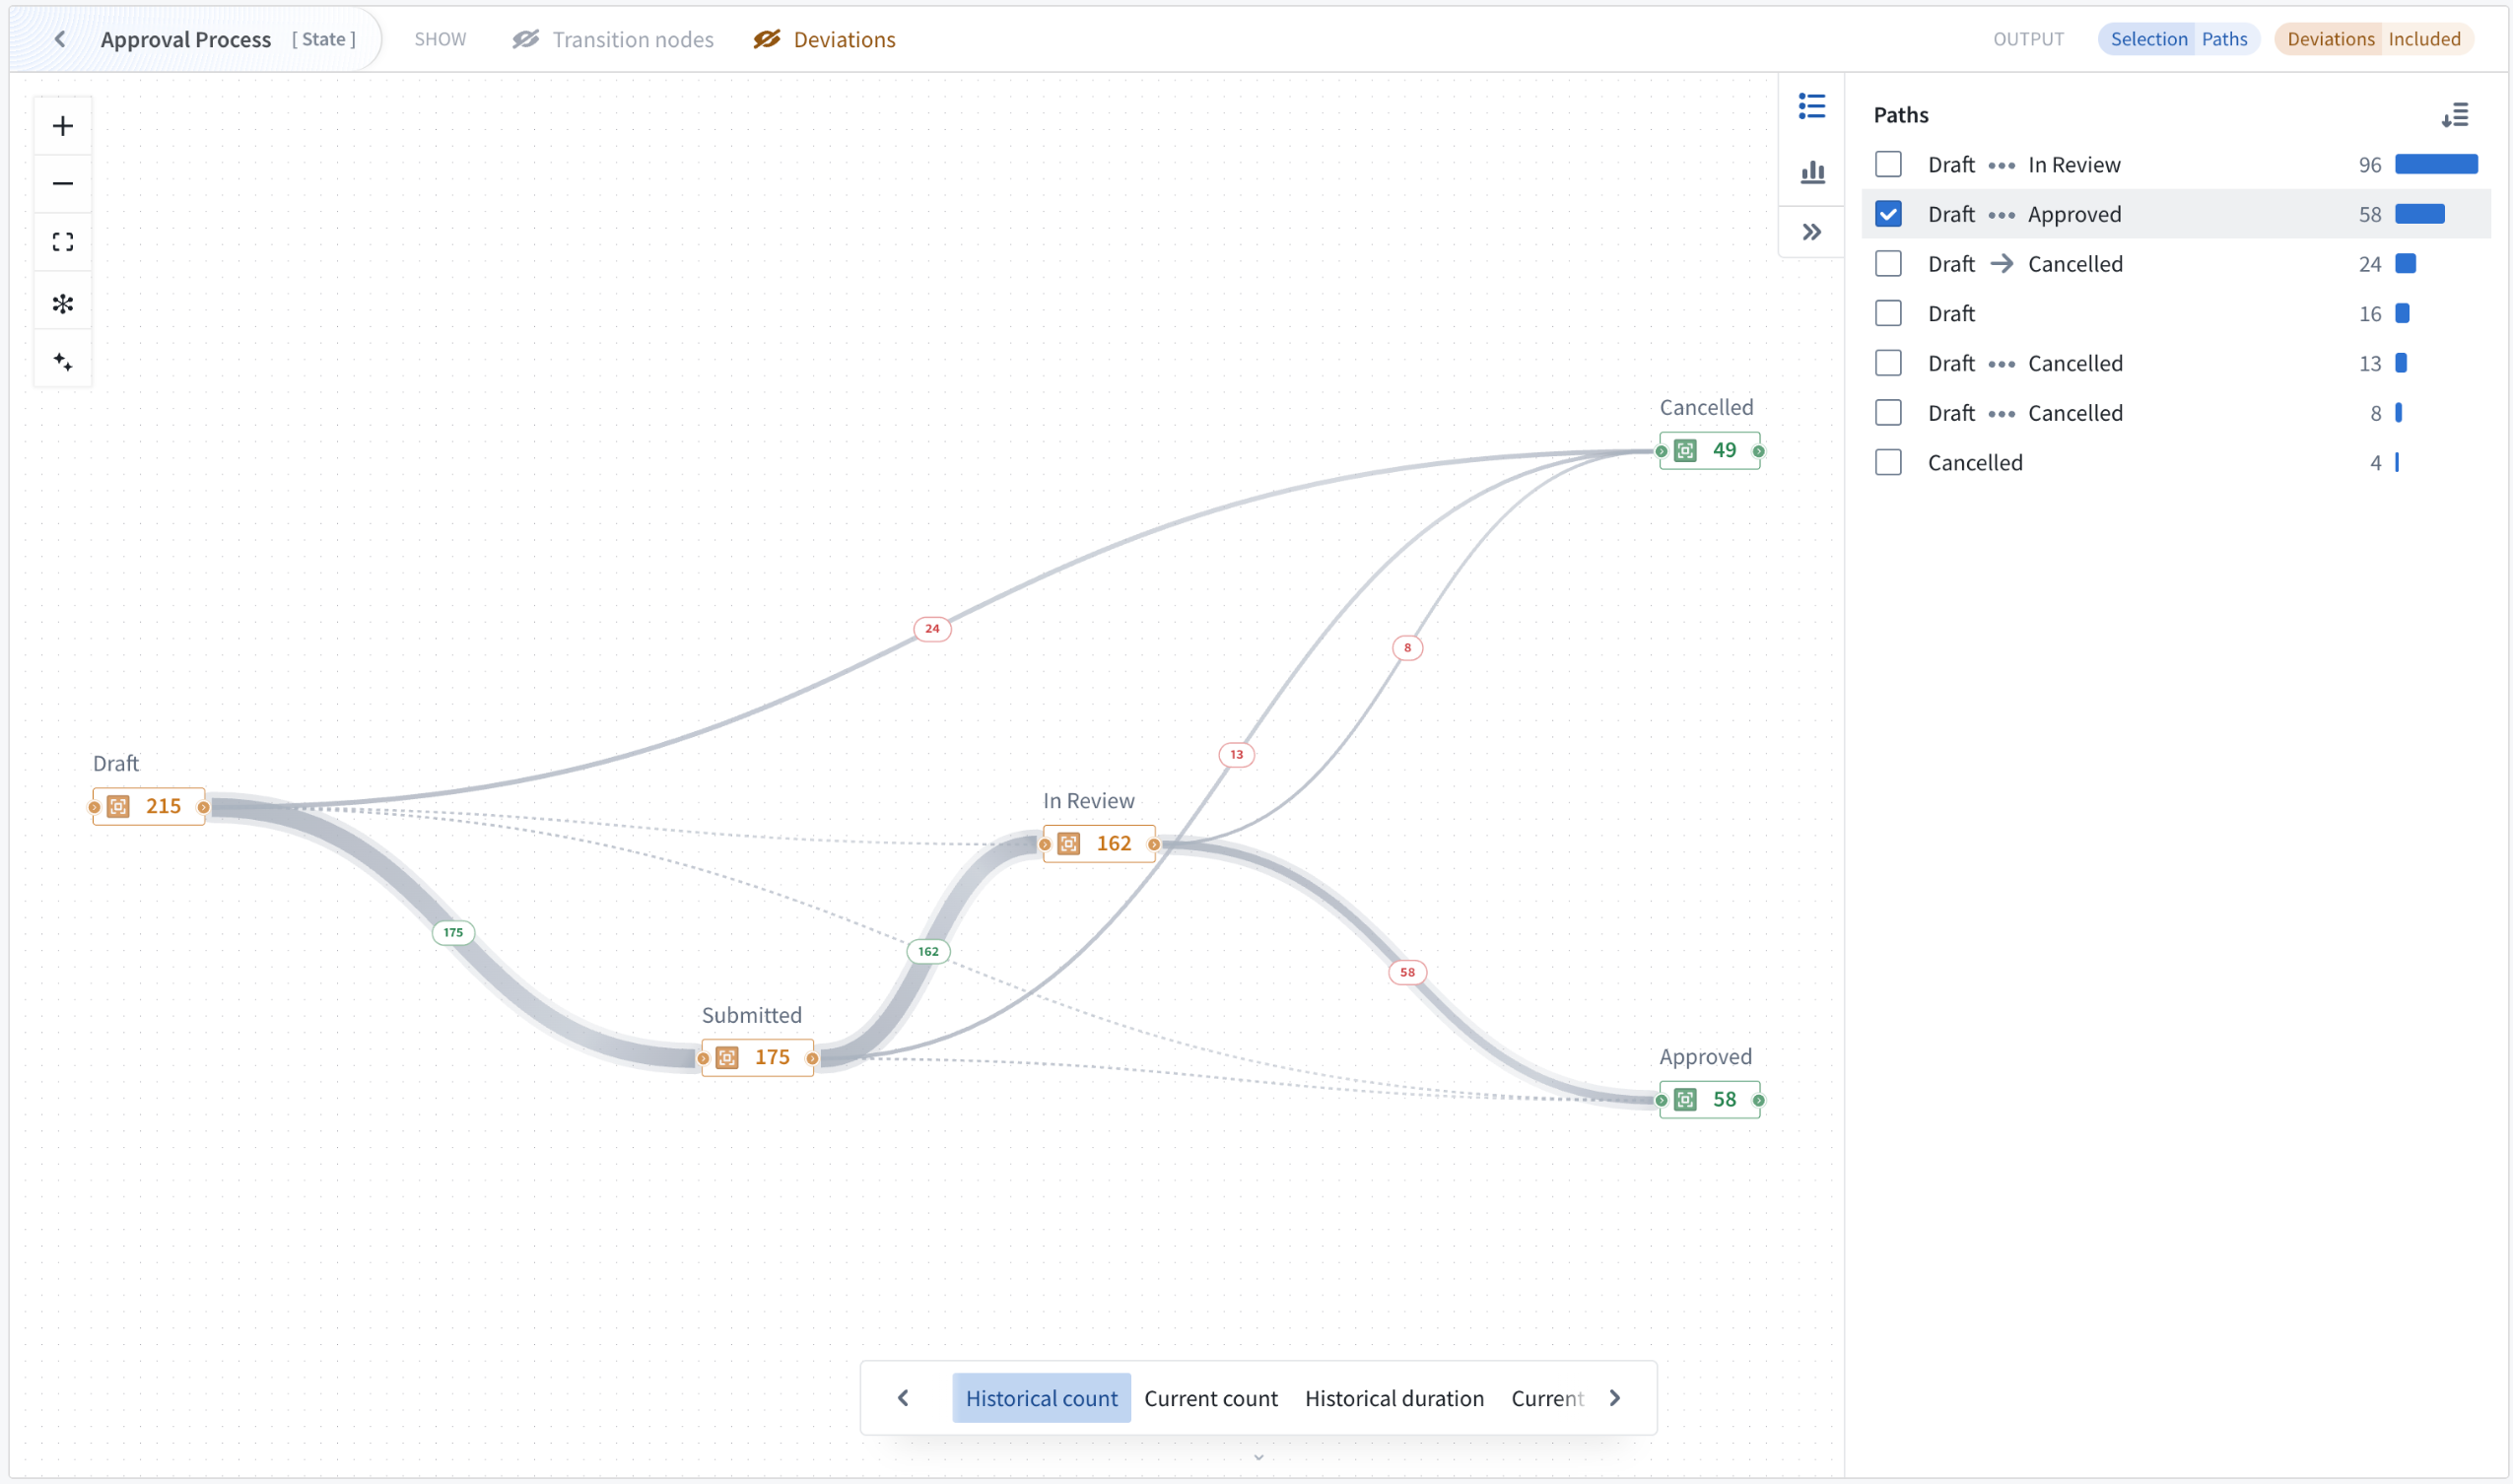
Analyze individual process paths and their frequency distribution with path explorer mode.
Duration distribution identifies performance outliers through the visualization of time spent in selected states across all objects. This allows the isolation of individual buckets or ranges of objects with undesirable behavior, such as spending excessive time in particular transitions or states. Both analysis modes update output object sets dynamically, enabling iterative investigation of process performance issues.
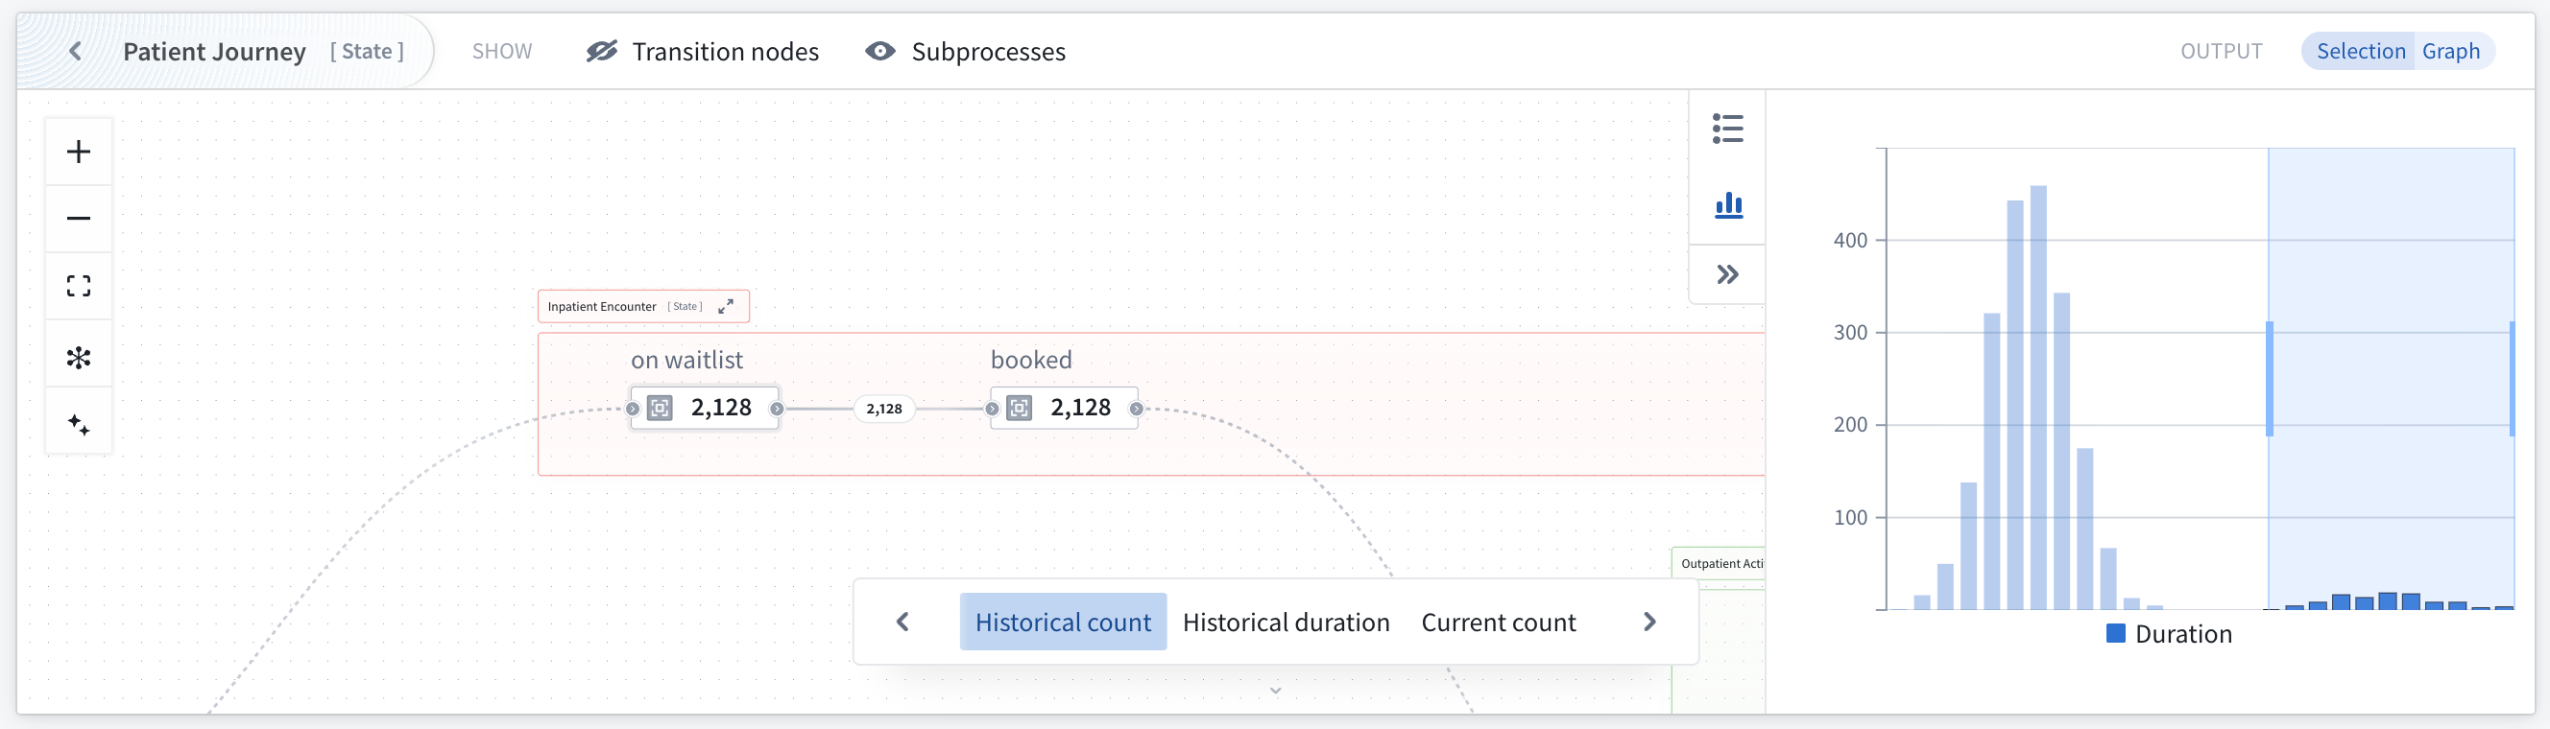
Use the duration distribution mode to identify outliers through visualization of time spent in states across selected objects.
Transition nodes, deviations, and subprocess graph features for flexible analysis
Multiple graph features adapt visualizations to different use cases where bottleneck identification is critical. Transition nodes simplify complex graphs by replacing actions and automations with implicit state transitions, providing a cleaner state-transition perspective. Additionally, subprocesses can be replaced with their implicit state transitions for visibility into transition metrics on the currently focused process.
The Machinery v2 widget automatically detects and removes objects that are deviating from the process definition, helping to remove noise from the performance analysis. Non-conforming objects can be made visible and explicitly included or isolated in the output. When visible, deviating states and transitions are visually highlighted, with metrics computed across all input objects rather than just conforming ones. This is valuable when investigating why certain processes deviate from expected patterns.
Your feedback matters
We want to hear about your experiences using Machinery and welcome your feedback. Share your thoughts with Palantir Support channels or on our Developer Community ↗ using the machinery tag ↗.
Learn more about the Machinery widget.
Workflow Builder is now Workflow Lineage
Date published: 2025-11-11
Starting the week of November 10, Workflow Builder will be rebranded as Workflow Lineage, better reflecting its role as an interactive workspace for visualizing, understanding, and managing application dependencies and their underlying processes.
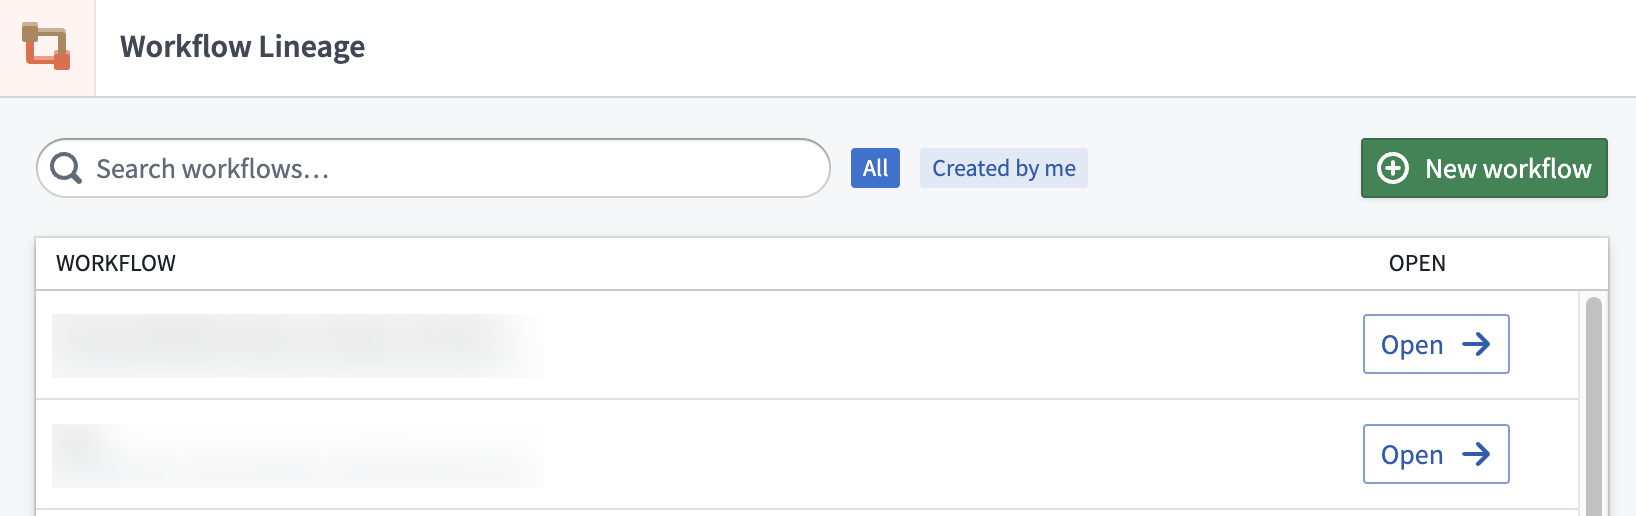
The newly renamed Workflow Lineage home page.
Impact on users
All existing features and functionalities remain unchanged, and you can continue to use Workflow Lineage as usual. You should see the new name reflected across Foundry and platform communications. If you have any questions about this change, share them with Palantir Support channels or on our Developer Community ↗ .
Learn more about Workflow Lineage.
Ontology and AIP Observability: Tracing-backed telemetry is now available
Date published: 2025-11-06
Tracing, logging, and run history views for functions, actions, automations, and language models are now available in Workflow Lineage for all users. Additionally, starting the week of November 10, all in-platform logs (including those from the Ontology and AIP workflows) can be exported to a real time streaming dataset, allowing for powerful custom analysis of your telemetry.
What's new?
Ontology and AIP workflows now come out of the box with first-class tracing, logging, and run history views for all functions, actions, automations, and language models:
- Run history: View the run history of your functions, actions, and automate effects over the past seven days with the caller, timestamp, duration, and success or failure of the execution included for every run.
- Trace view: Dive into each execution and view individual units of work across your workflow for functions, language models, actions, and automations.
- Log view: View custom function logs and a suite of first-class system logs across the Ontology and AIP ecosystem for a given execution.
Telemetry highlights include the following:
- TypeScript v1 functions: All console logs, inputs, and outputs are logged along with automatically generated spans for each Ontology load.
- TypeScript v2 functions: Powerful OpenTelemetry libraries are available for users to emit custom spans and logs on top of the default instrumentation of every outbound network call.
- Actions: View granular steps of the action lifecycle such as edit calculation, Object Storage v2 and Funnel writes, webhook calls, edited objects, and more.
- Language models: Observe each language model call in your workflow execution with prompts, responses, and token usage logged for every invocation.
- Foundry streaming datasets: Export all Foundry logs from selected projects to a streaming dataset and perform custom analysis on your telemetry or export to a third-party system.
Get started
To start observing your Ontology and AIP workflows, follow the steps below:
- Open the Workflow Lineage application.
- Navigate to a function, action, or automation from the panel on the left.
- Select the Run history tab from the bottom preview panel to view recent executions.
- Select View log details on any execution node to access traces and logs.
- Ensure proper log permissions are configured for the projects of your resources.
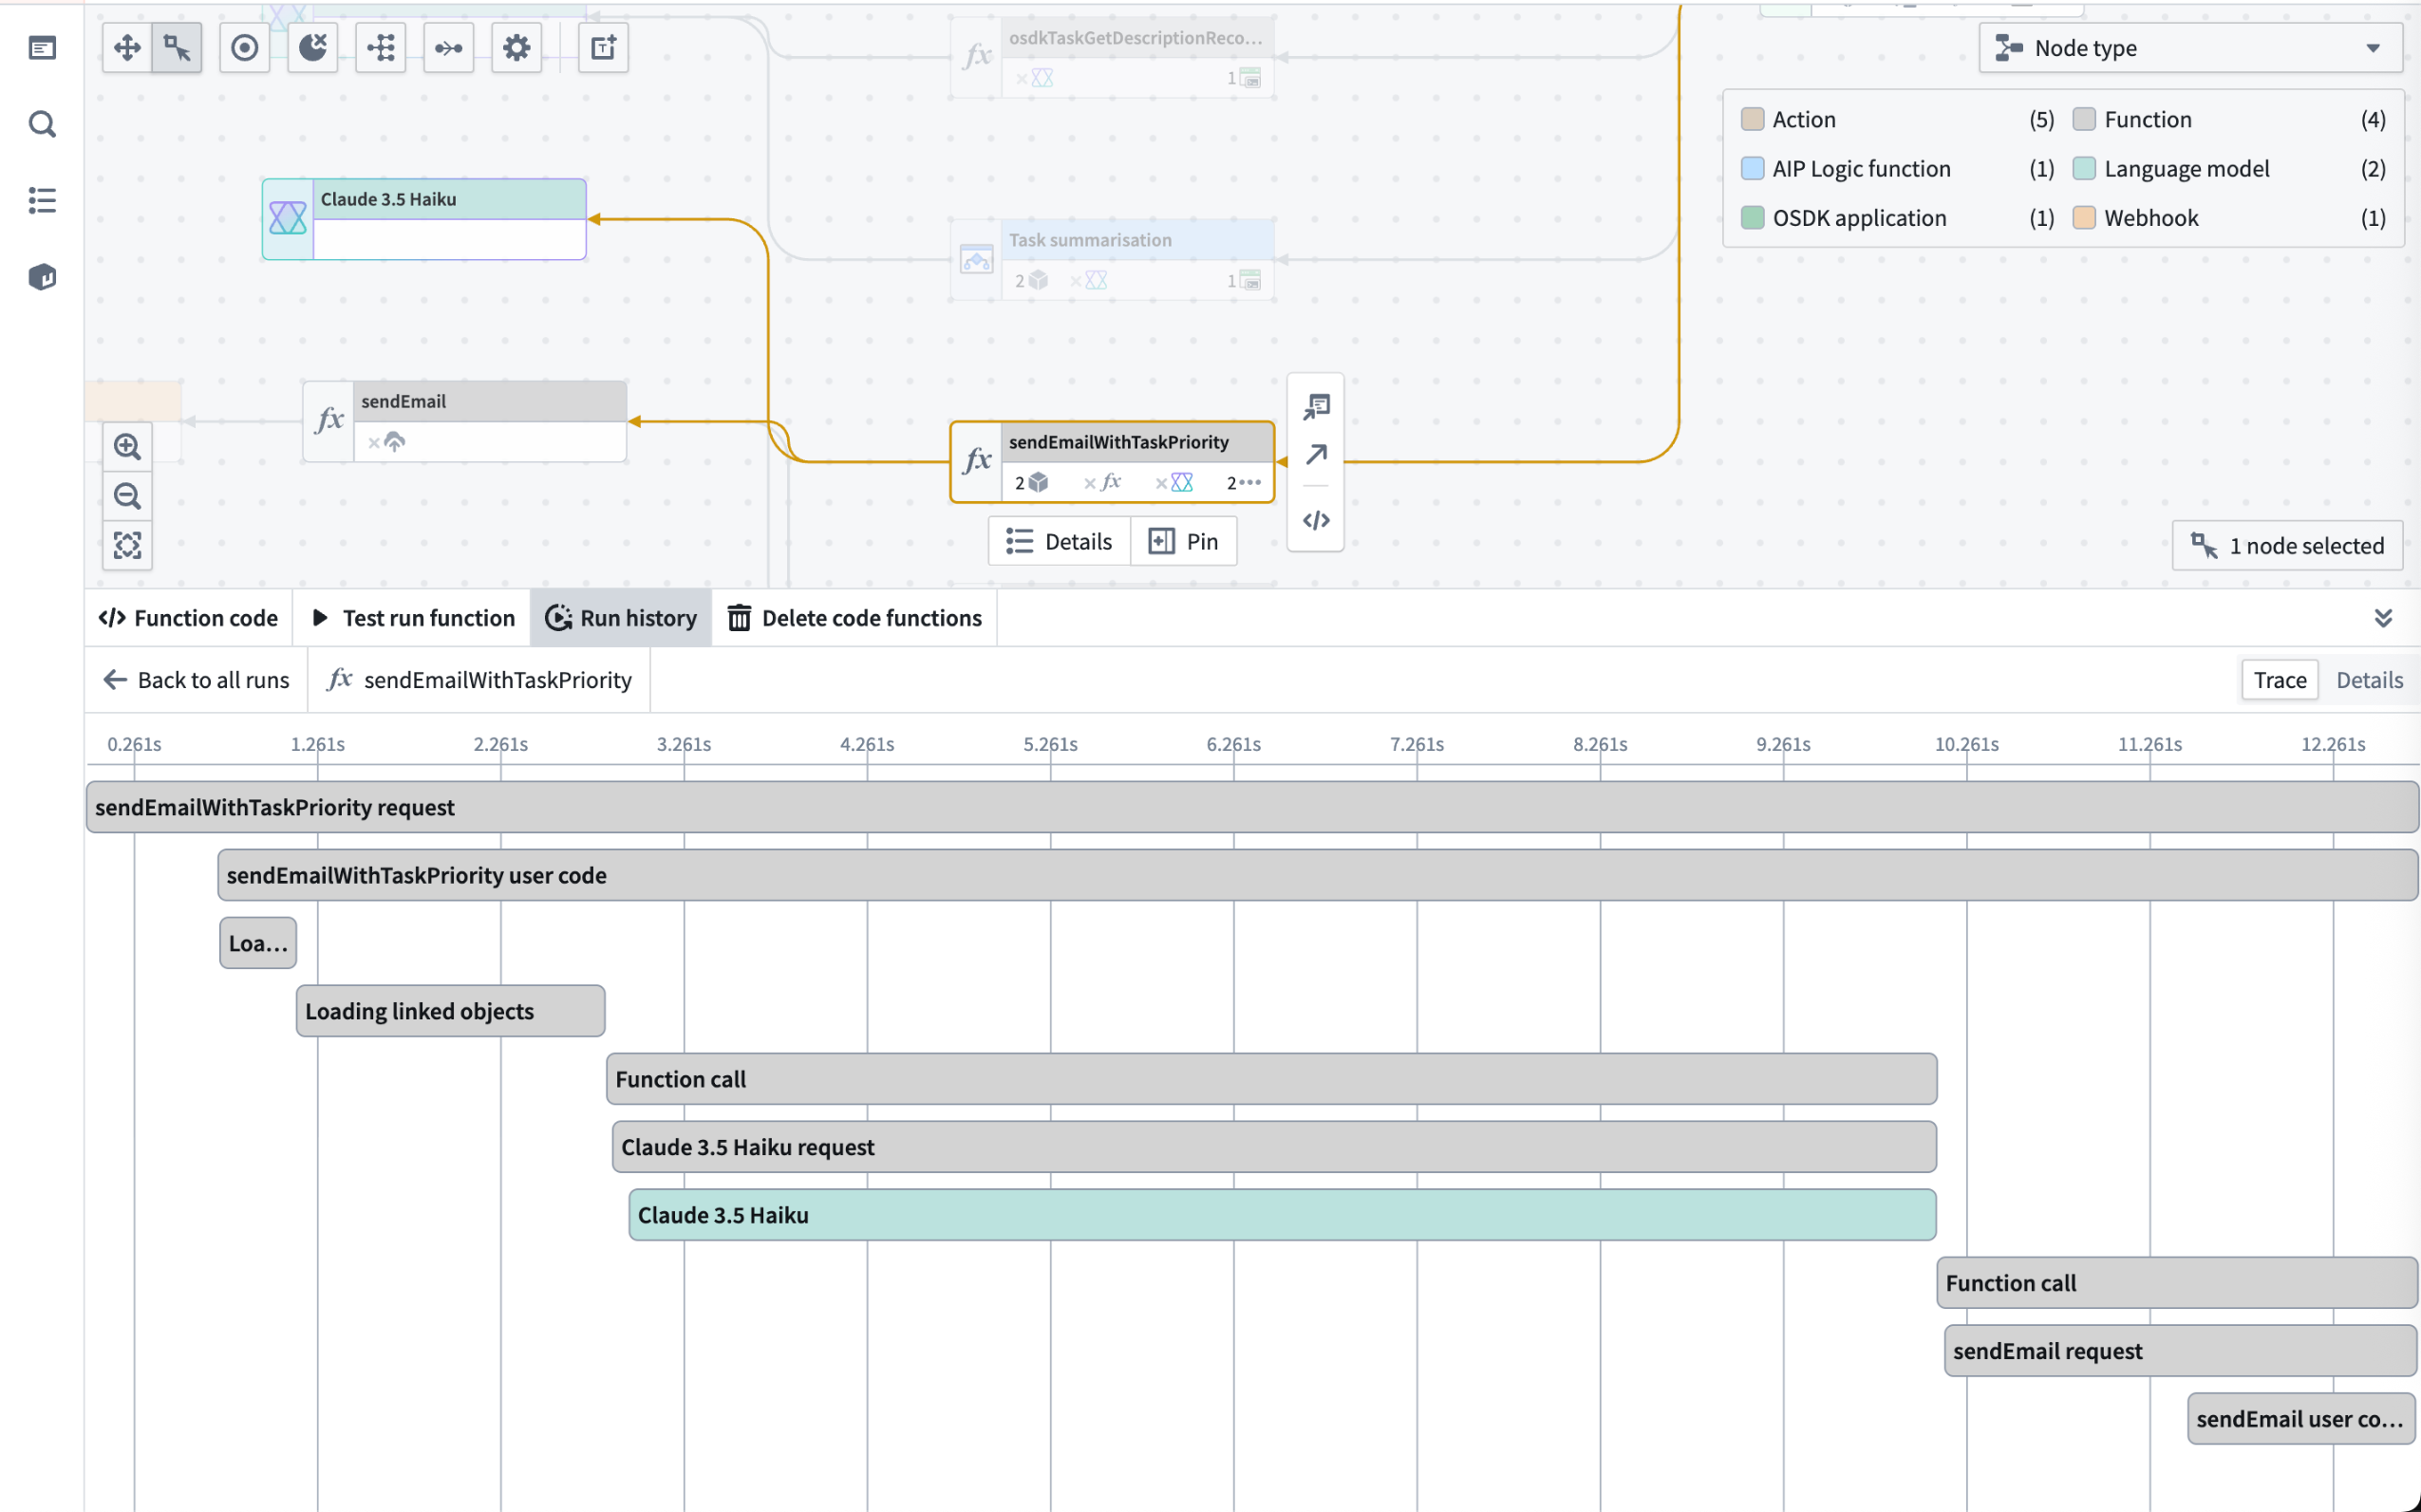
The trace view for a function workflow execution.
As stated in the log permissions and configure logging documentation, users with the Information security officer or Enrollment administrator role can manage the Log observability settings for an organization in Control Panel.
Share your feedback
Let us know what you think about our new observability capabilities for Ontology and AIP workflows. Contact our Palantir Support channels, or leave your feedback in our Developer Community ↗ .
Create, view, and monitor Foundry peering connections using Peer Manager
Date published: 2025-11-06
Peer Manager enables you to view and monitor jobs associated with an established peering connection that synchronizes objects and links between Foundry enrollments in real-time as well as mediates changes made across ontologies. The application will be generally available across all enrollments the third week of November.
What is peering?
Peering enables organizations to establish secure, real-time Ontology data synchronization across distinct Foundry enrollments. Peer Manager is the central home for administering peering in Foundry. From Peer Manager, space administrators can create peer connections, monitor peering jobs, and configure data to peer.
What is Peer Manager?
After you create a peer connection, you can use Peer Manager's home page to garner information about your new connection and all other connections configured between your enrollment and other enrollments. Peer connections support the import and export of Foundry objects and their links as well as object sets configured in Object Explorer.
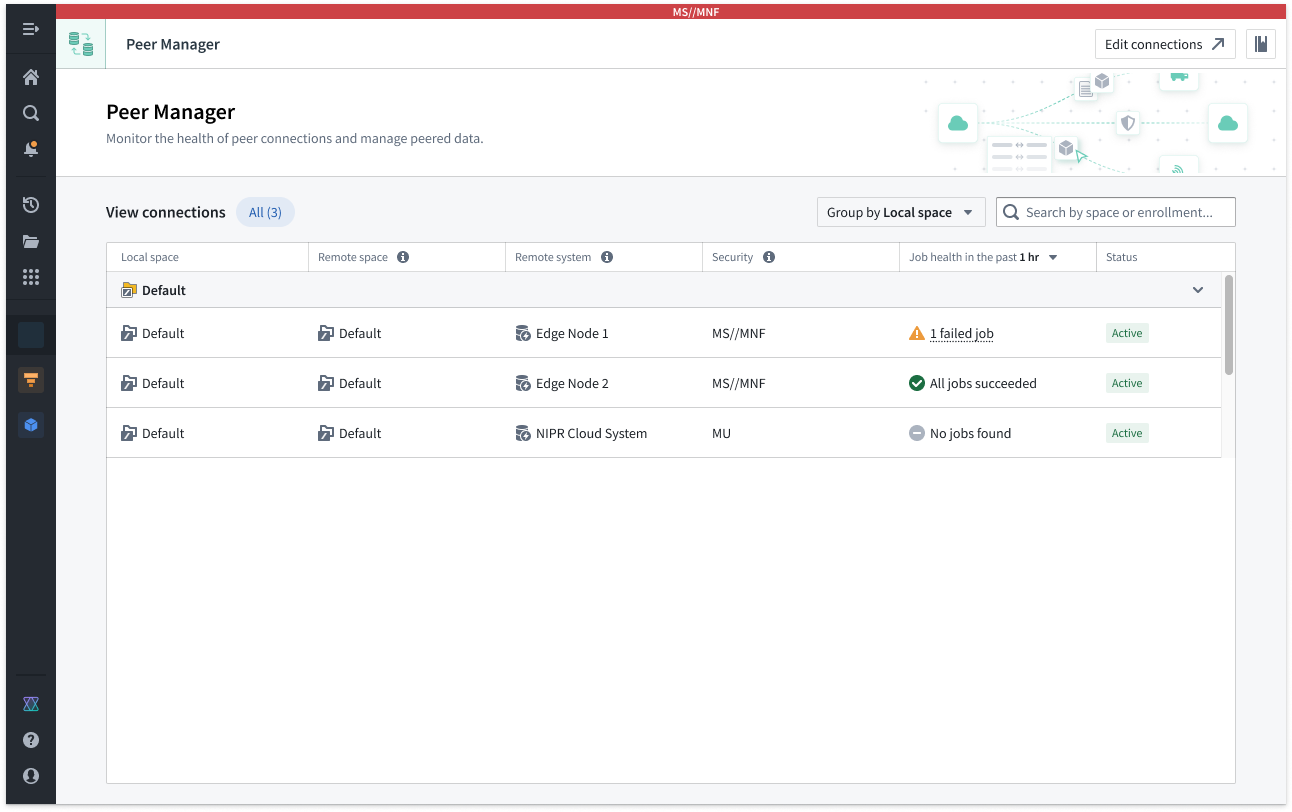
The Peer Manager home page provides an overview of all configured Peer Connections.
Select a connection to launch its Overview window, where you can track the health of each peer connection by viewing the status of individual peering jobs.
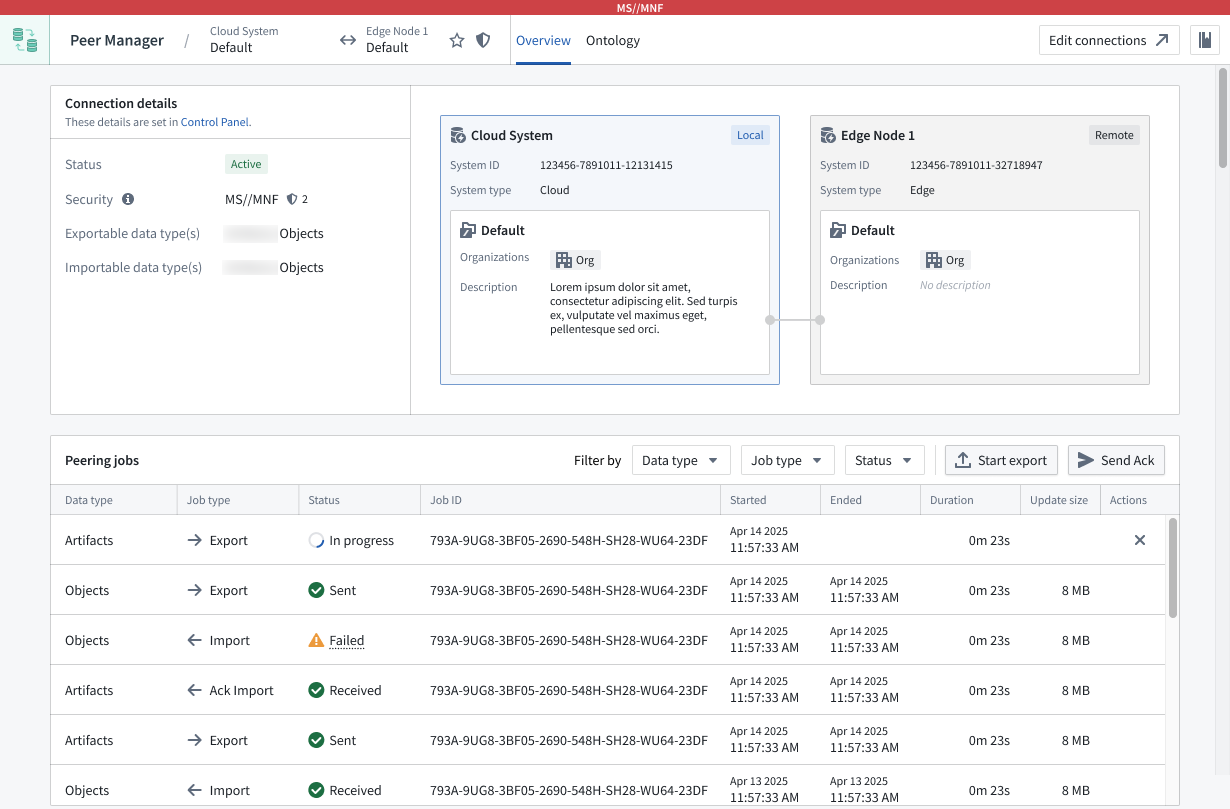
Peer Manager's Overview window offers a unified view of the status and health of peering jobs within a connection.
Select Ontology from the top ribbon to peer objects across an established connection, where Peer Manager enables you to peer all or a selection of properties on the object.
Learn more about object peering in Peer Manager.
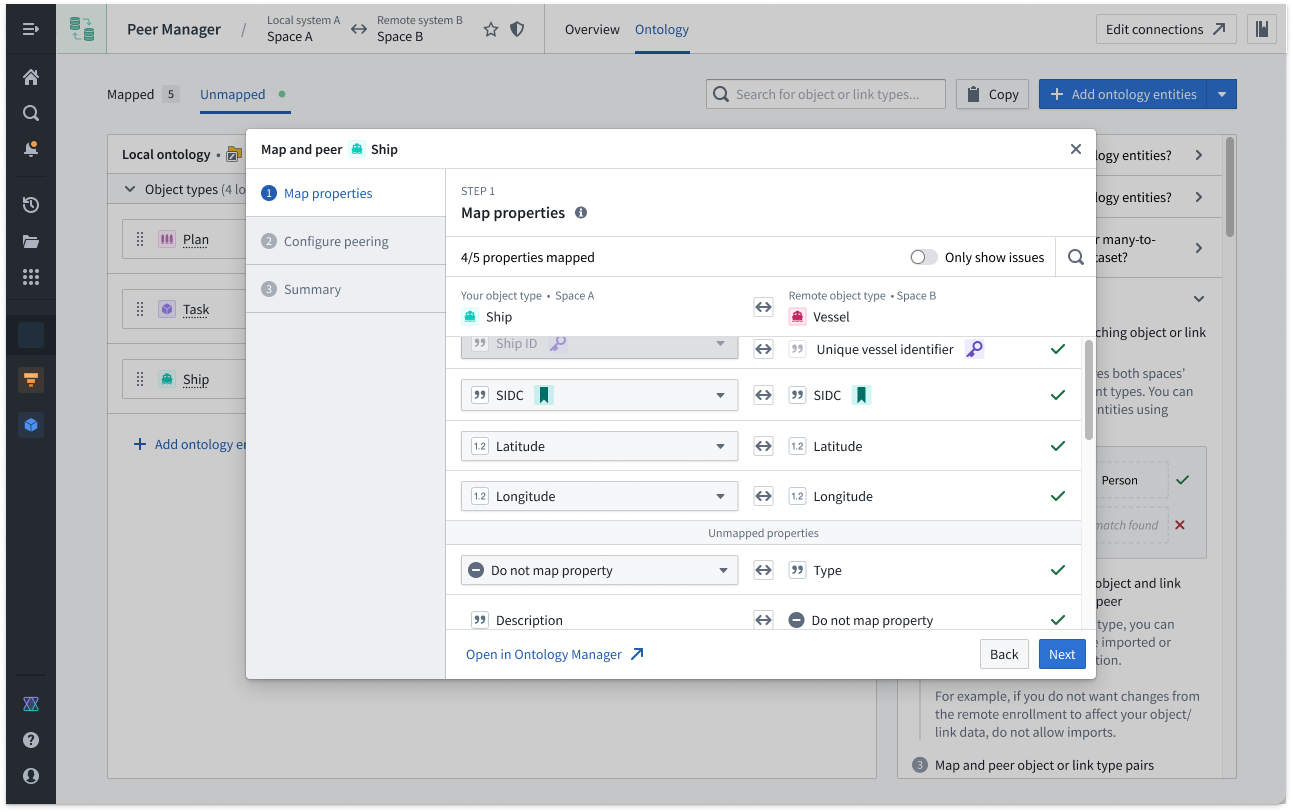
Peer Manager's Ontology window enables you to peer object types and their links across a peer connection.
What's next on the development roadmap?
The ability to configure Artifact peering will be available in Peer Manager by the end of 2025. Contact Palantir Support with questions about peering or Peer Manager on your enrollment.
Use Pipeline Builder external pipelines to push down compute to Databricks
Date published: 2025-11-06
Pipeline Builder now offers the ability to create external pipelines using third-party compute engines, with Databricks as the first supported provider. This capability is in beta.
External pipelines require virtual table inputs and outputs from the same source as your compute. When using external pipelines, compute is orchestrated by Foundry and pushed down to the source system for execution.
Foundry’s external compute orchestration provides you with the flexibility to choose the most appropriate technology for your workload, use case, and architecture requirements. Pipelines built with external compute can also be composed together with Foundry-native compute pipelines using Foundry’s scheduling tools, allowing you to easily orchestrate complex multi-technology pipelines using the exact right compute at every step along the way.
With this improvement, you can now push down compute to Databricks using either code-based Python transforms or point-and-click Pipeline Builder boards. Learn more about creating external pipelines in Pipeline Builder.
Enabling push down compute in Pipeline Builder.
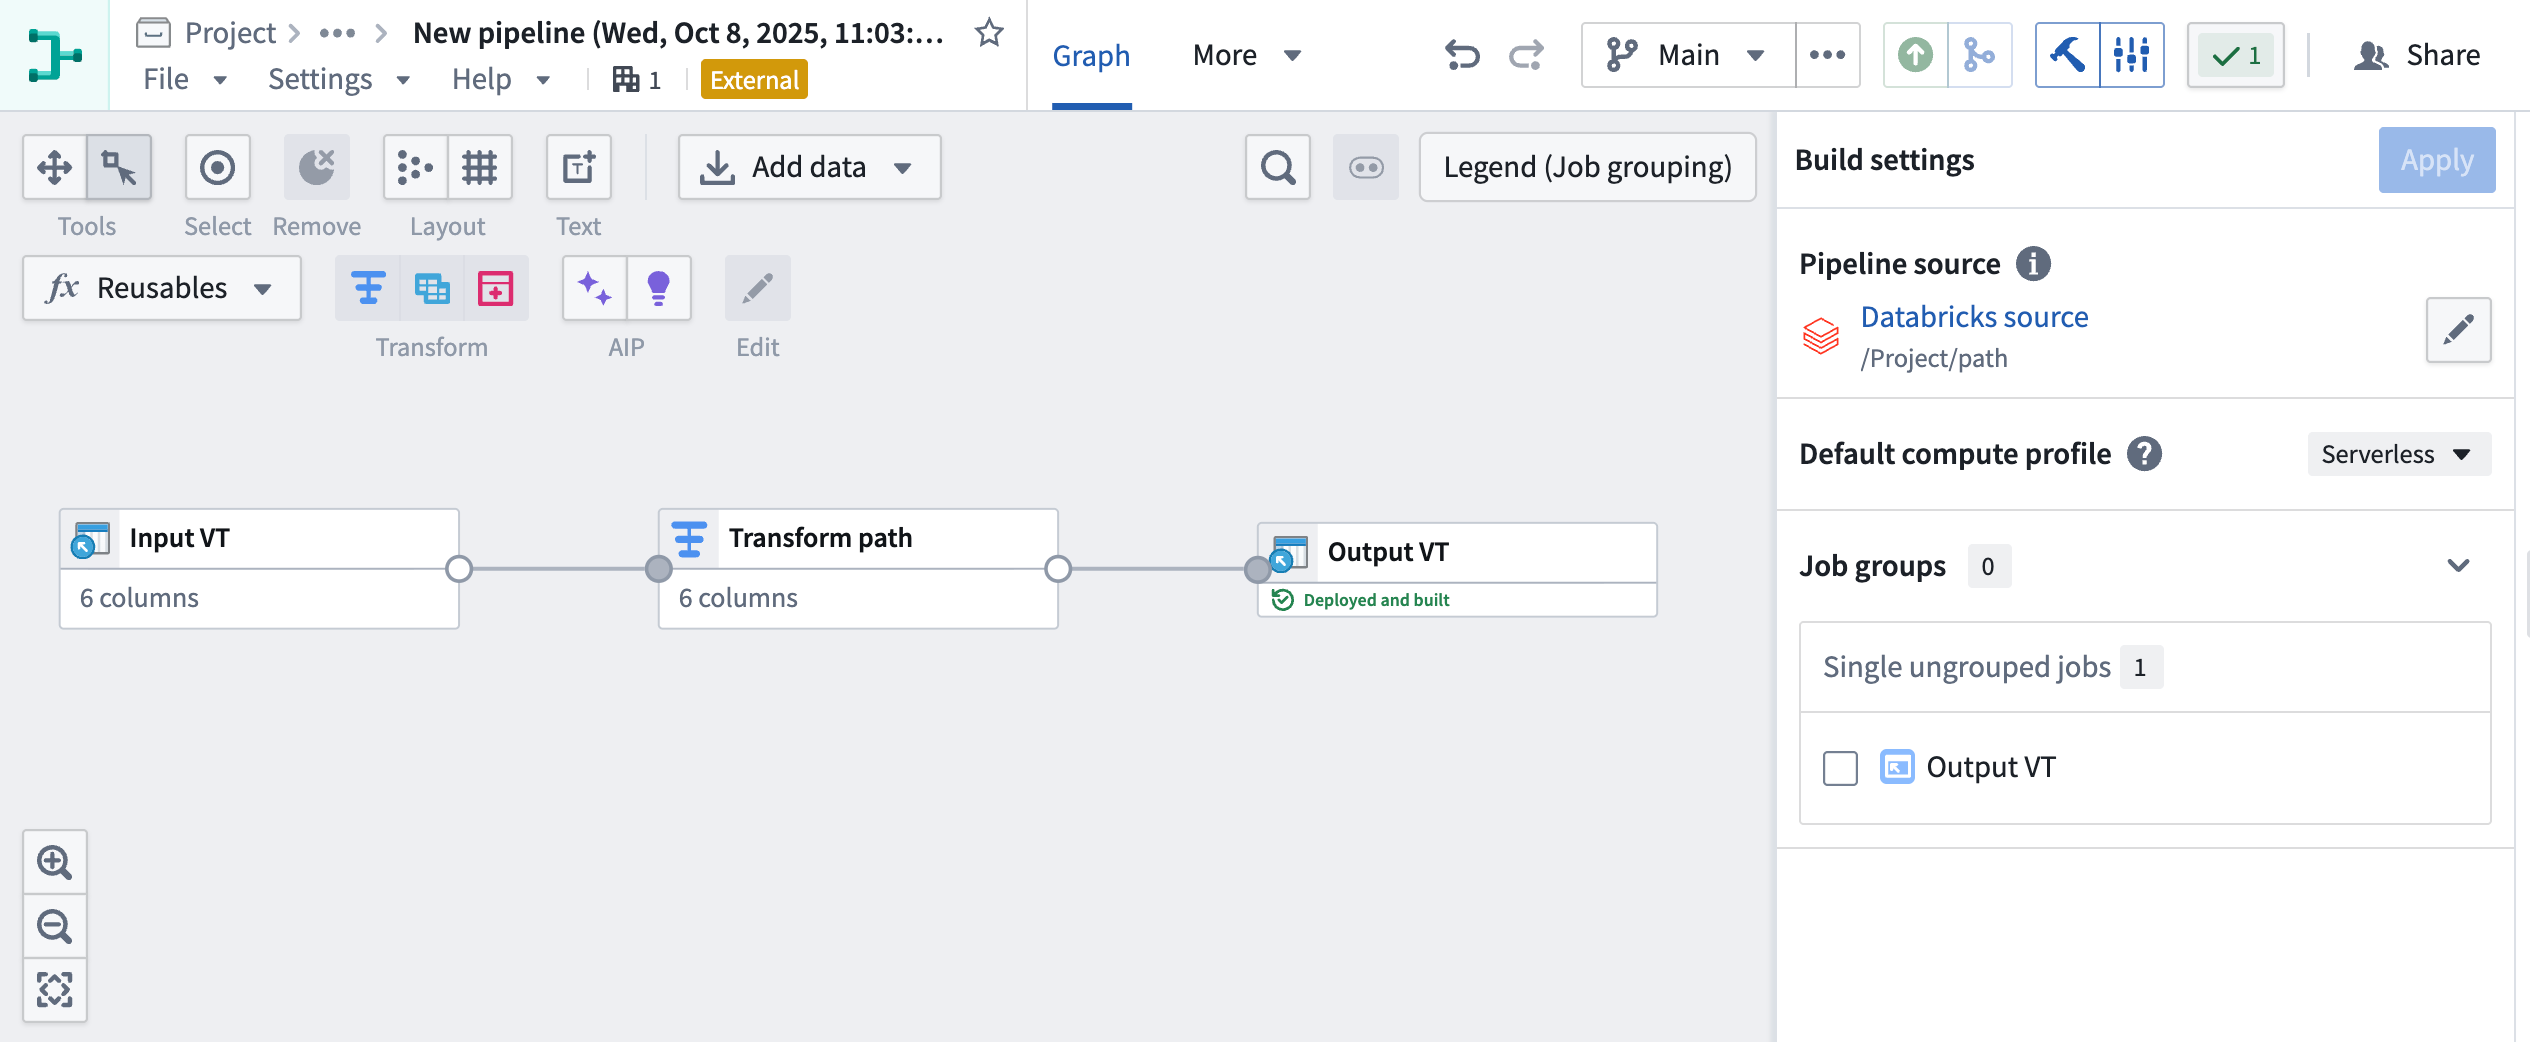
External pipeline with pushdown compute in Pipeline Builder.
Your feedback matters
As we continue to add features to Pipeline Builder, we want to hear about your experiences and welcome your feedback. Share your thoughts with Palantir Support channels or our Developer Community ↗ using the pipeline-builder tag ↗.
Import Iceberg and Delta virtual tables into Code Workspaces
Date published: 2025-11-06
Iceberg ↗ and Delta ↗ tables can now be imported as virtual tables into JupyterLab® code workspaces, providing more flexibility when working with externally stored data at large scales. Delta and Iceberg tables are open source table formats that enable reliable, scalable, and efficient management of large datasets, including tables stored in Databricks.
JupyterLab® code workspaces now support read and write capabilities for Iceberg and Delta tables, and provide table-specific code snippets in the Data panel to facilitate development.
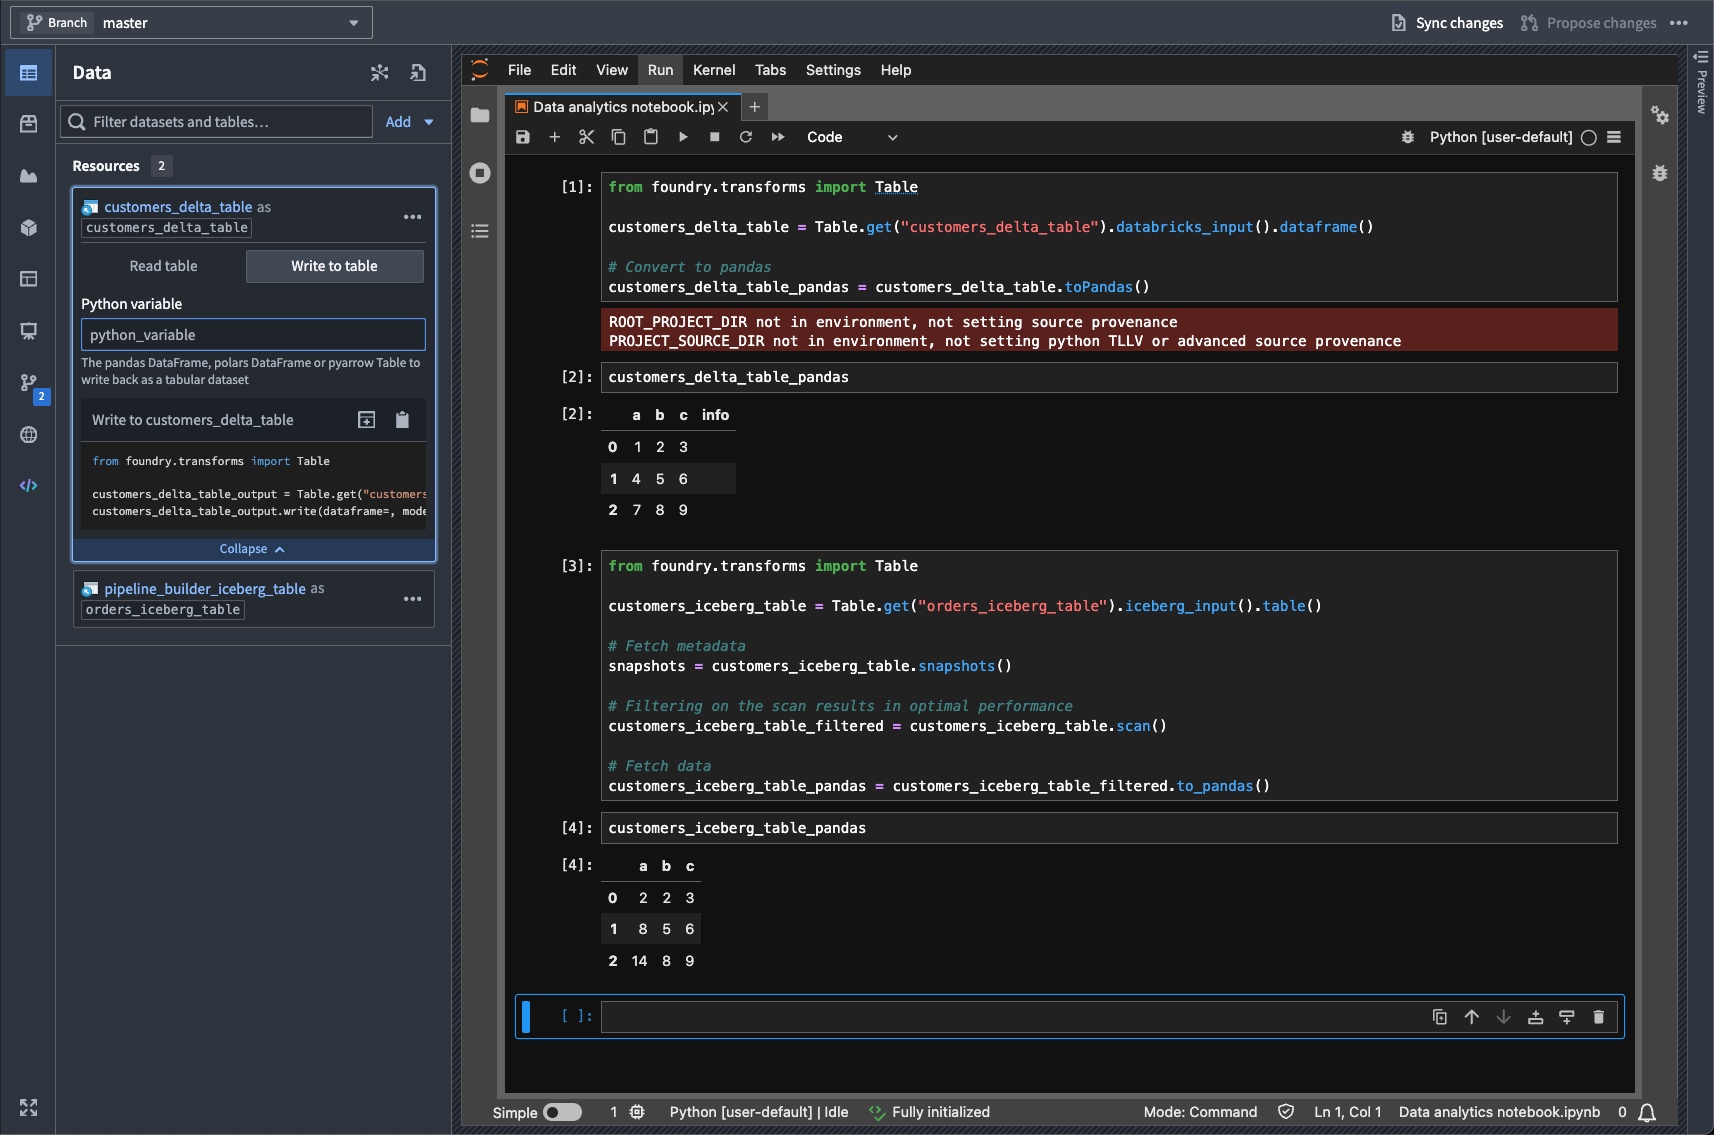
A highlighted code snippet in the Data panel.
This feature enables running interactive Python notebooks against data stored and cataloged externally to Foundry in Iceberg and Delta tables, supporting a wide range of data science, analytics, and machine learning workflows.
Learn more about virtual tables and Code Workspaces.
Jupyter®, JupyterLab®, and the Jupyter® logos are trademarks or registered trademarks of NumFOCUS. All third-party trademarks (including logos and icons) referenced remain the property of their respective owners. No affiliation or endorsement is implied.
Roll back datasets and queue snapshots in Data Lineage
Date published: 2025-11-04
Dataset rollback is now available in Data Lineage, giving you greater control over your data pipelines. Whether you encounter an outage, errors in your pipeline logic, or unexpected upstream data, dataset rollback provides a fast, reliable way to revert your datasets to a stable state. In addition, you can now queue snapshots, allowing datasets to snapshot automatically on their next build.
Dataset rollbacks provide several key benefits:
- Quickly revert to an earlier version of your dataset.
- Preserve incremental build workflows.
- Recover from data issues or outages.
Roll back a dataset
To get started with dataset rollback, open your dataset in Data Lineage and select a previous successful transaction in the History tab. You can roll back your dataset to that transaction by selecting Roll back to transaction.
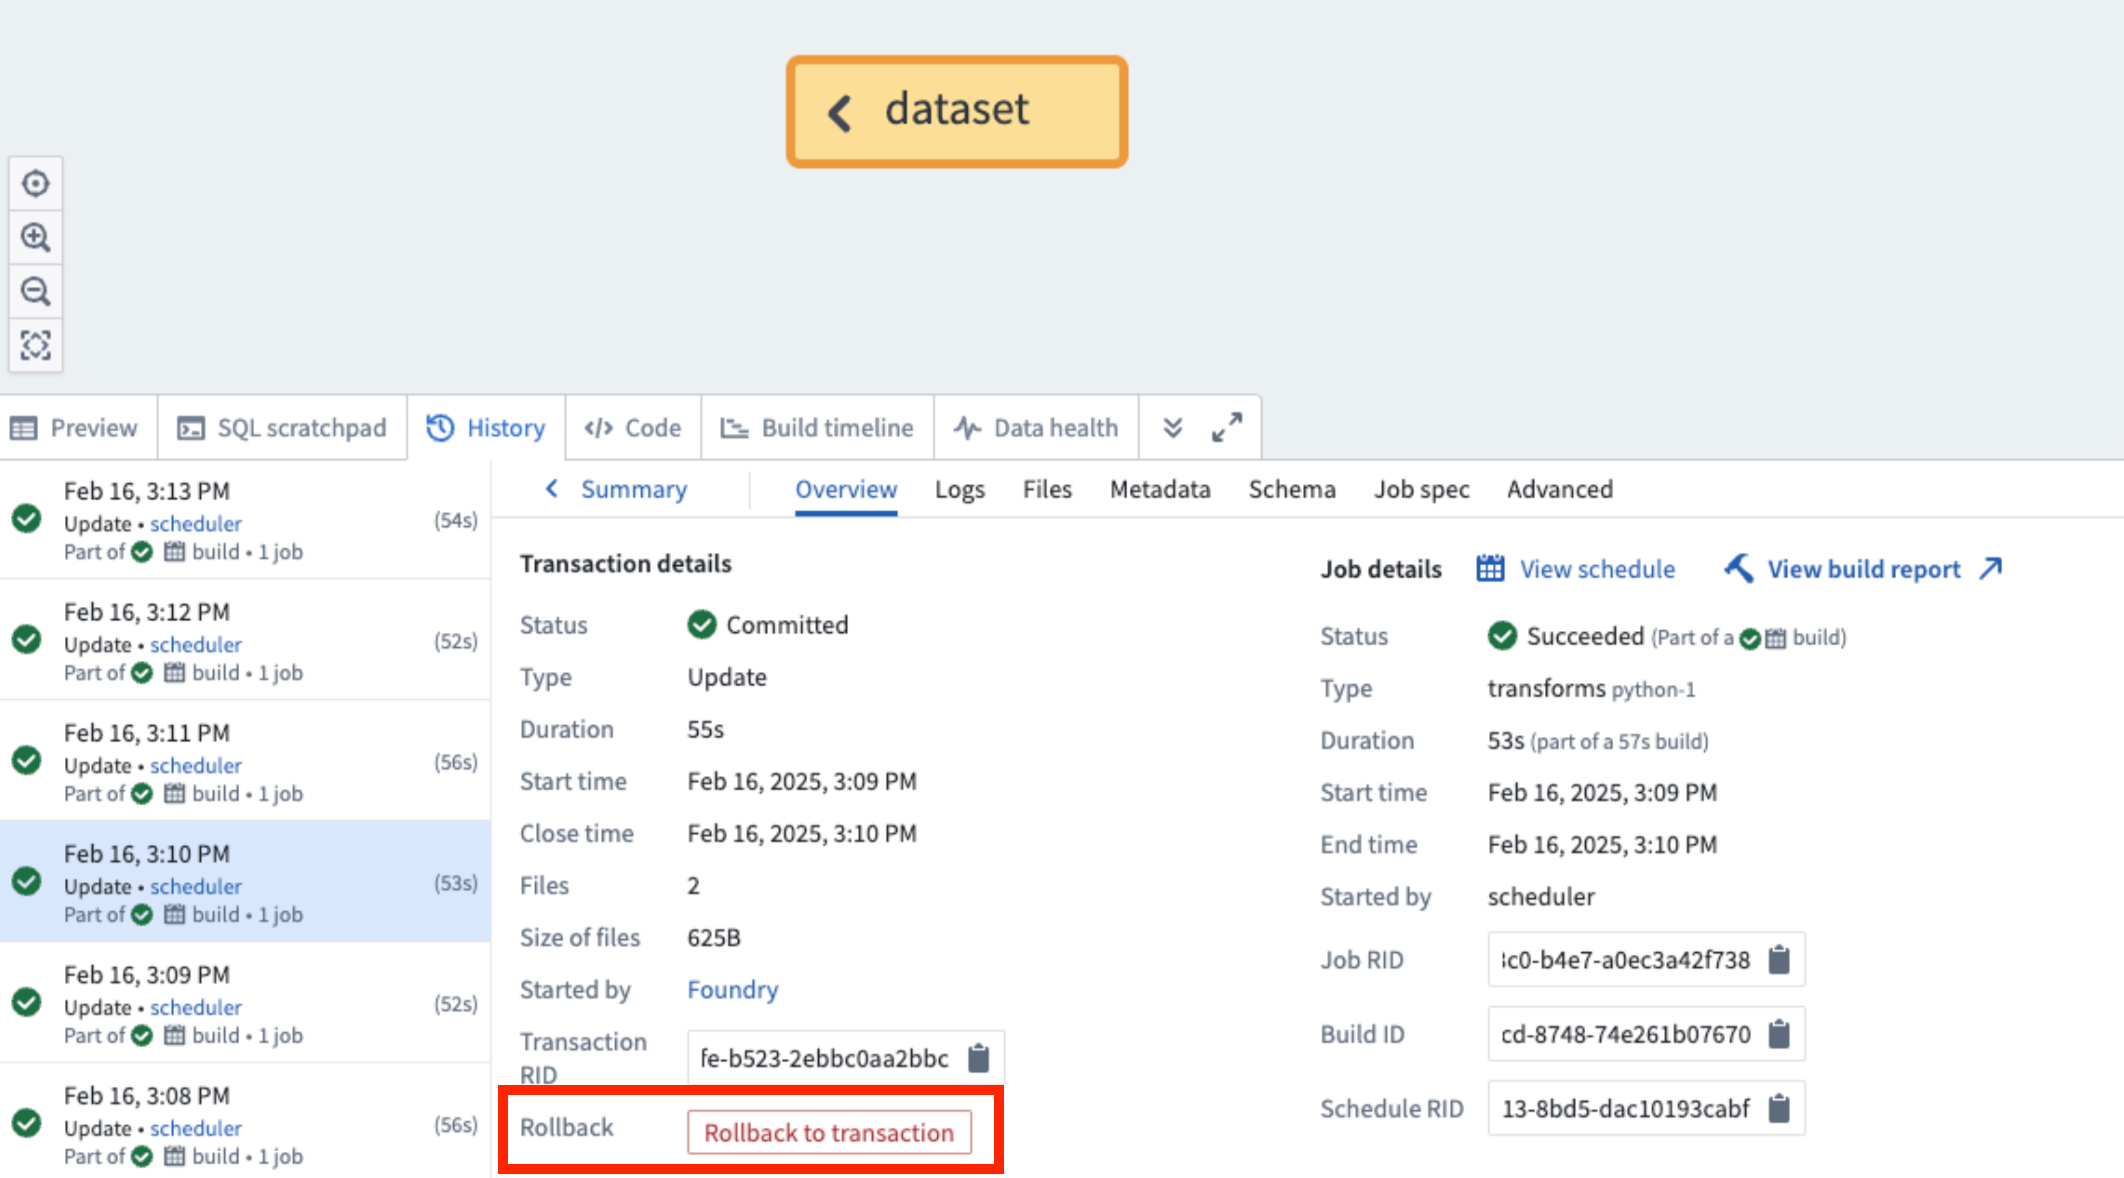
The Roll back to transaction option, listed in a selected transaction's Overview tab.
Snapshot on next build
To queue a snapshot on your dataset's next build, open a dataset in Data Lineage and select Force snapshot In the History tab in the bottom panel.
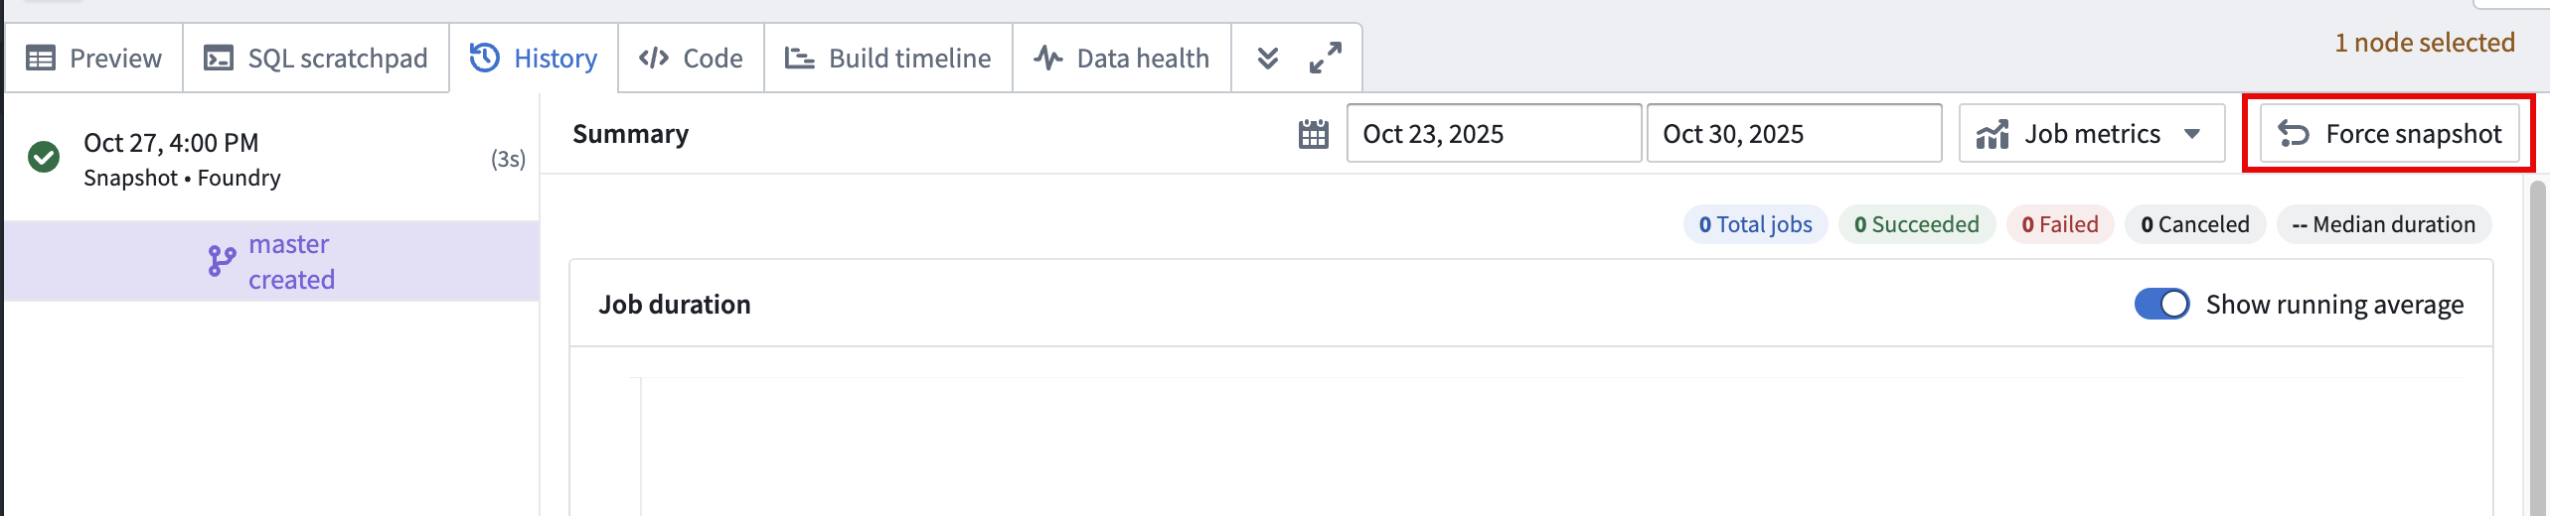
The Force snapshot option in the History tab.
Note that you will need to acknowledge that this action cannot be undone before proceeding.
Important considerations
- Only users with the
Editorrole can perform rollbacks to ensure secure operations. - Rollbacks are only supported on transactional datasets, and you can only roll back to successful transactions.
- It is not possible to roll back to a transaction that was deleted based on a retention policy. However, you can roll back to a transaction that was deleted by a dataset rollback in Data Lineage.
- If your dataset backs an object type in object storage v2, you will need to reindex after rolling back.
Dataset rollback allows you to build, experiment, and iterate on your pipelines with confidence; the ability to revert to a stable state is available whenever you need it.
Your feedback matters
We want to hear about your experience and welcome your feedback as we develop more features in Data Lineage. Share your thoughts with Palantir Support channels or on our Developer Community ↗ using the data-lineage tag ↗.
Learn more about dataset rollback.
Flexible rebasing and conflict resolution in Ontology Manager
Date published: 2025-11-04
Ontology Manager now offers an improved rebasing and conflict resolution experience that gives you greater flexibility and control when managing branch changes. You can now rebase at any point without creating a proposal, view changes from both Main and your branch simultaneously, and resolve merge conflicts using multiple approaches—either through the Conflicts tab in the Save dialog or directly in the Ontology Manager interface for conflict resolution. This enhanced workflow prevents situations where unresolvable errors block your progress. This feature is available the week of November 3 across all enrollments.
Visit the documentation on testing changes in the ontology.
What is rebasing?
While you introduce changes on your branch, Main can also update with new changes made by others. Rebasing incorporates the latest changes from Main into your current branch to keep it up to date.
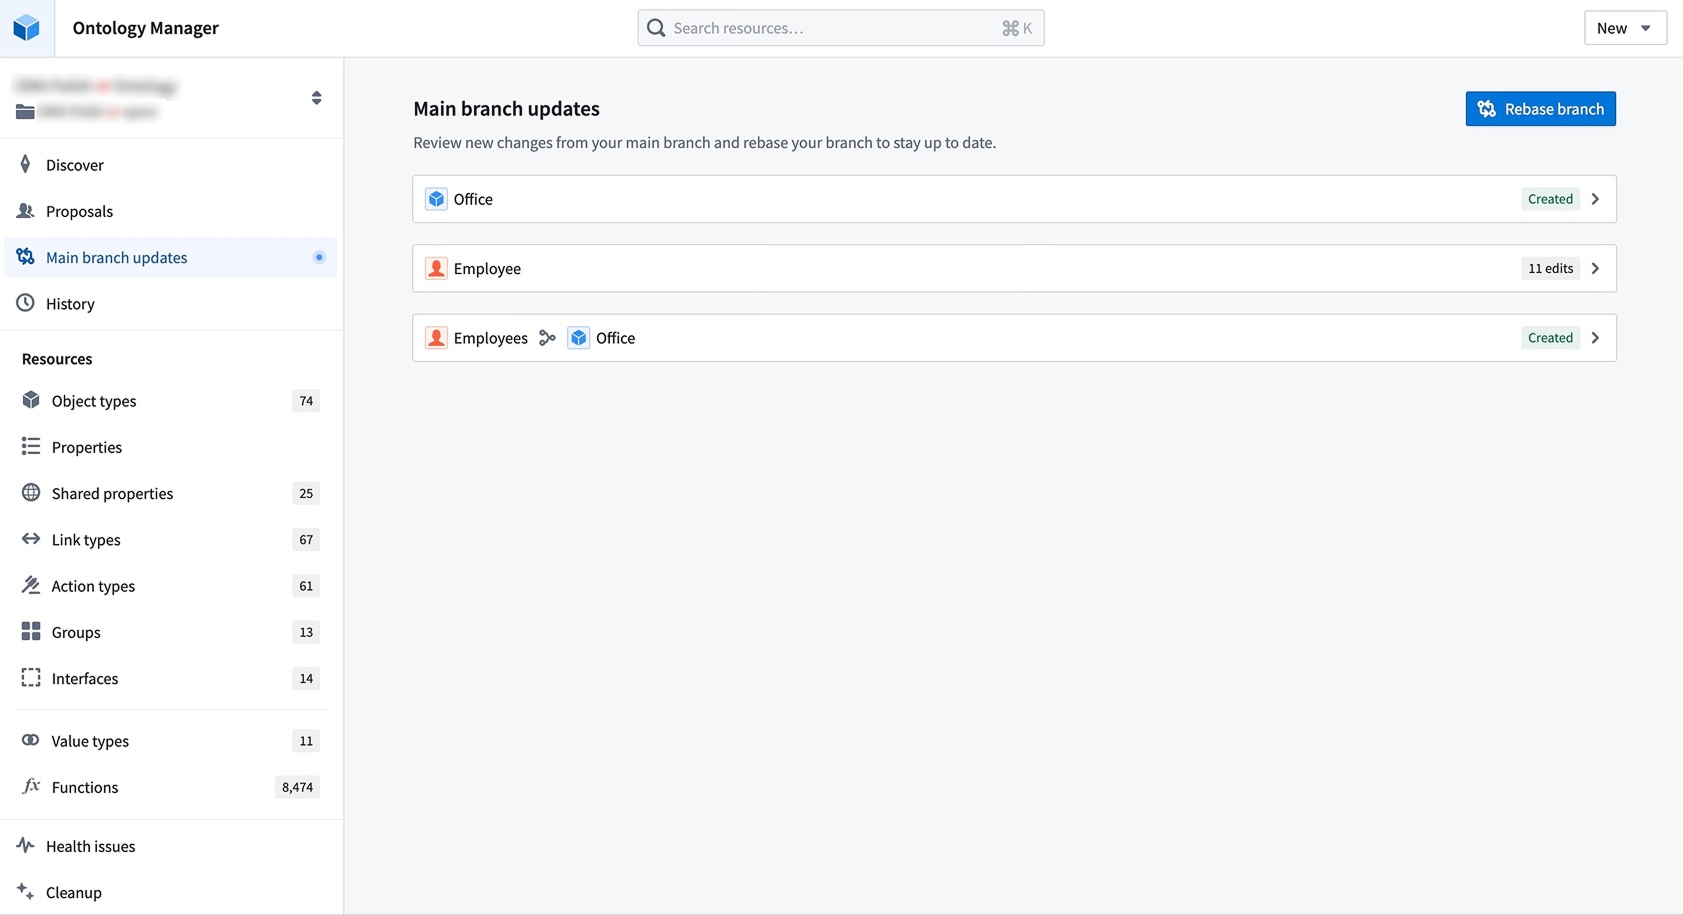
Resolve merge conflicts by choosing between changes from Main or your current branch directly in Ontology Manager.
During a rebase, Ontology Manager enters a new state where you can view and access changes from both Main and your branch. You may resolve merge conflicts by choosing between changes from Main or your current branch from the Conflicts tab in the save dialog. Alternatively, you can resolve conflicts by editing the ontology resource directly. This flexibility prevents situations where users become stuck due to unresolvable errors after conflict resolution.
Known limitations
Complex cases of schema migrations or datasource replacements are not yet handled by this rebasing experience. Refer to the known limitations section of the documentation for an alternative solution. We are actively working to resolve these limitations.
We want to hear from you
As we continue to develop new features for Foundry Branching, we want to hear about your experiences and welcome your feedback. Share your thoughts with Palantir Support channels or our Developer Community ↗ and use the foundry-branching ↗ tag.
Package widget sets automatically with Marketplace products
Date published: 2025-11-04
Widget sets created in Custom Widgets can now be included as content in Marketplace products.
When you add a Workshop module that uses a widget set to a Marketplace product, the widget set is automatically packaged. Widget sets can also be manually packaged independently, allowing you to build Workshop modules on top of them.
If a widget set had Ontology API access enabled in the source environment, it will be installed with access disabled by default. After installation, you must manually enable Ontology API access on the widget set if needed.
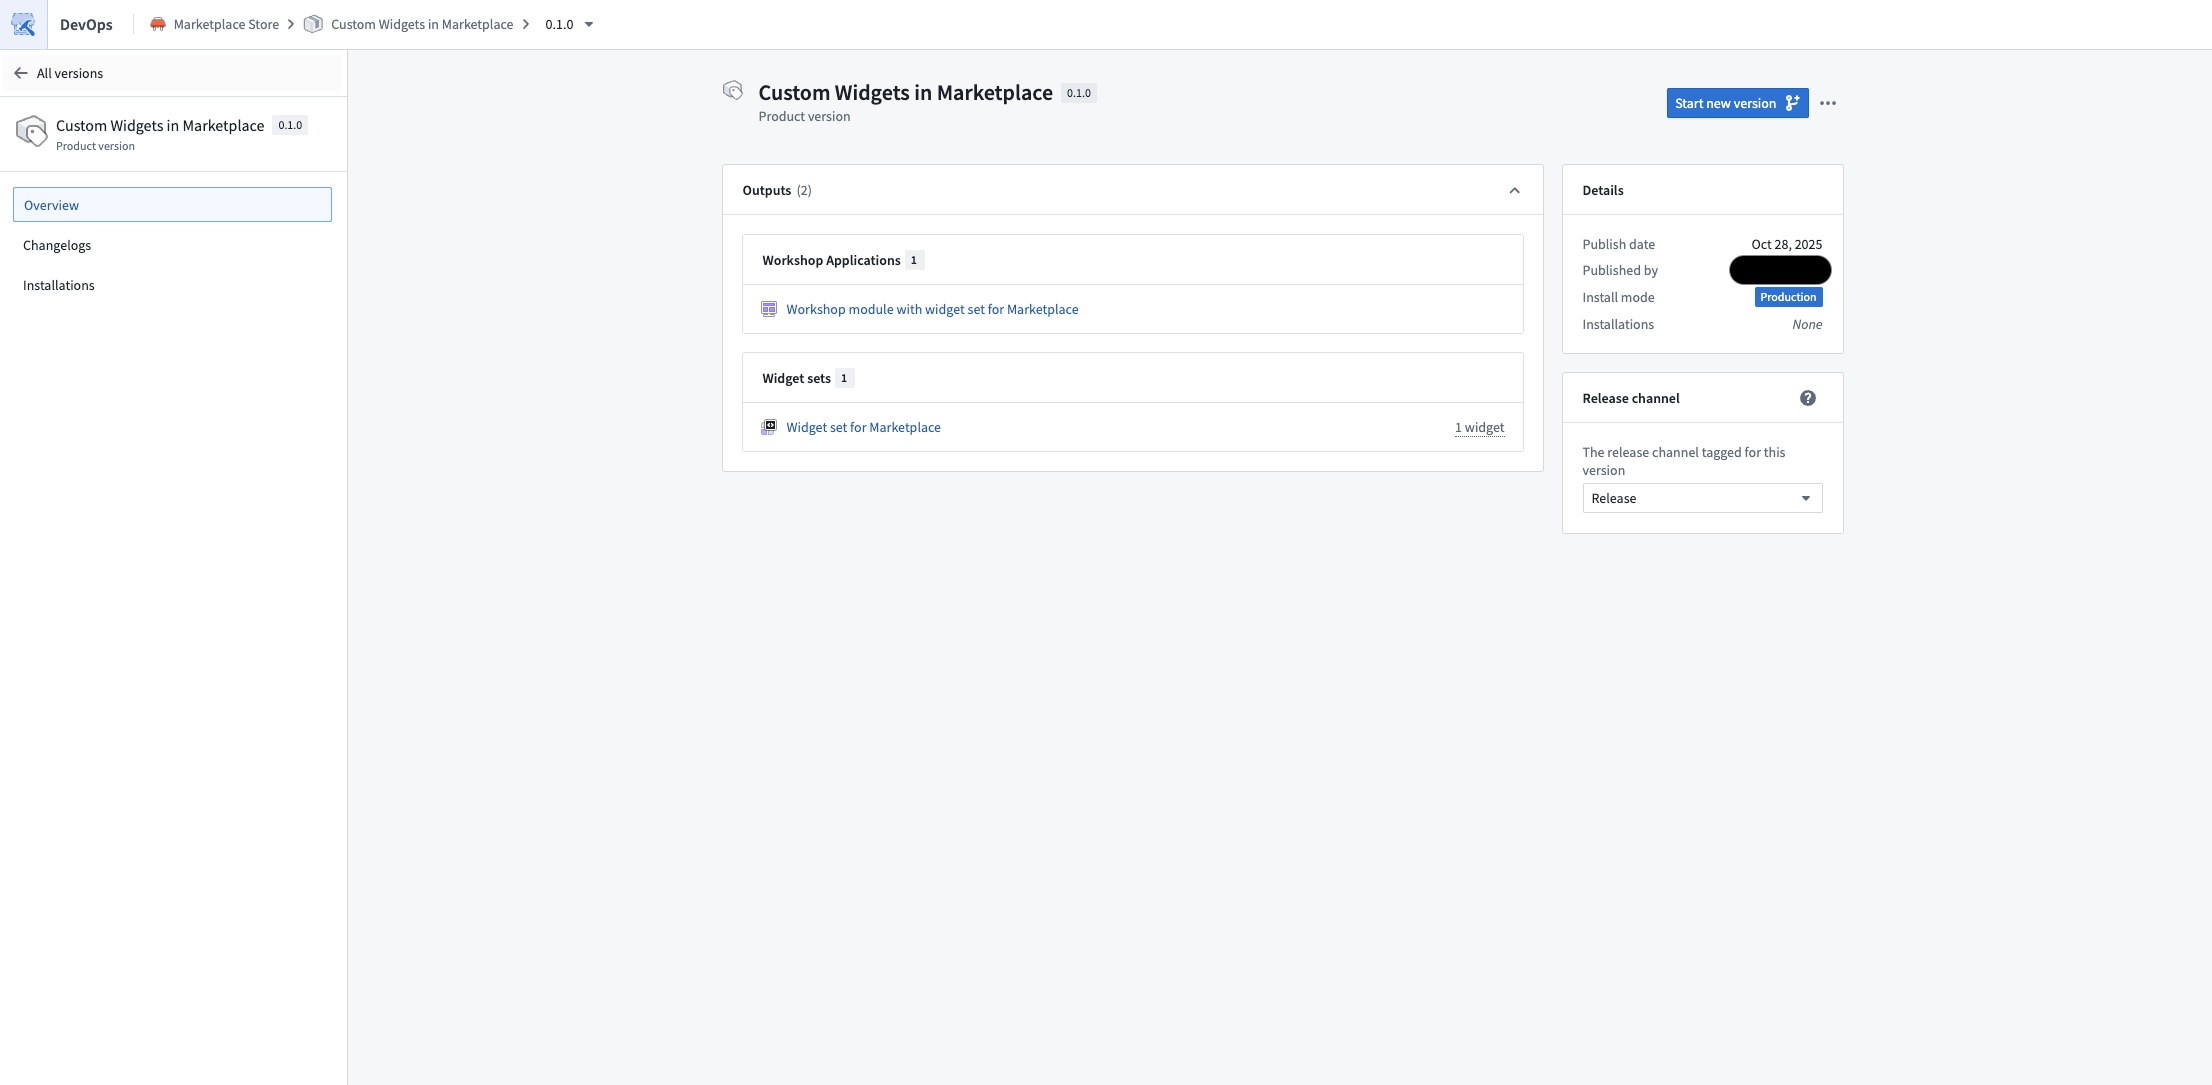
Published Marketplace product containing a Workshop module that uses a widget set.
We want to hear from you
As we continue to develop new features for custom widgets, we want to hear about your experiences and welcome your feedback. Share your thoughts with Palantir Support channels or our Developer Community ↗ and use the custom-widgets ↗ tag.