- Capabilities
- Getting started
- Architecture center
- Platform updates
Analyze run results
Run results show how your functions performed against test cases and evaluation criteria. Result views are available in the AIP Evals application or the integrated AIP Evals sidebar in AIP Logic and AIP Agent Studio.
If you have configured pass criteria on your evaluators, AIP Evals will automatically determine a Passed or Failed status for each test case. The results page displays the overall pass percentage across all test cases.
Test case debug view
In some cases, you may want to investigate a specific test case result further. For these cases, the debug view is available. This view provides execution traces, input/output data, and error messages for individual test cases so you can understand your function outputs and evaluator results.
Access the debug view
There are multiple ways to open the debug view for a test case. You can do it from AIP Evals, AIP Logic, or AIP Agent Studio.
In AIP Evals
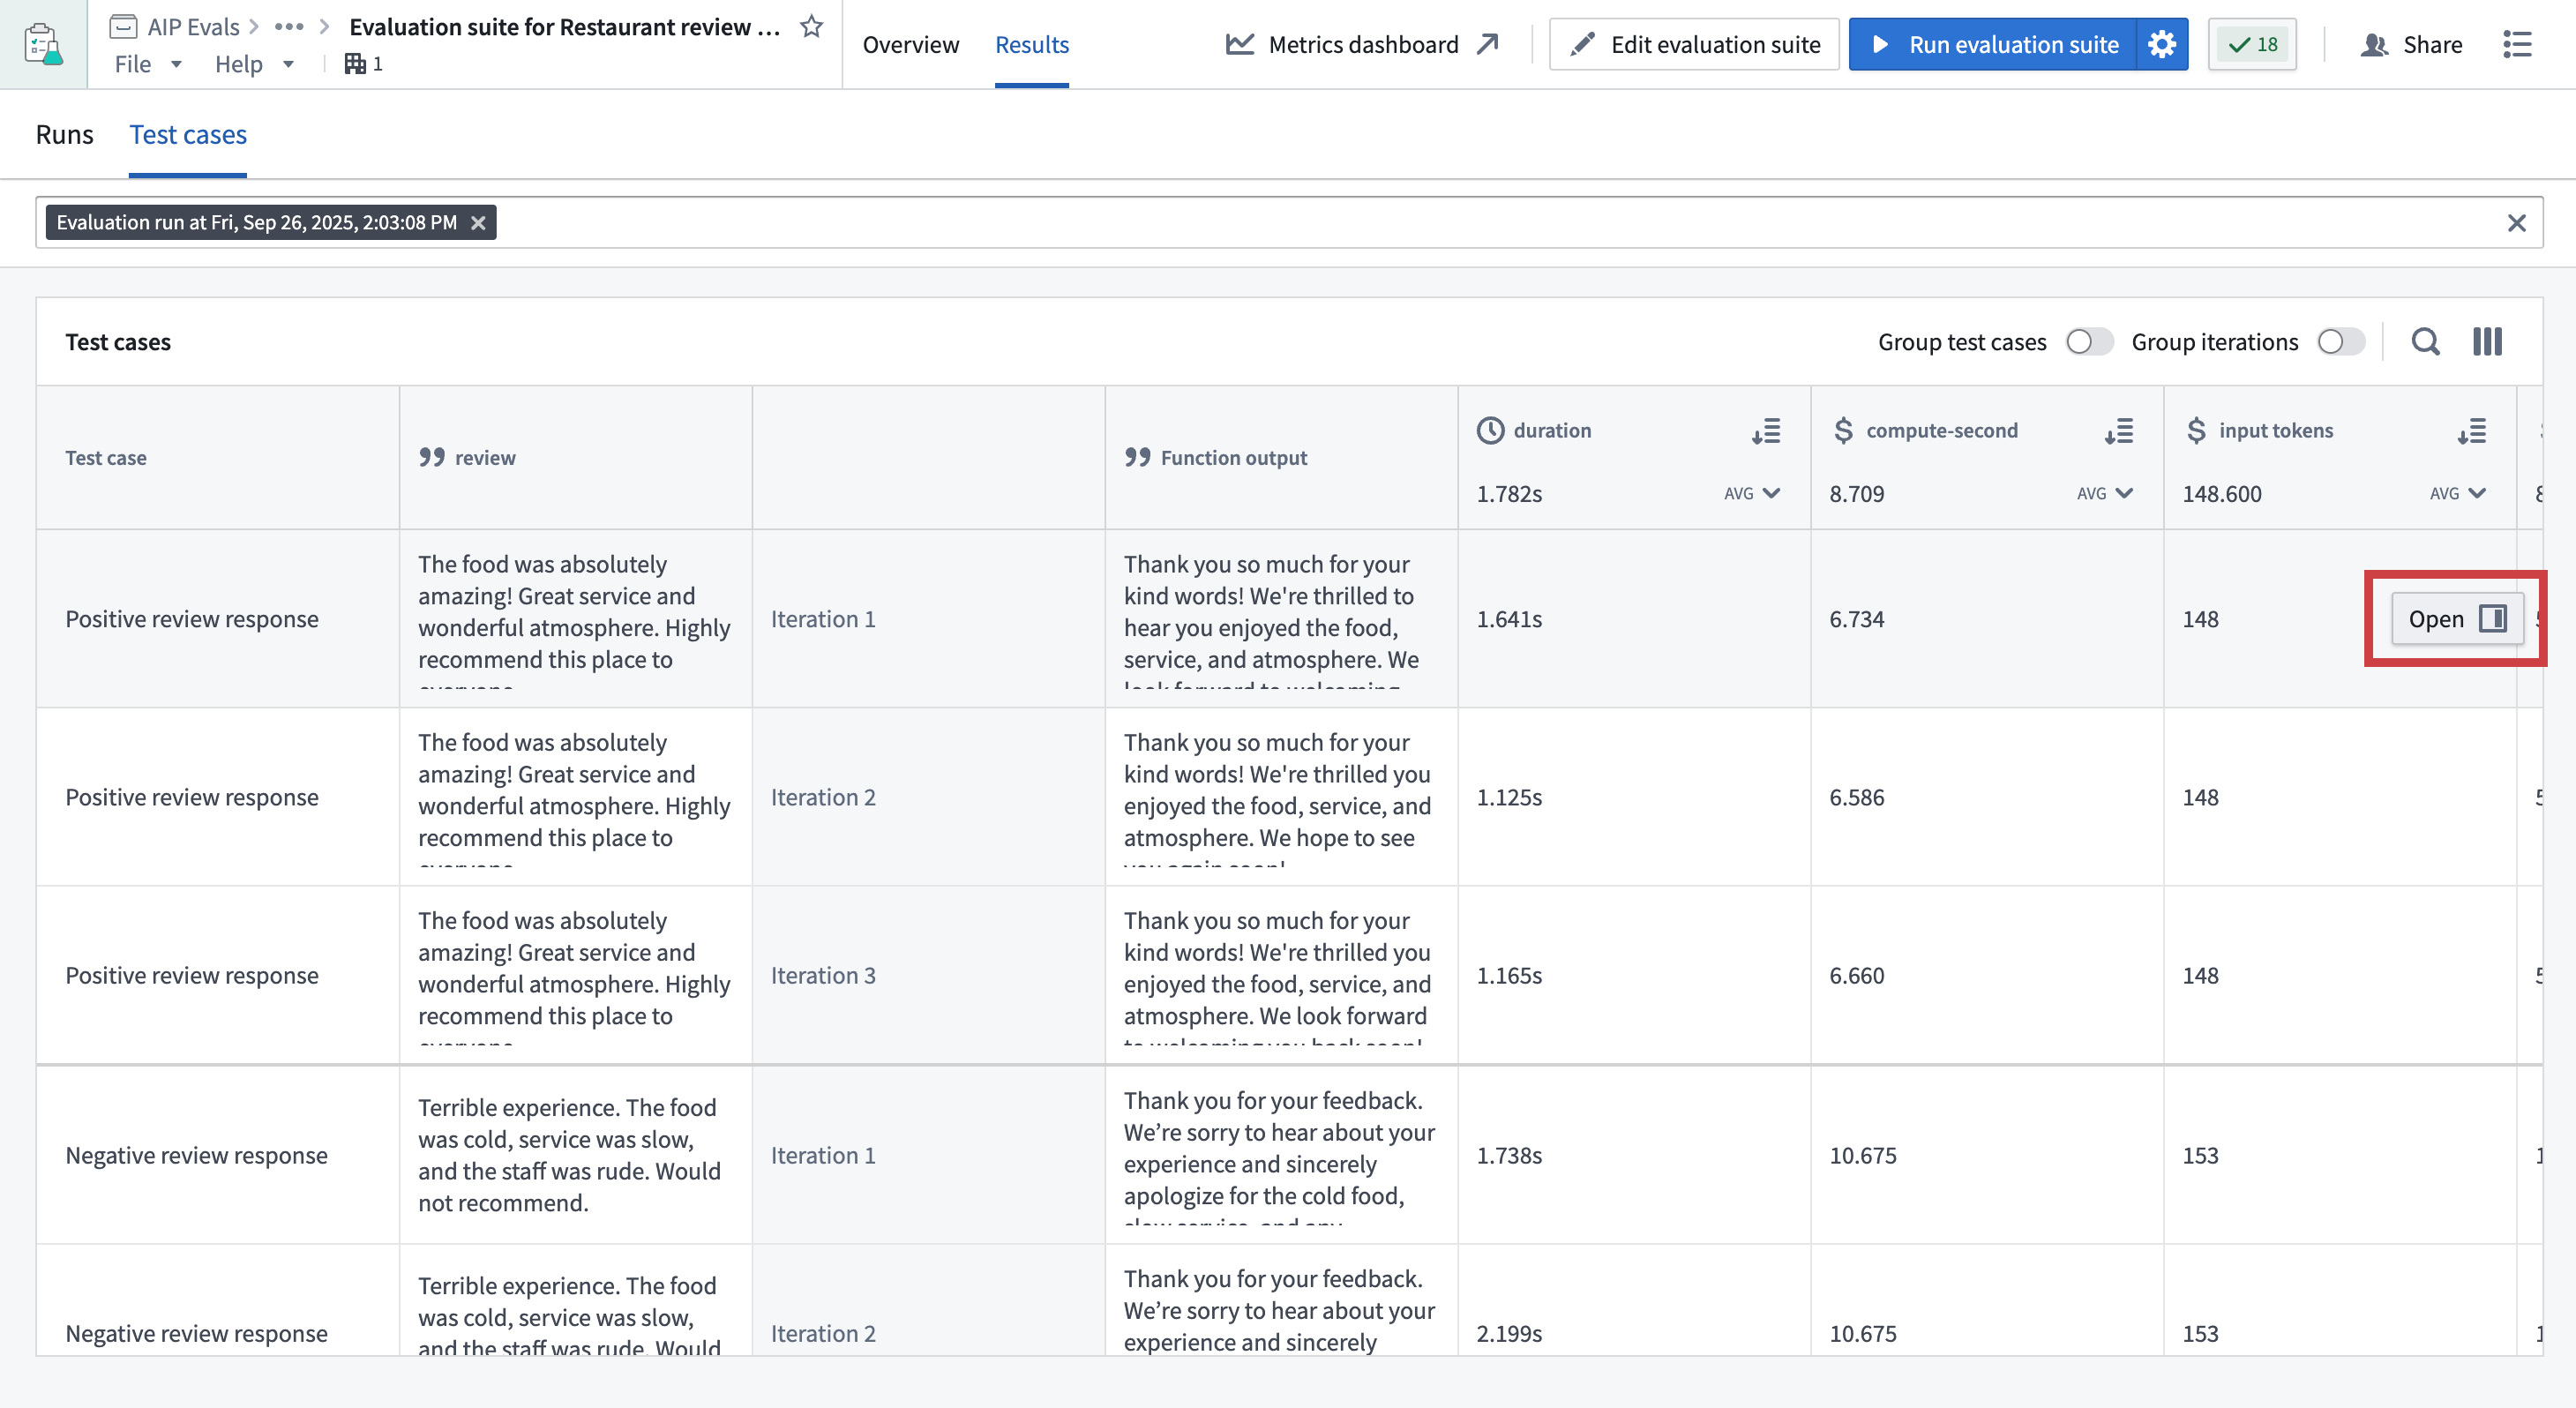
- Open the Results tab on your evaluation suite page.
- Select a run and switch to Test cases.
- Hover over a test case result.
- Select the Open option that appears in the right side of the test case row.
In AIP Logic or AIP Agent Studio
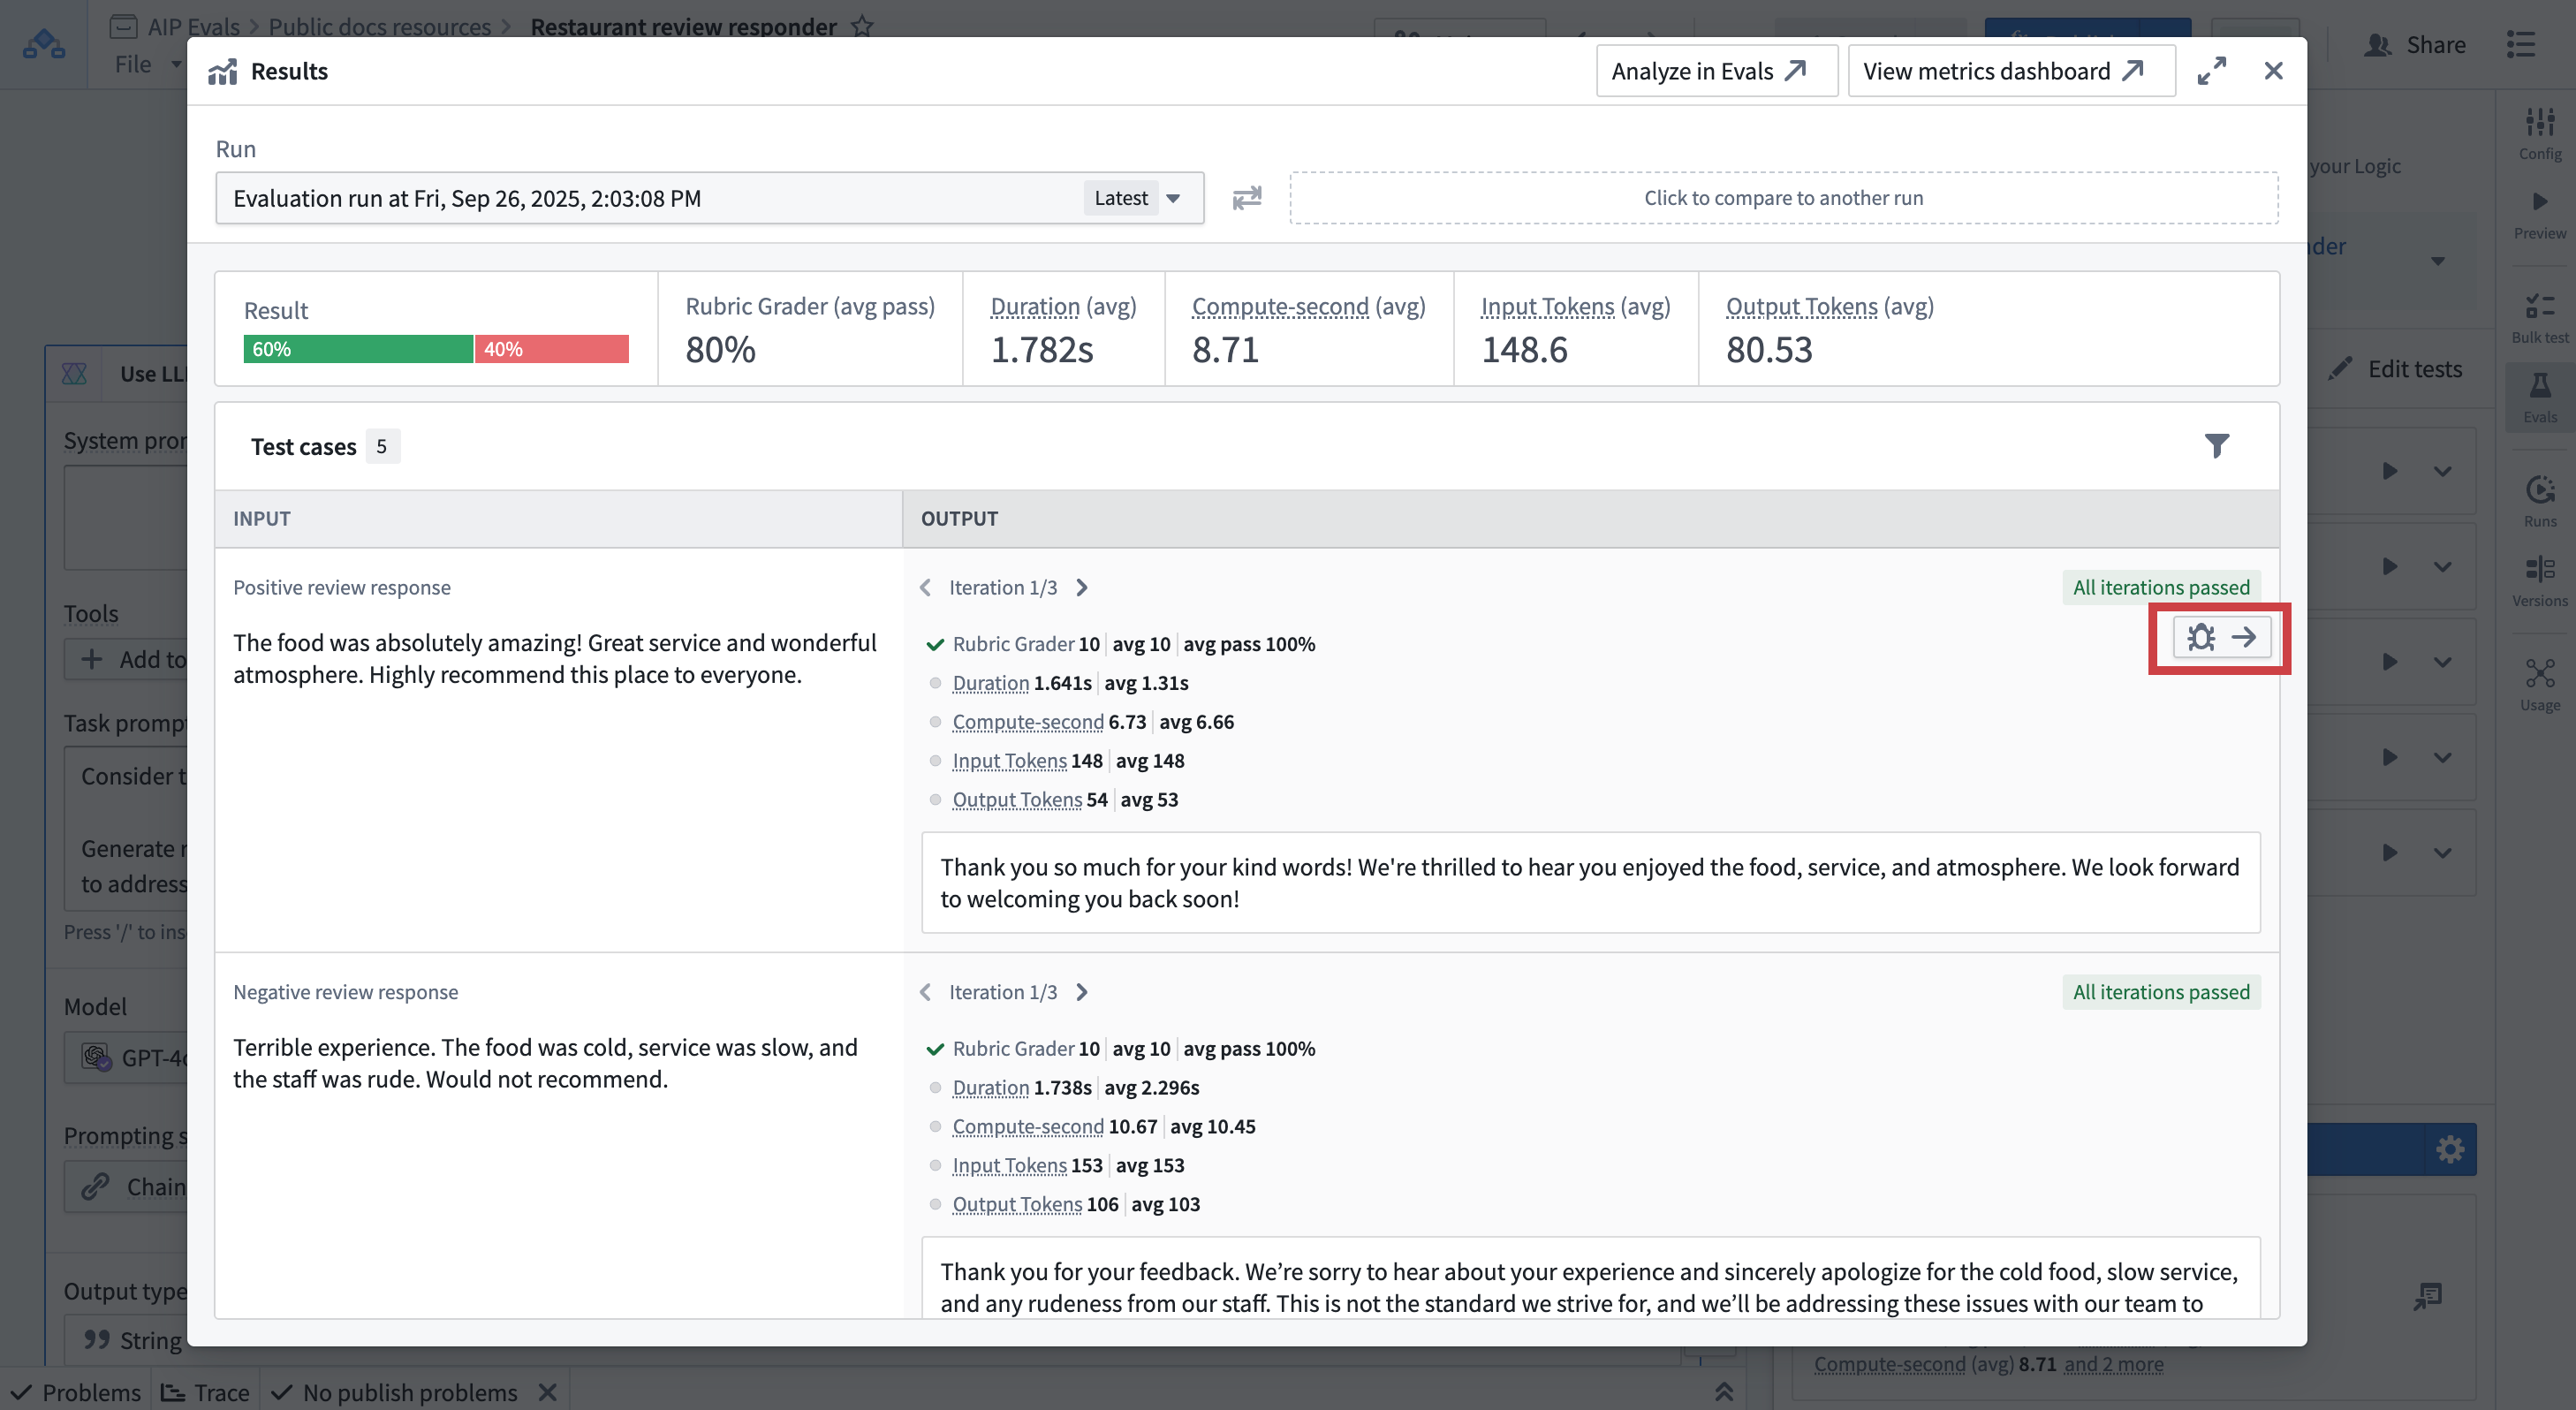
- In the run results dialog view, hover over a test case result.
- Select the Debugger option that appears in the top-right corner of the test case card.
- The debug view will open, showing detailed execution information.
Debug view capabilities
The debug view provides detailed information about test function execution and evaluator results. It allows you to:
- Inspect test function inputs and outputs for a test case.
- TypeScript/Python functions: Access syntax-highlighted code preview of executed code.
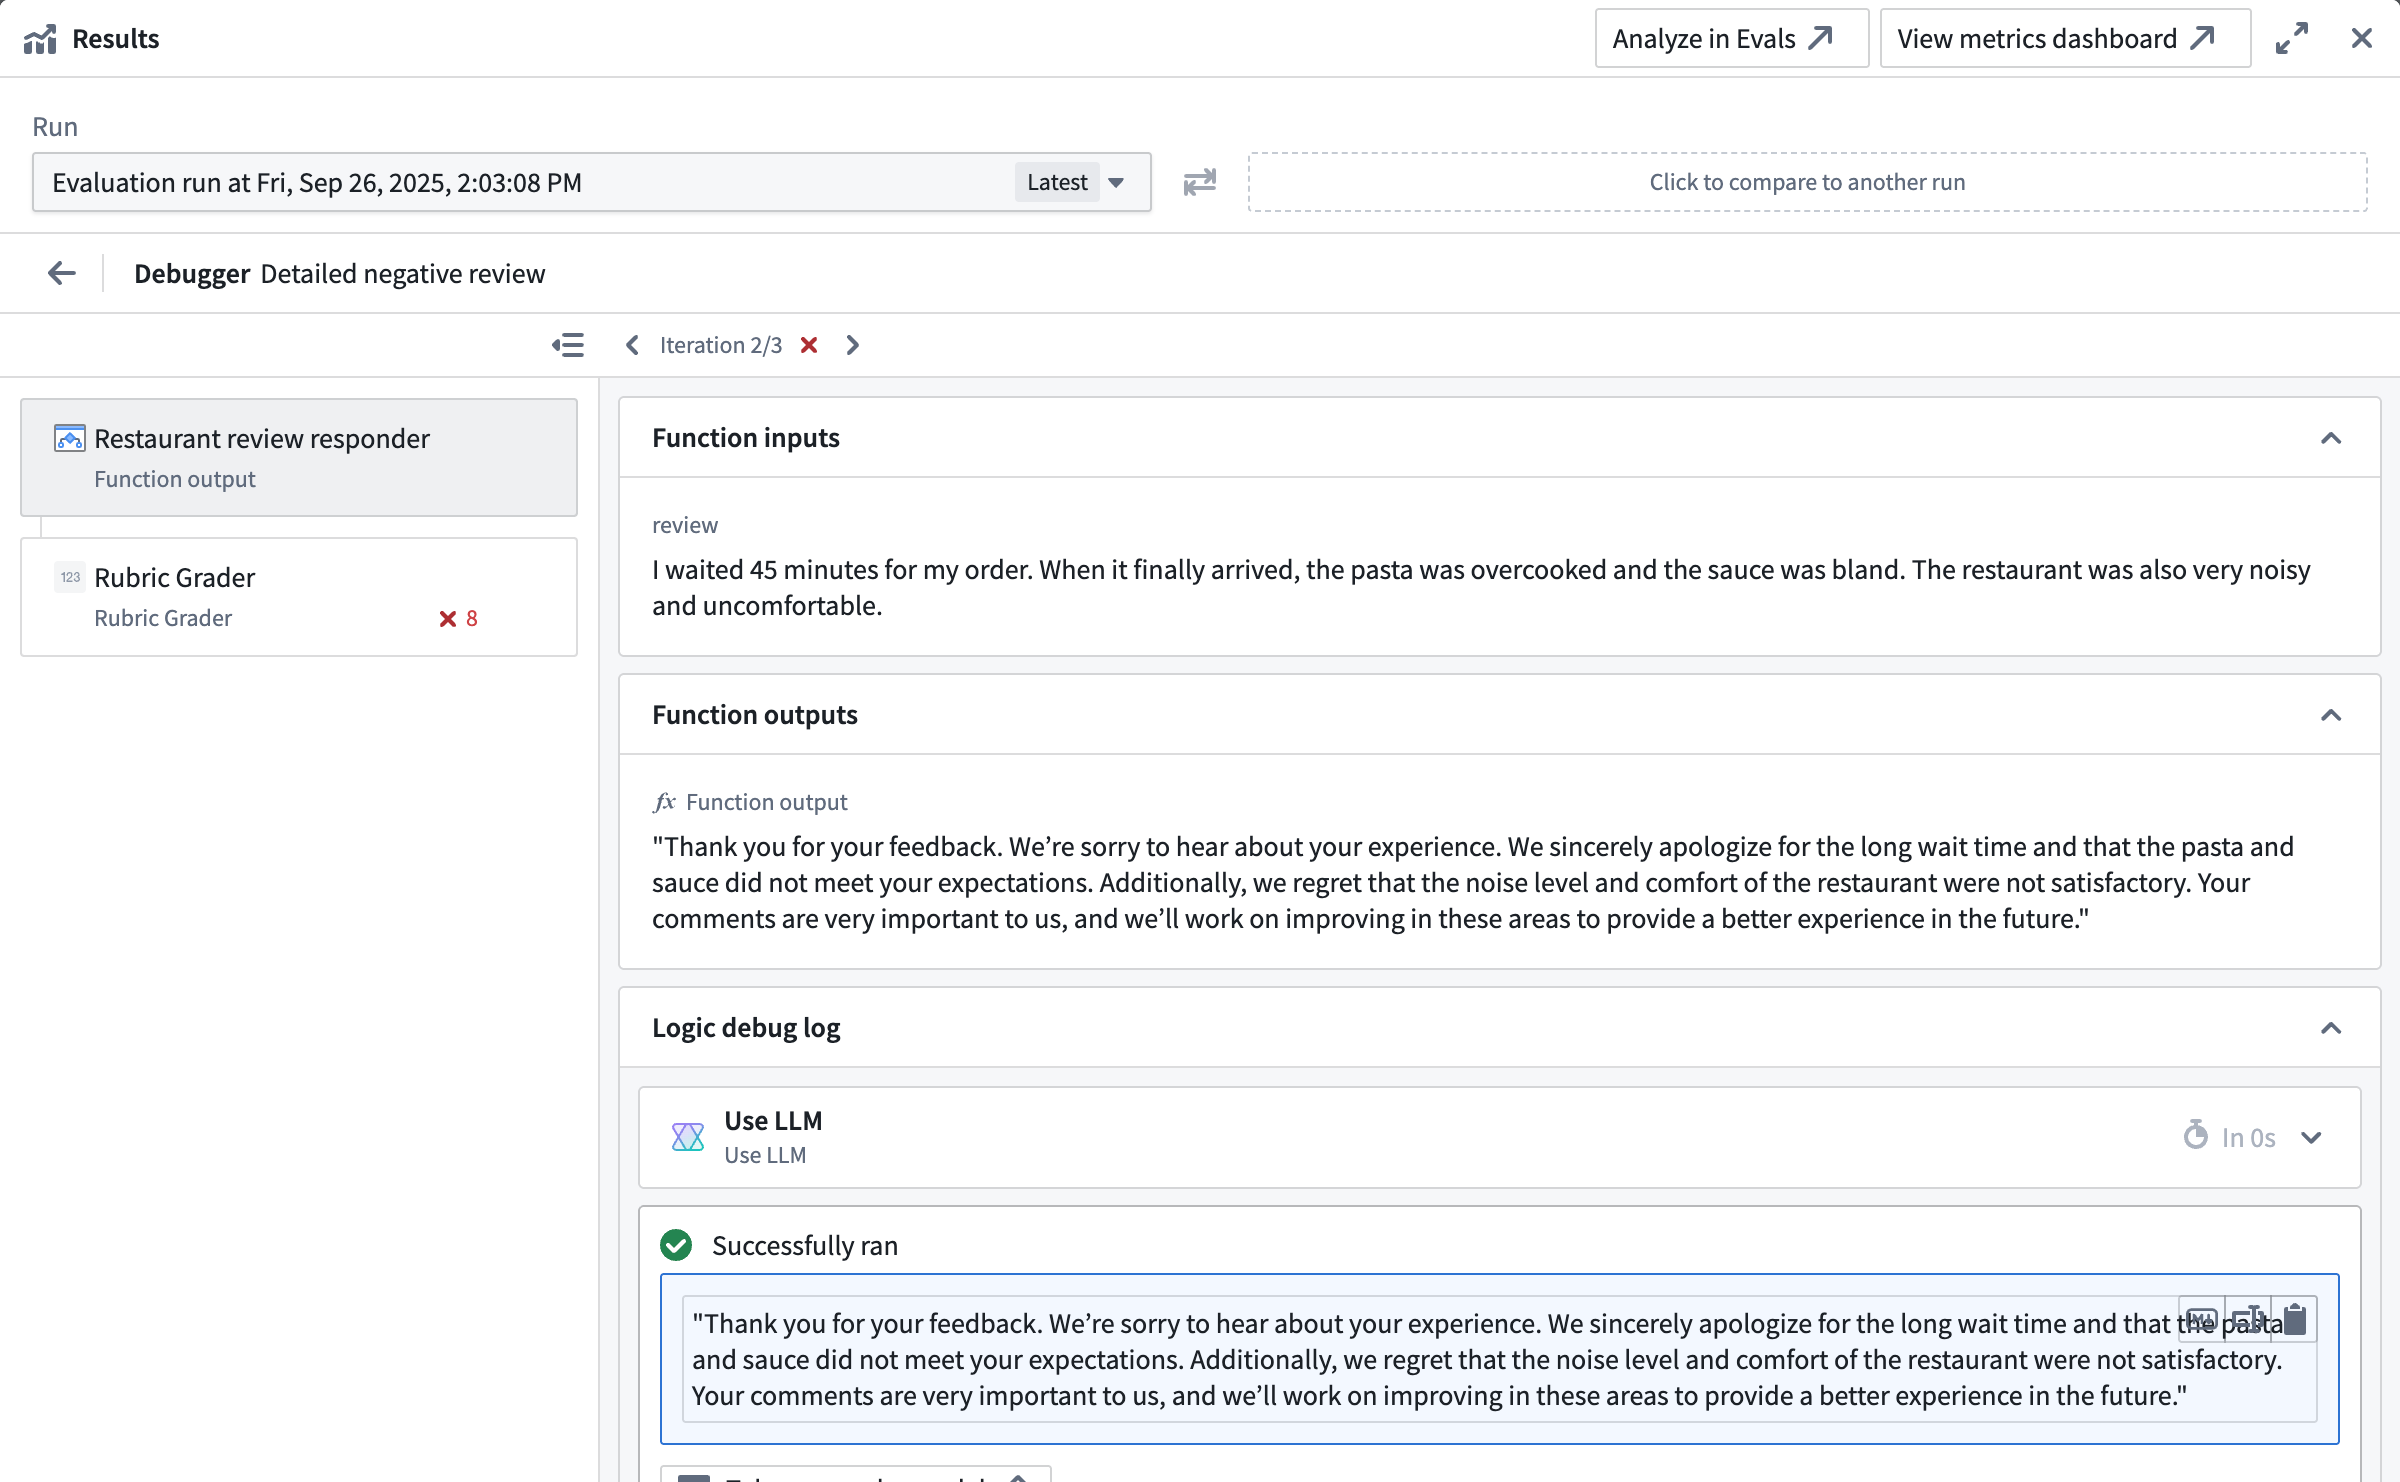
- AIP Logic functions: Trace the function execution step-by-step with the native Logic debugger.
- Evaluators: Check input and output values, expected vs. actual evaluator results, and debug outputs from custom function evaluators.
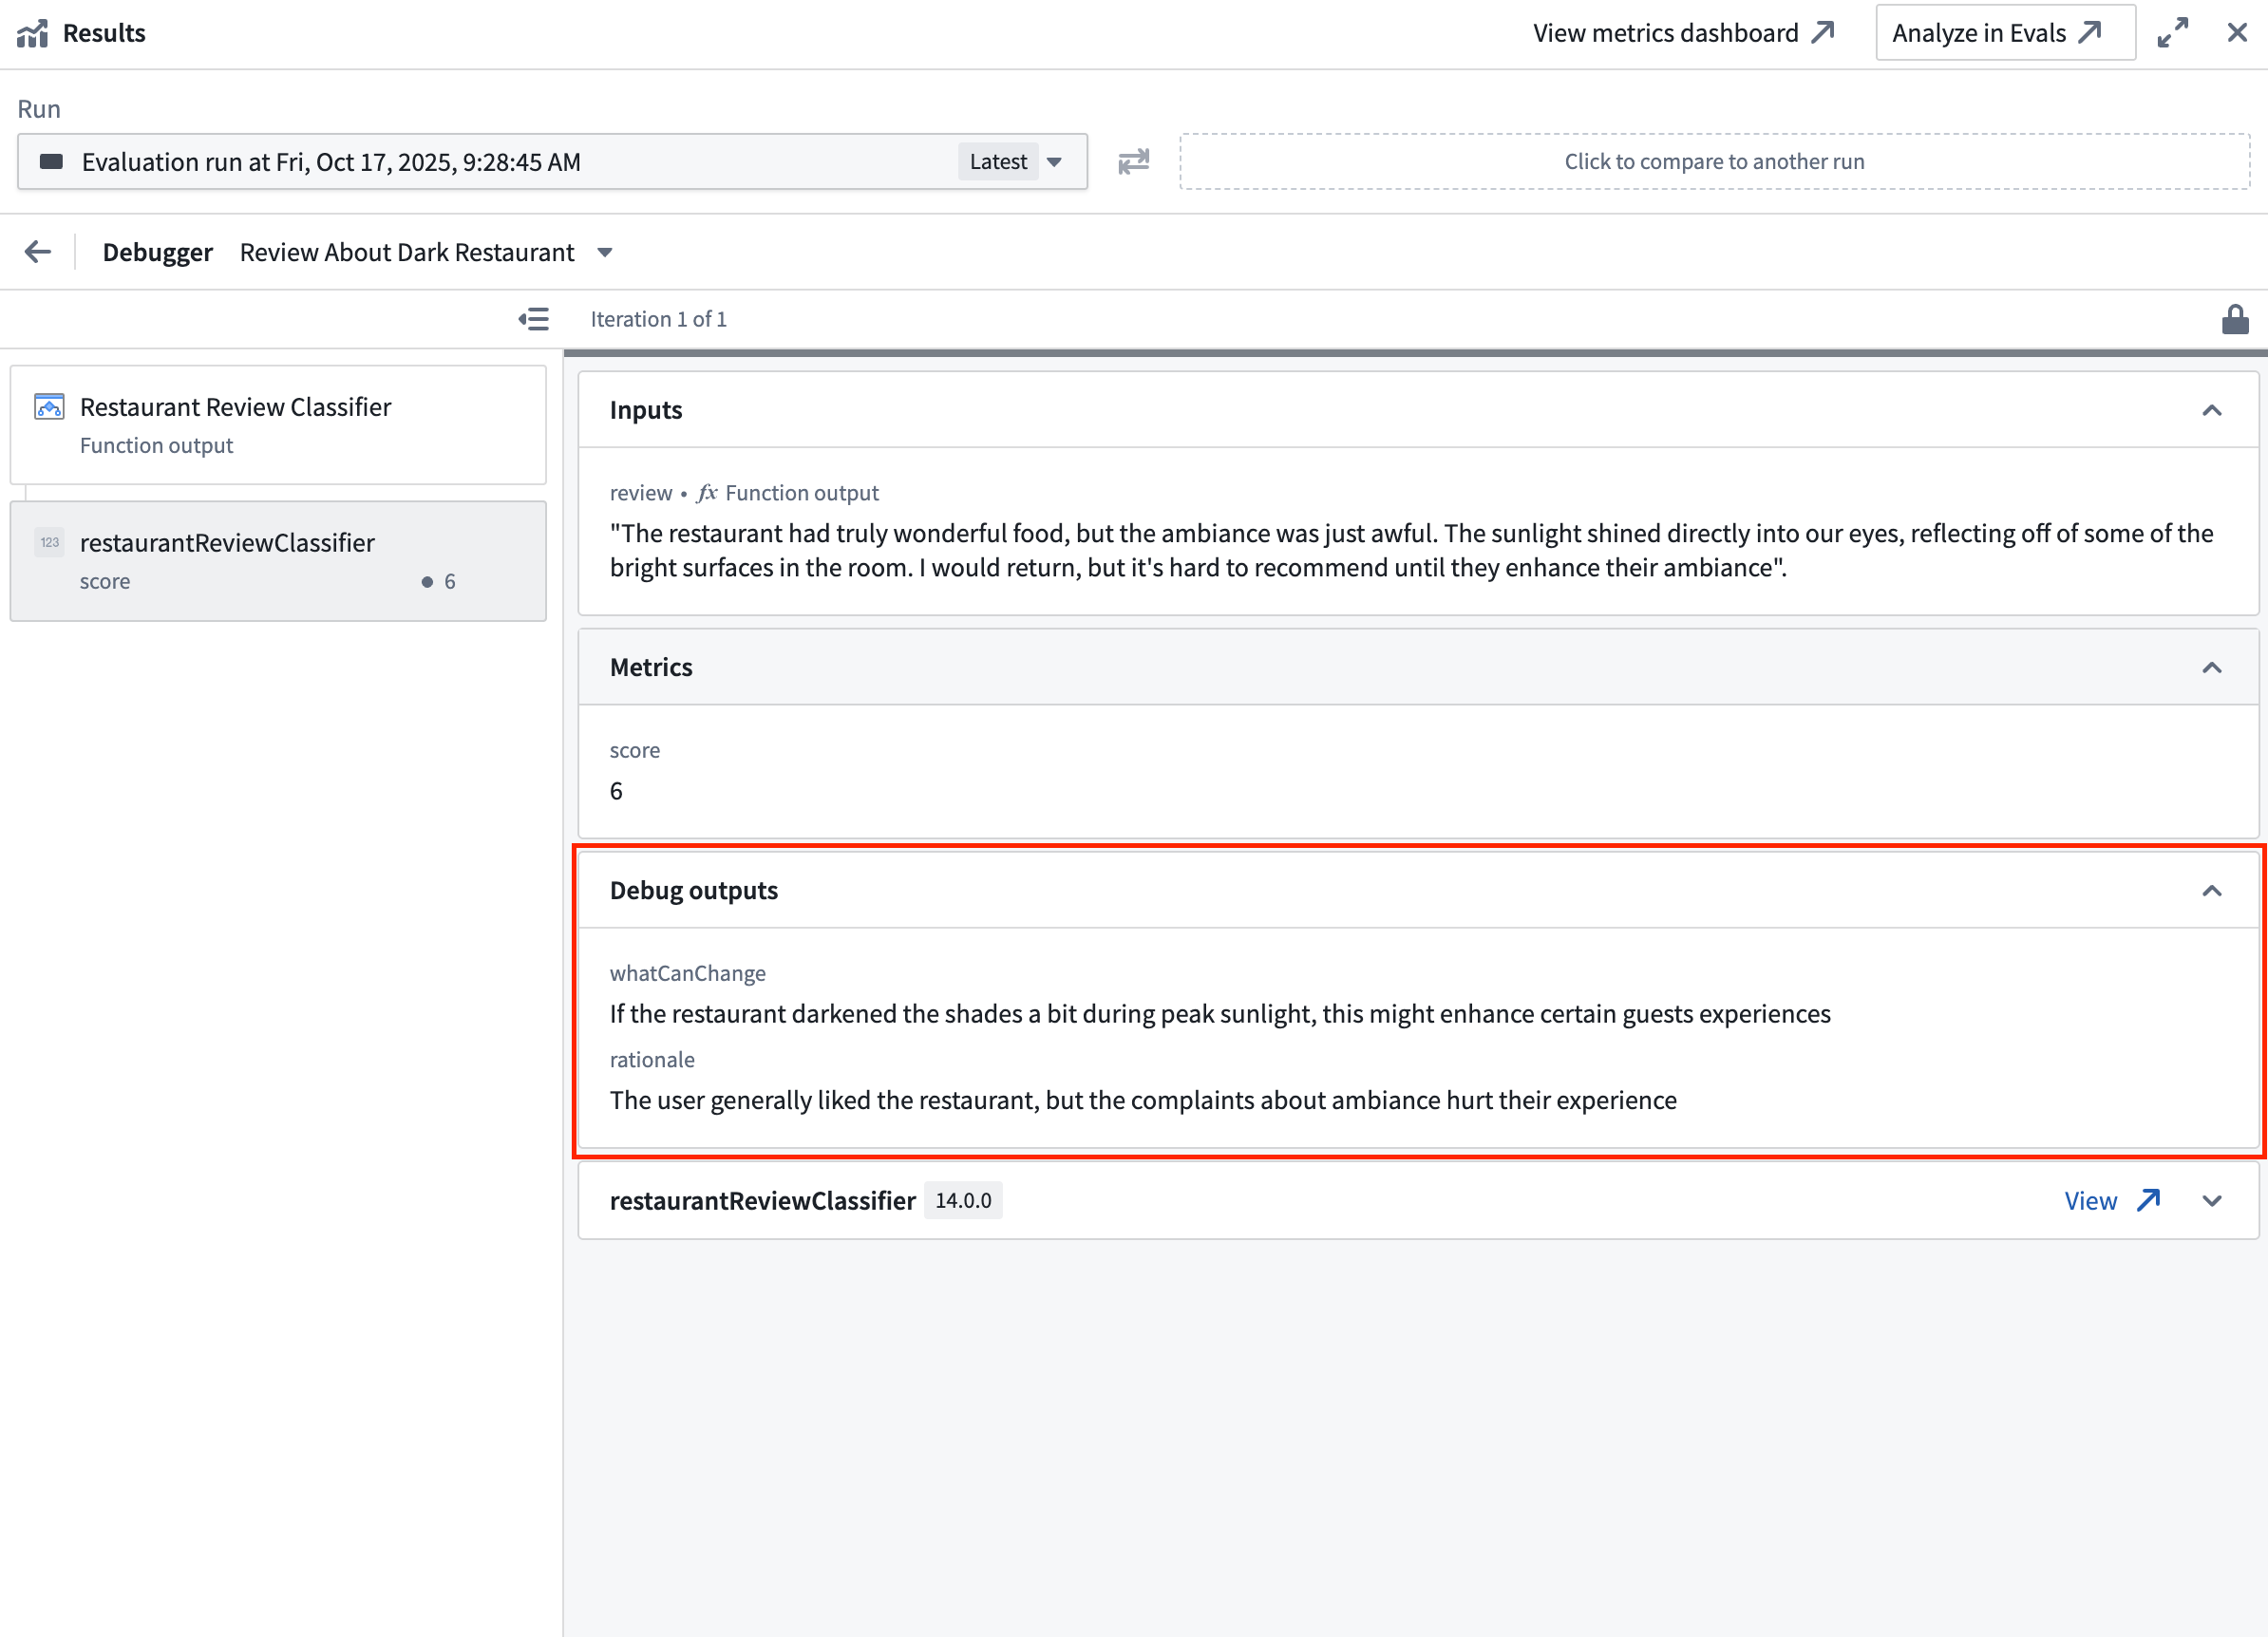
Custom function evaluators can return string values alongside their metric outputs. These strings appear as Debug outputs in the evaluator tab, providing additional context such as reasoning, intermediate values, or diagnostic information.
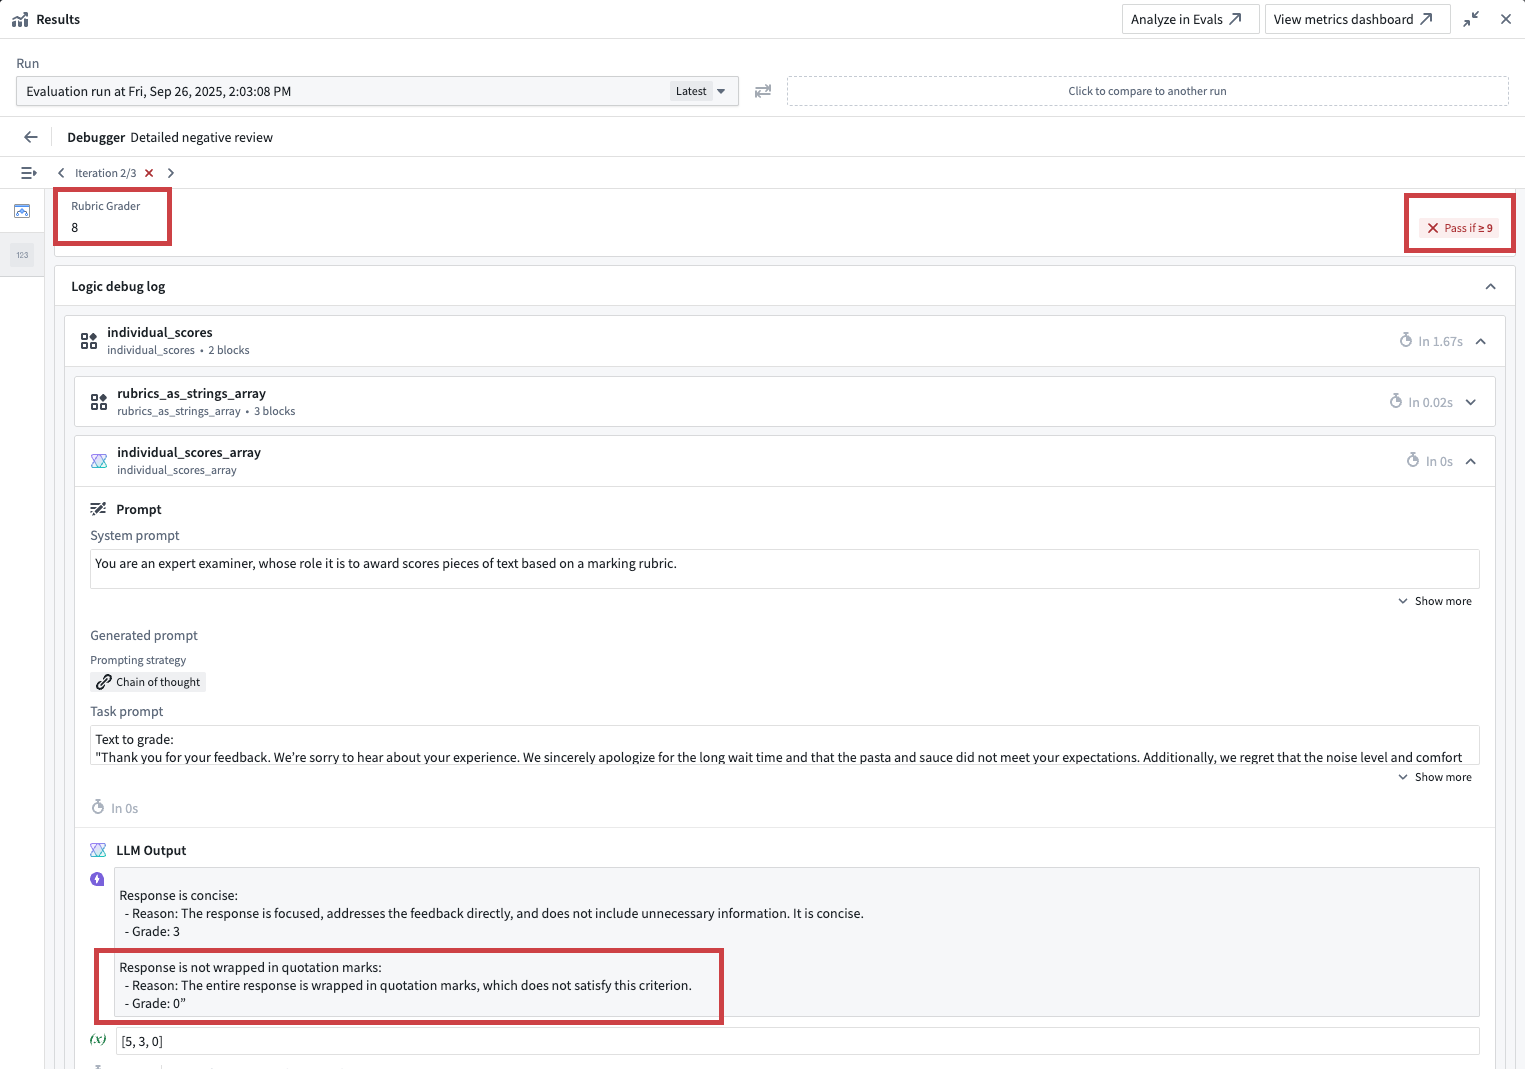
Evaluation functions that are backed by AIP Logic, like the out-of-the-box provided Rubric grader or Contains key details evaluators allow access to the native Logic debugger. This helps you understand why the evaluation produced a specific result which is particularly helpful when using an LLM-as-a-judge evaluator.
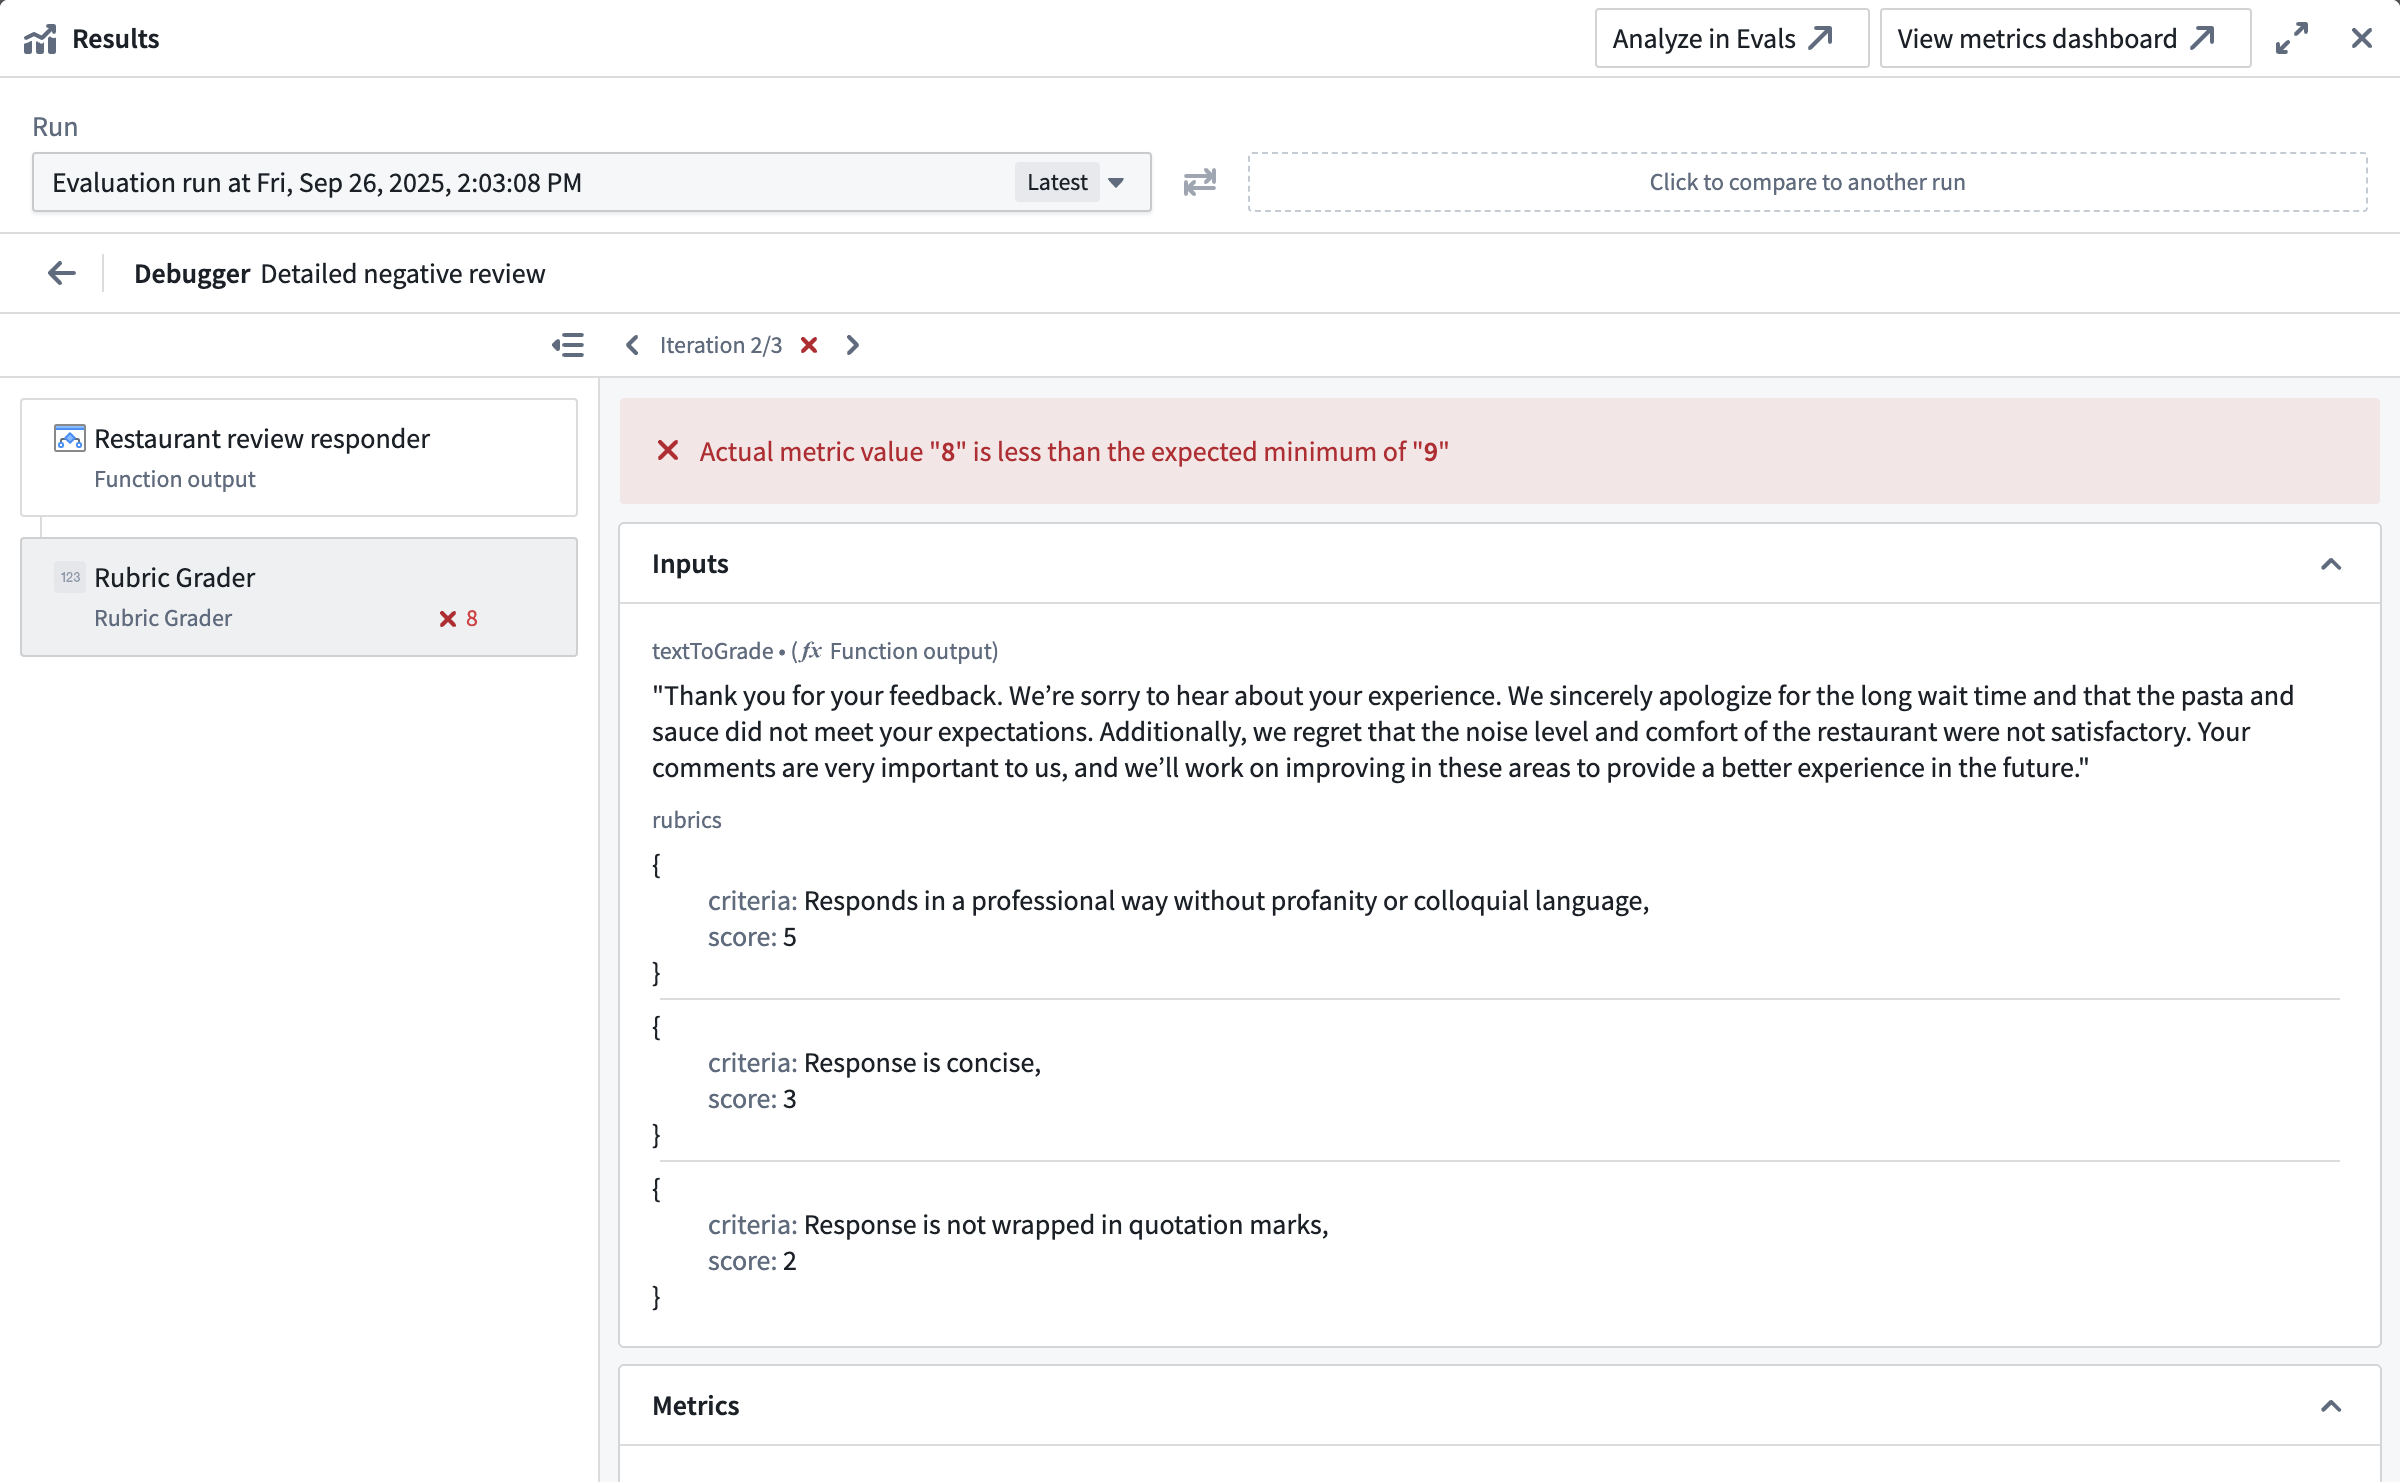
In the example shown in the screenshot below, the rubric grader evaluator did not pass, because the result of 8 did not cross the defined minimum threshold of 9. Looking into the Logic debugger, we can see that the LLM judge only awarded 8 points because the response was wrapped in quotation marks. To earn a higher score, we will need to improve our prompt.
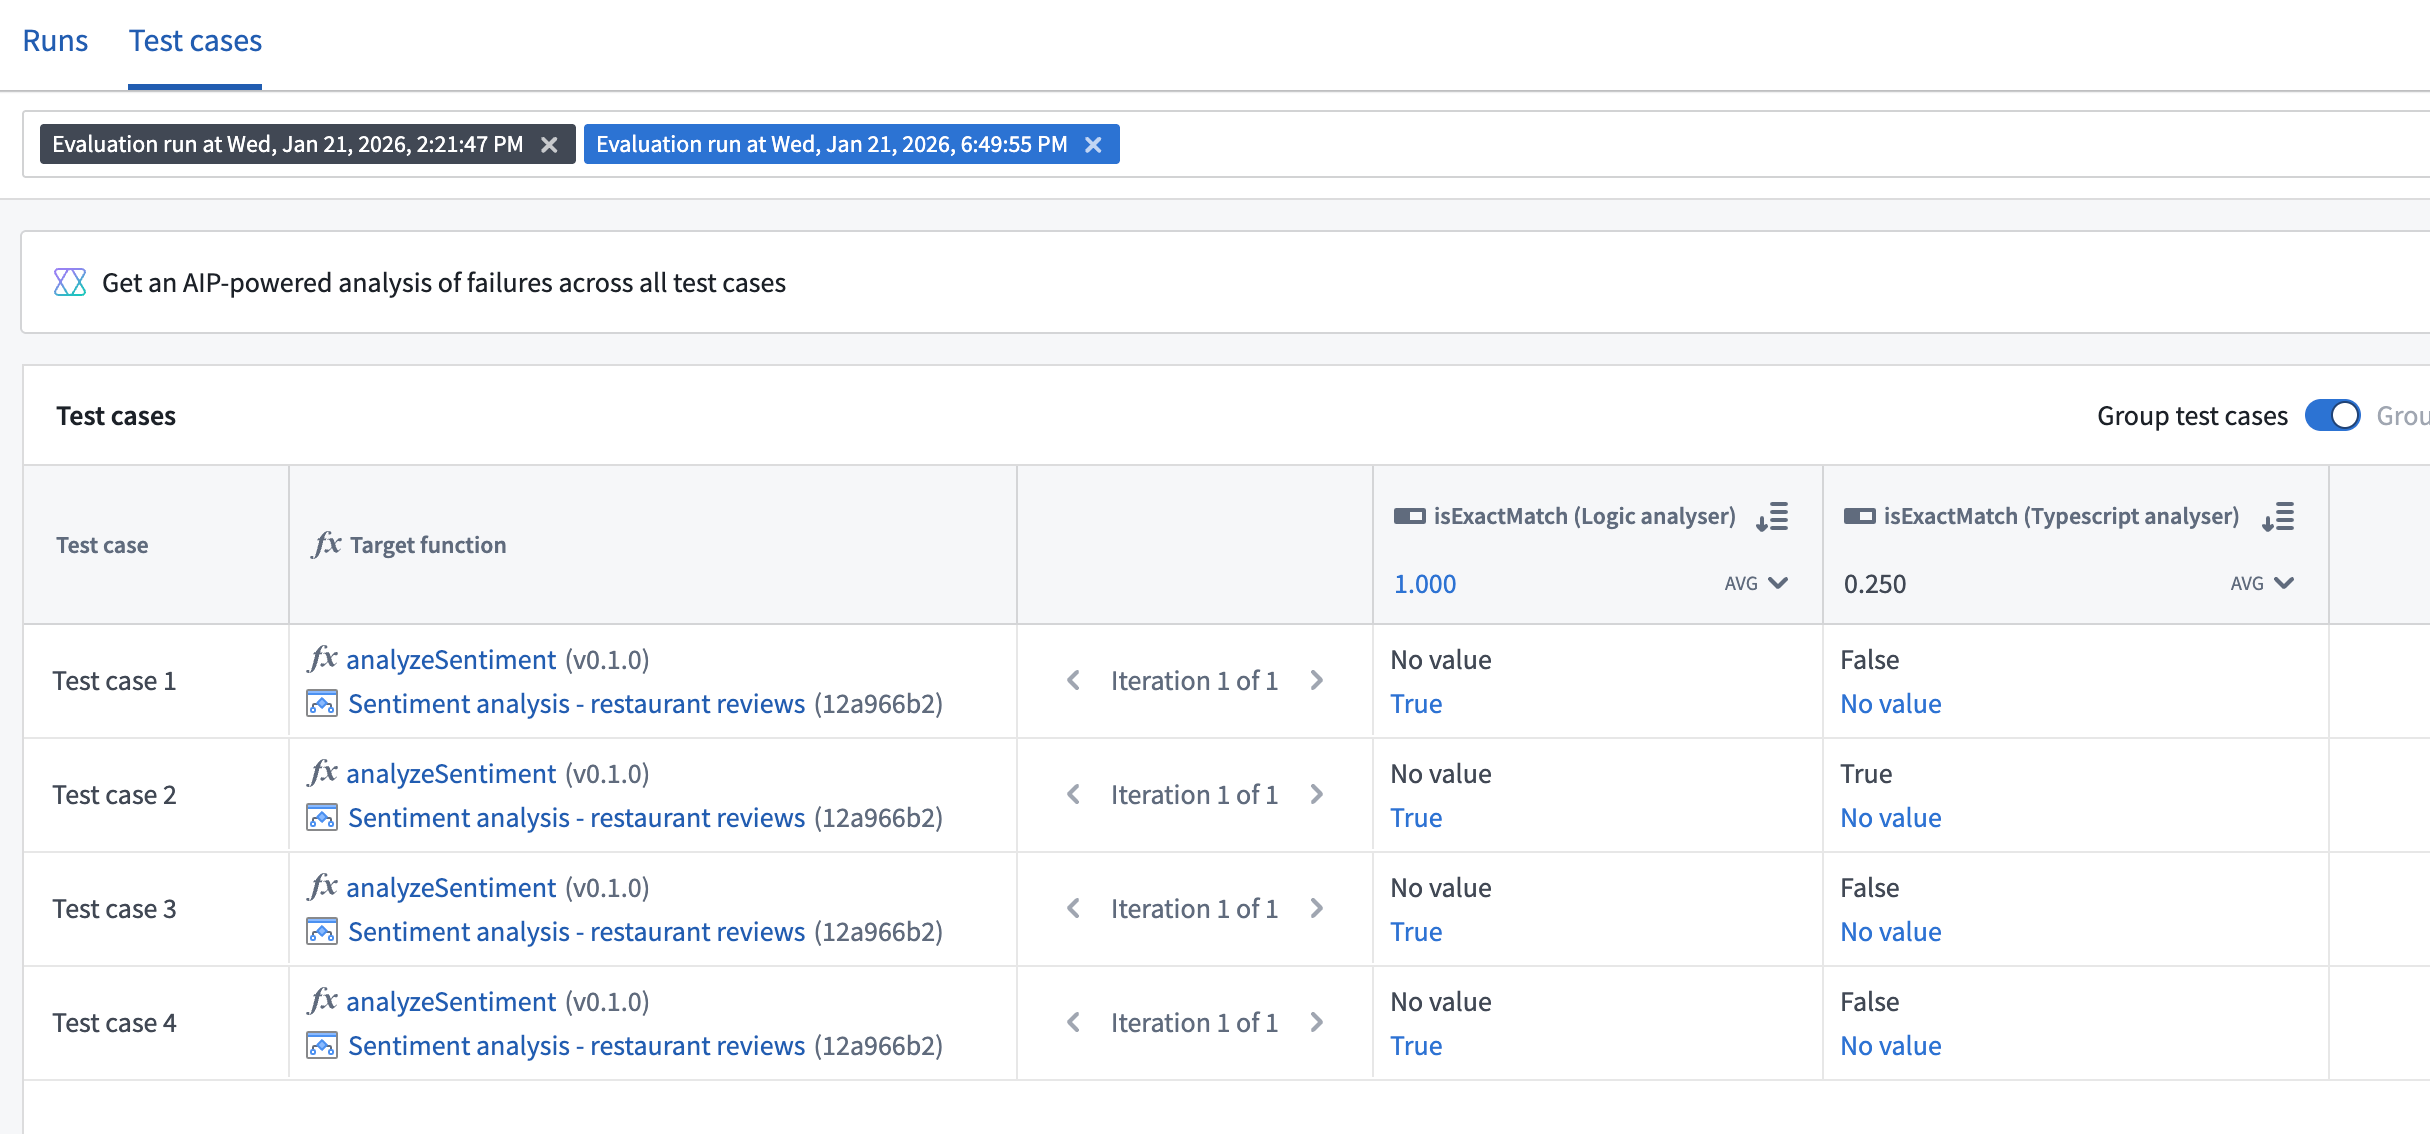
Compare results across target functions
When your evaluation suite has multiple target functions configured, you can select and compare results from runs across different targets in AIP Evals. This is useful for analyzing how different function implementations perform on the same test cases.
Analyze results with AI FDE
You can use AI FDE to analyze failing test cases, identify root cause patterns, and receive suggestions to improve your prompts.
Analyze from AIP Evals
- Open the Results tab on your evaluation suite page.
- Select a single run that contains failing test cases and select the Test cases tab.
- Select Analyze with AI FDE.
Analyze from AIP Logic
- Open the run results dialog view from the AIP Evals sidebar.
- Select Analyze with AI FDE.
AI FDE will open in a new tab with the context of your run results. For more information on AI FDE, see the AI FDE documentation.