- Capabilities
- Getting started
- Architecture center
- Platform updates
AIP observability
AIP observability features provide visibility into your AIP and Ontology workflow executions through metrics, tracing, logs, and execution history. As part of a comprehensive observability strategy across the platform, these features are integrated into Workflow Lineage to enable cross-functional teams to monitor and optimize performance at every level of the applications, workflows, and products built with AIP and the Ontology.

Key capabilities of AIP observability
- Metrics: Monitor near real-time success/failure counts and P95 execution duration for functions, actions, and AIP Logic.
- Execution history: Track function, action, Automate, and AIP Logic executions over the past 30 days.
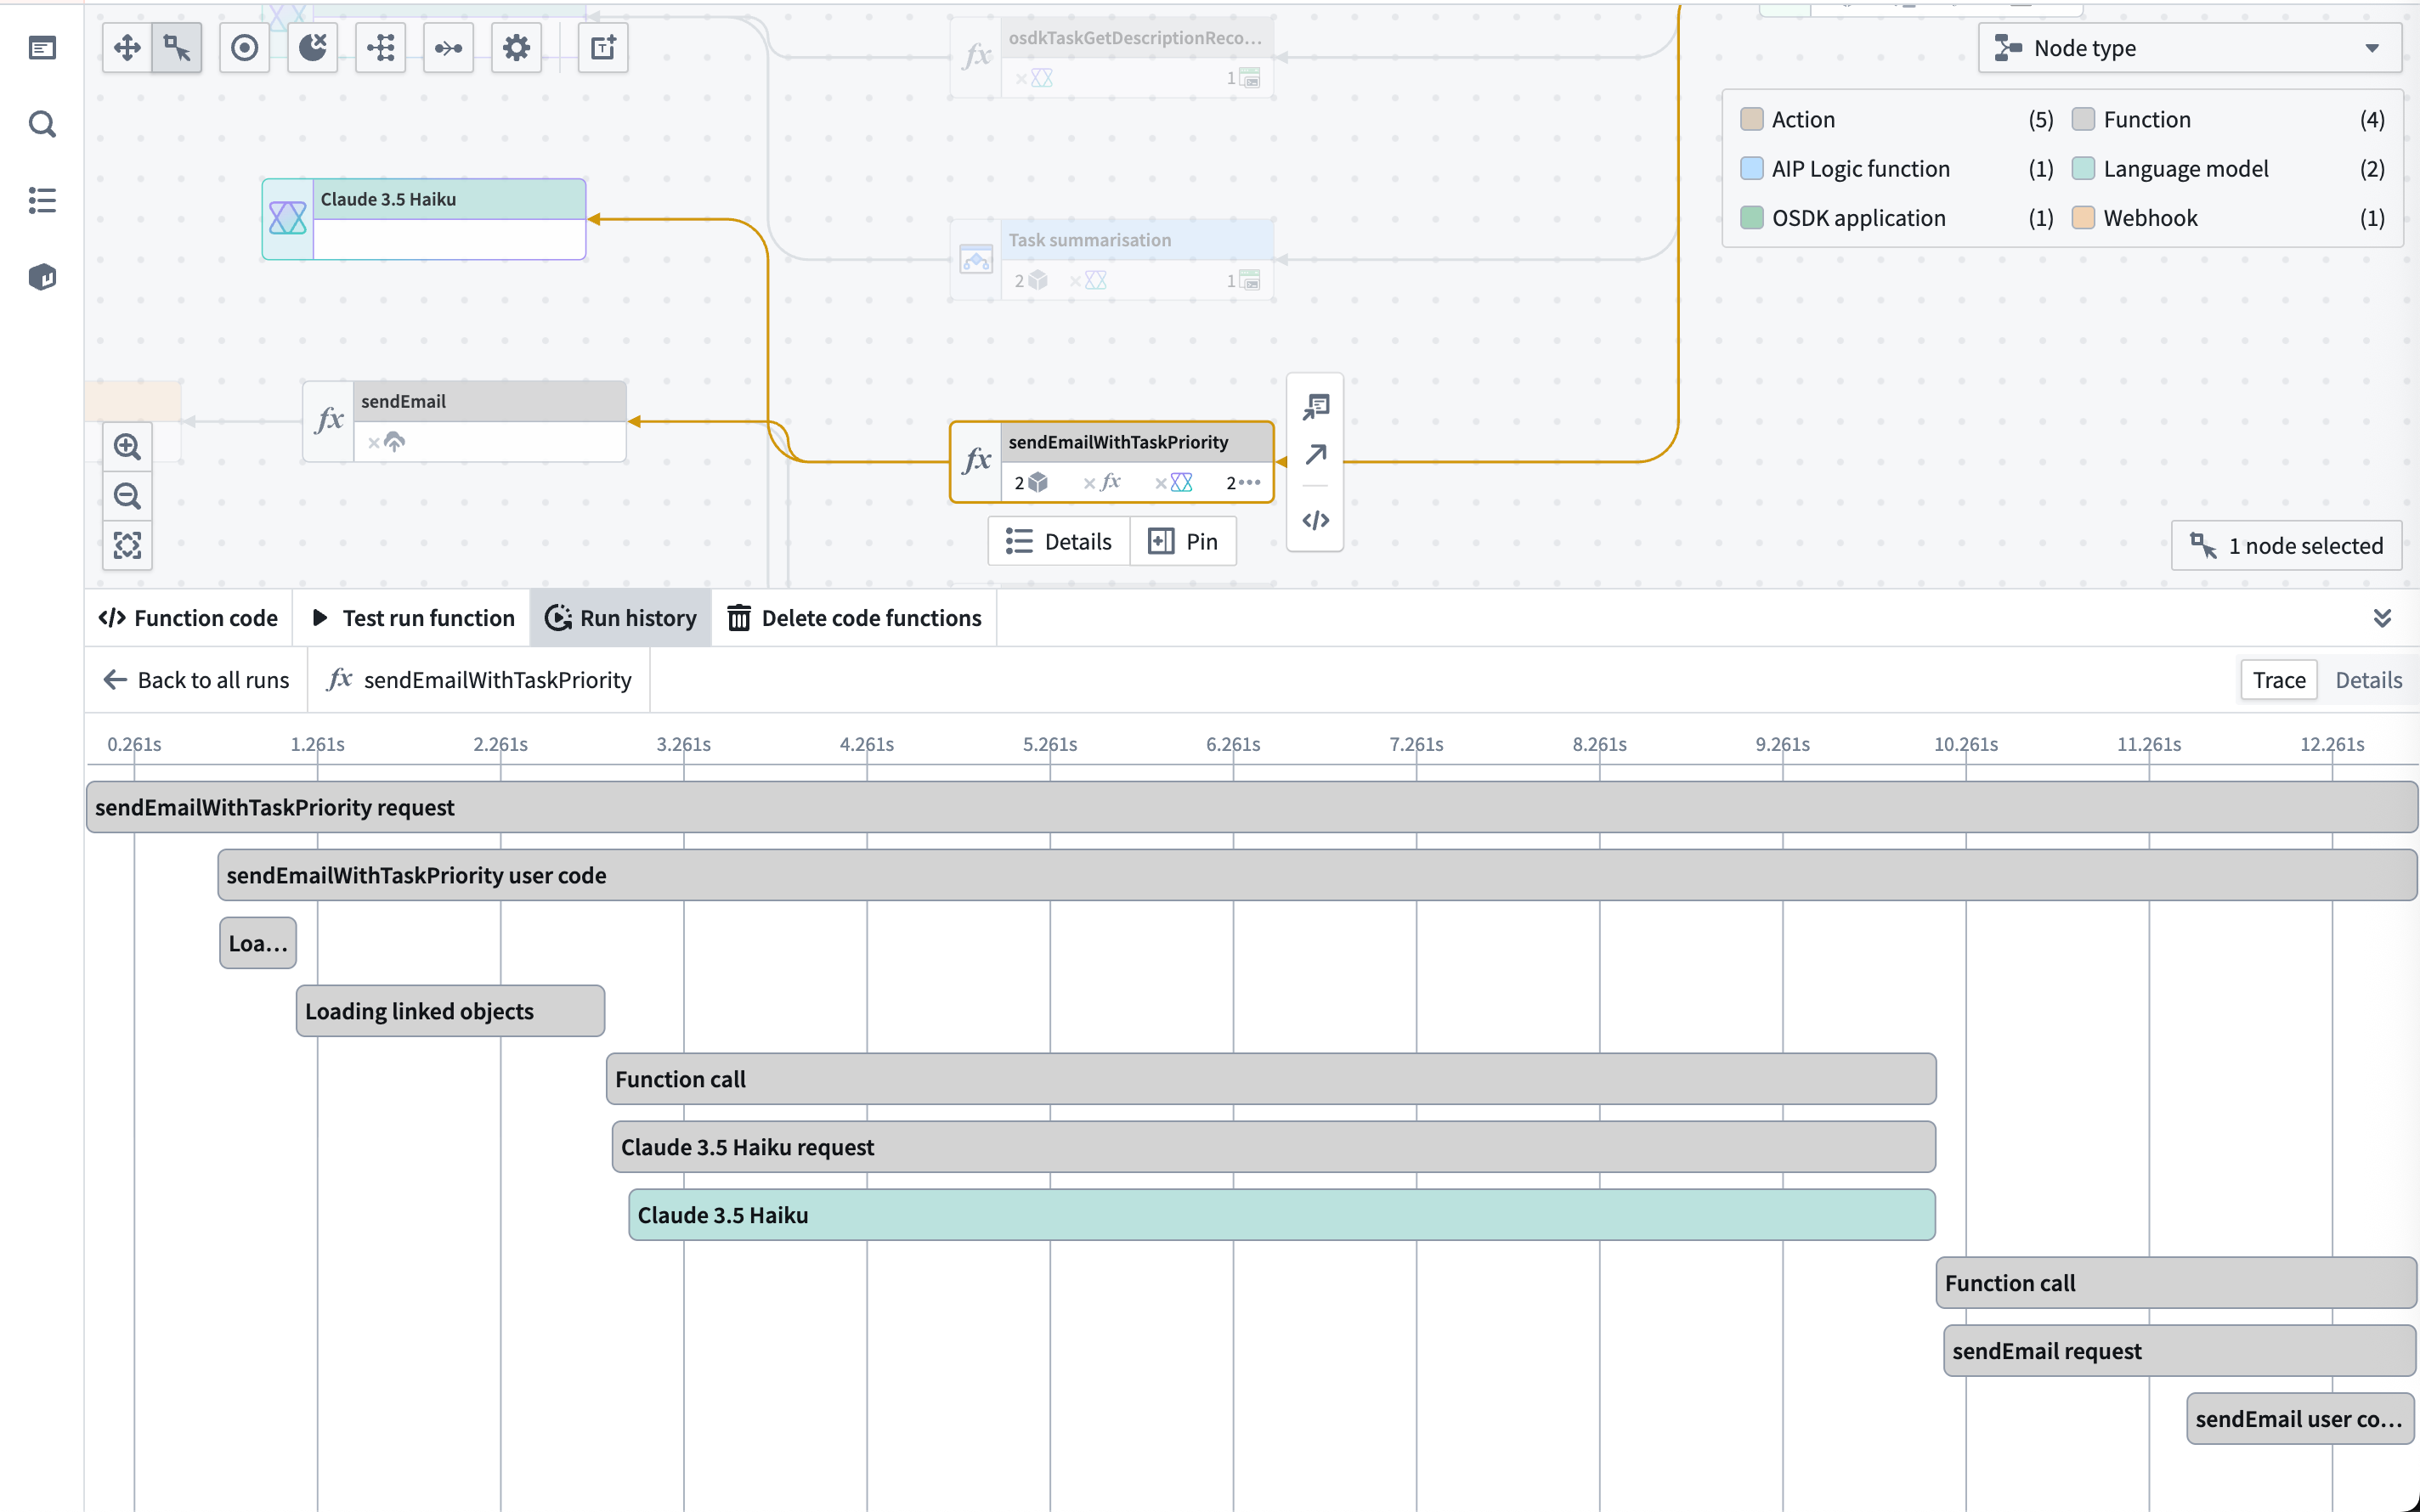
- Distributed tracing: Visualize the complete execution flow across functions, actions, language models, automations, and ontology loads.
- Logging and debugging: Access service logs, custom function log messages, token usage, prompts, error details, and more.
- Log search: Search across all service logs for a source executor to find specific log messages, errors, or patterns across multiple executions.
- Performance monitoring: Identify bottlenecks and optimize execution times.
- Log export to Foundry streaming dataset: Have your logs exported to a streaming dataset and perform complex analysis on your telemetry.
Getting started with AIP observability
To use AIP observability:
- Navigate to a function, action, or automation in Workflow Lineage.
- Select the Run history tab to view recent executions.
- Click View log details on any execution to access traces and logs.
- Ensure proper log permissions are configured for your resources.
Observability across the platform
AIP observability integrates with the rest of the Palantir platform to provide insight into all of your Ontology and AIP workflows, even if AIP is not enabled on your enrollment. The following tools work together to provide comprehensive visibility into your systems, from individual function execution to platform-wide resource consumption.
Monitoring performance and optimization
- Function instrumentation: Overview of the tools to instrument functions in production.
- Function monitoring: Set up alerts for function performance and failure rates.
- Action metrics: Analyze action execution patterns and performance.
- Action monitoring: Configure monitoring rules to track action performance and reliability.
Monitoring resource usage and costs
- AIP usage metrics: Model usage coloring and charts for tracking token usage and model requests.
- Logic compute usage: Track compute consumption in AIP Logic applications.
- AIP compute usage: Understand compute allocation and usage across AIP features.
Monitoring model performance
- AIP Evals: Evaluate and monitor LLM performance systematically.