- Capabilities
- Getting started
- Architecture center
- Platform updates
Trace views
The Trace view provides a visual timeline of your workflow execution, showing how different services interact and where time is spent. Specifically, a distributed trace is the timeline comprising all of the events between the generation of a request and the receipt of a response; these events can cross process, network and security boundaries. Distributed traces are key to understanding the path a request takes within your application.
Permission required
To view traces and service logs, an administrator must enable log access for the relevant project. Users always have access to logs for their own executions from the past 24 hours.
Key elements of the trace view
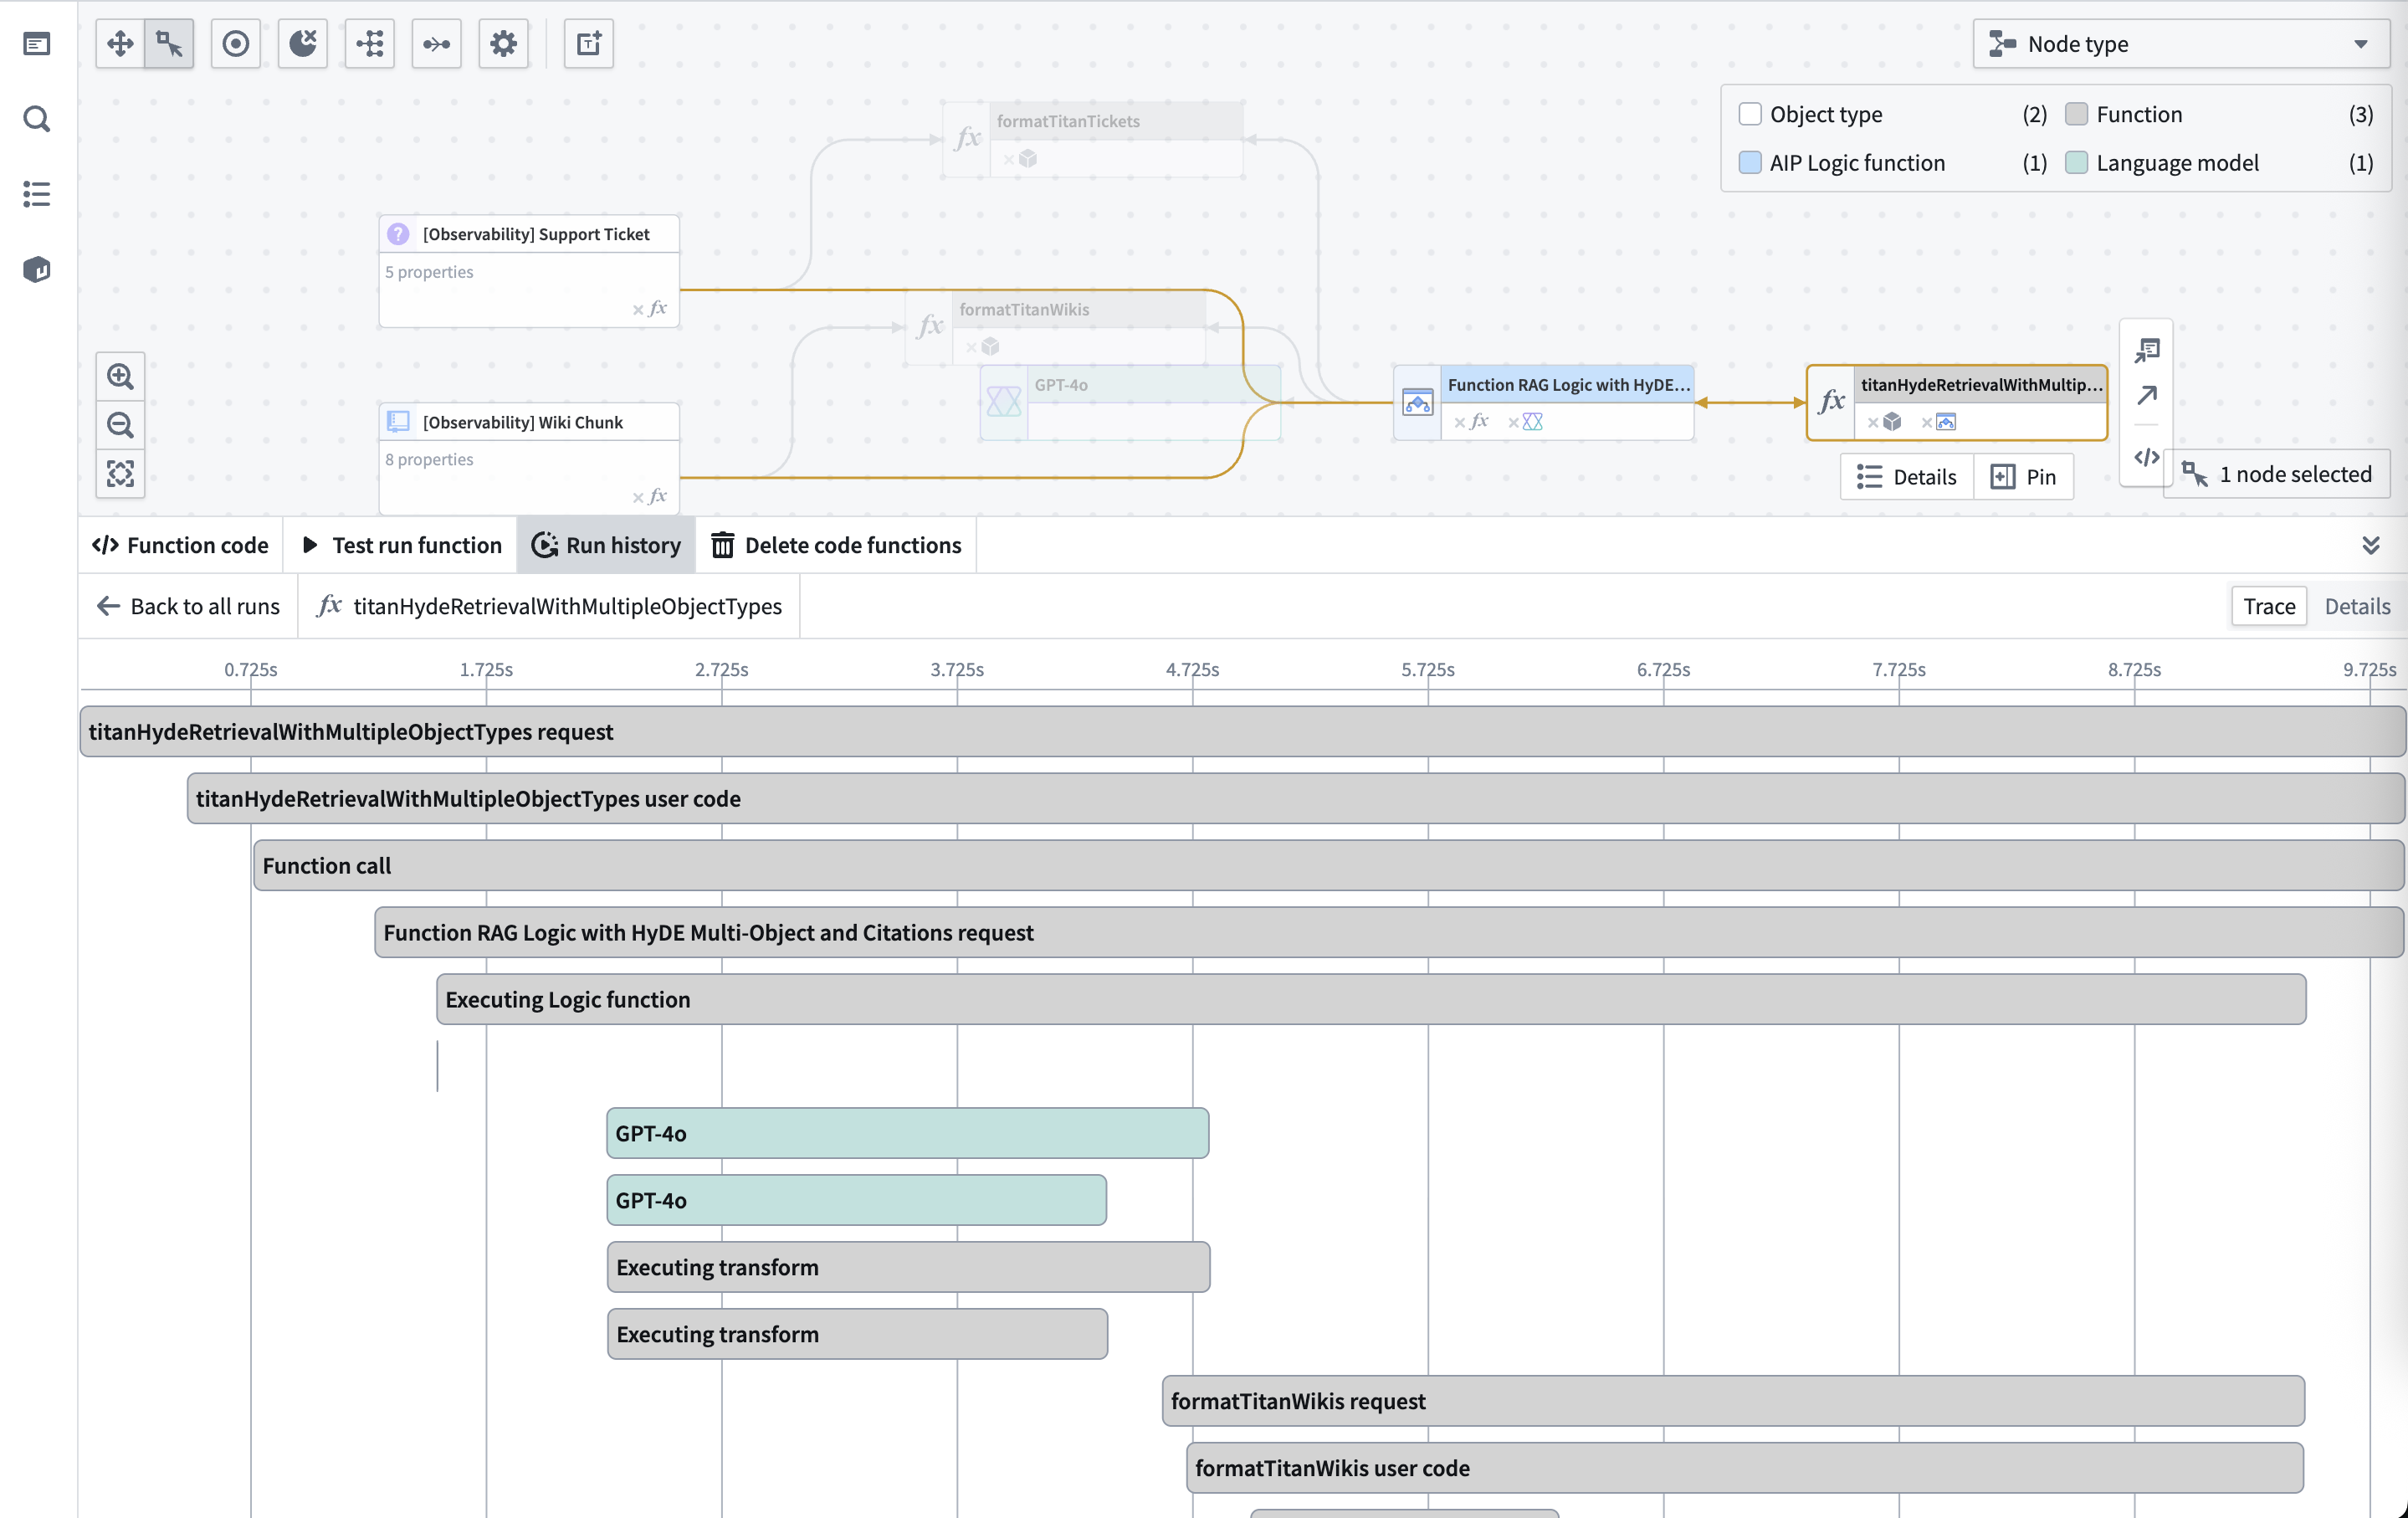
- Timeline visualization: Horizontal bars show the duration of each operation.
- Service hierarchy: Nested spans show parent-child relationships between operations.
- Resource types: Coloring indicating whether each span was produced from a Function, Action, Automation, or LLM call.
- Performance metrics: Each span displays its execution time.
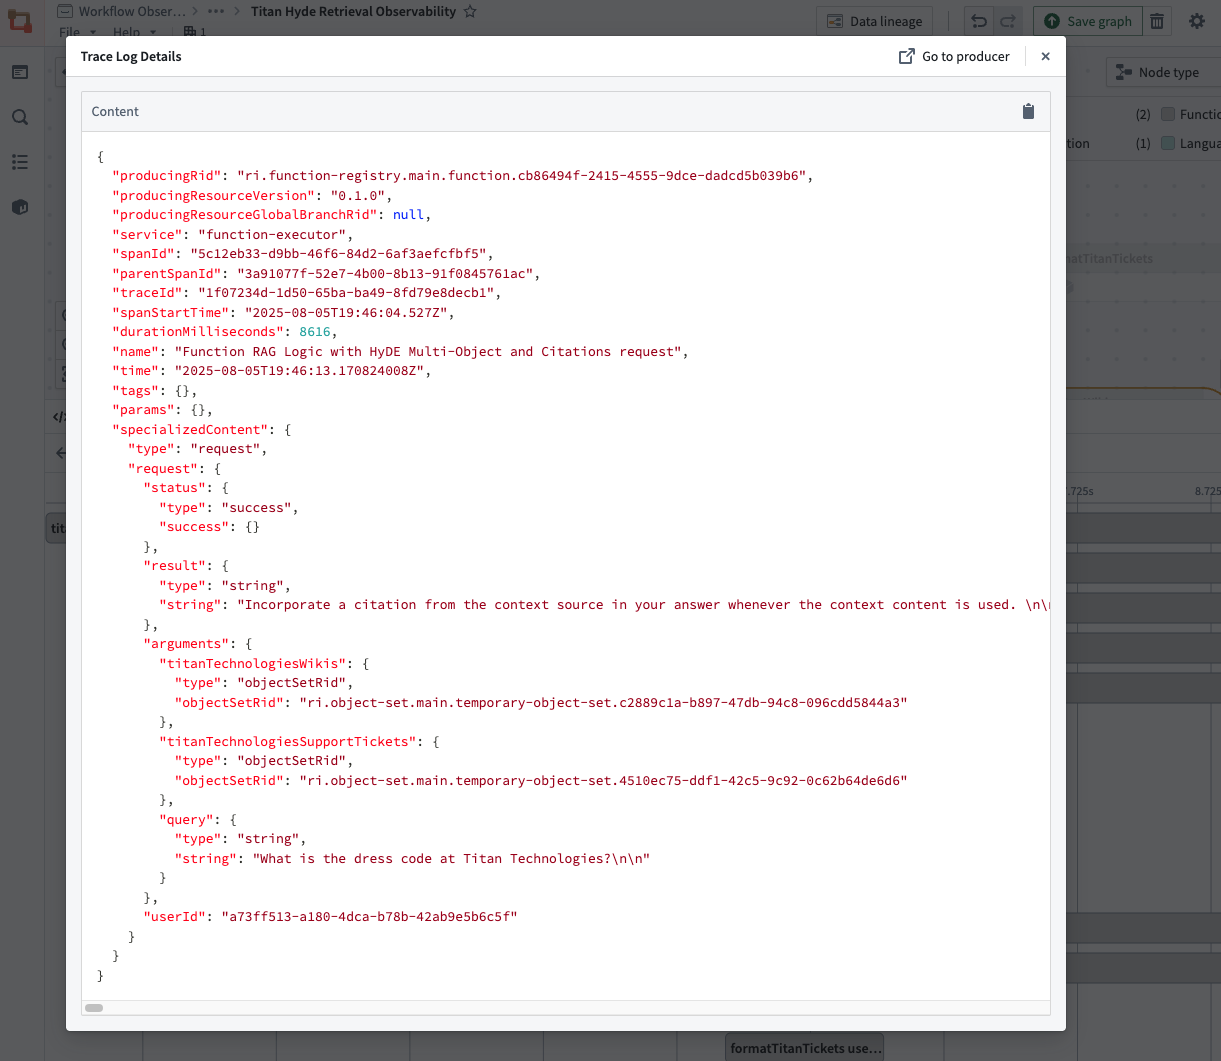
Analyzing trace details
You can select any span to see the full Trace Log Details for that specific operation.
Trace details include:
- Operation name: The specific Function, Action, Language Model, Automation, or inner operation being executed.
- Duration: Execution time for the operation.
- Input/output data: For Function execution requests, you can view the parameters passed to and returned from the operation.
- Model interactions: For LLM calls, you can view the prompt, response, and token usage.
- Error information: Stack traces and error messages for failed operations.
Related features
- Execution history: View all recent executions before diving into traces.
- Service logs: Access detailed log messages for each span.
- Performance monitoring: Analyze trace data to identify optimization opportunities.