- Capabilities
- Getting started
- Architecture center
- Platform updates
Announcements
REMINDER: Sign up for the Foundry Newsletter to receive a summary of new products, features, and improvements across the platform directly to your inbox. For more information on how to subscribe, see the Foundry Newsletter and Product Feedback channels announcement.
Share your thoughts about these announcements in our Developer Community Forum ↗.
Permission-defined compute profiles in Pipeline Builder
Date published: 2026-08-27
Pipeline Builder now applies permissions to compute profiles for Spark-backed standard batch pipelines. Previously, compute profiles were not defined by a user's permissions on the project. After this change, compute profile access is defined by project-level permissions and compute profile size.
Small and medium profiles remain available automatically. However, large and extra-large compute profiles must be imported to a project before use; this import requires a Compass project editor or owner role as well as a Resource Management administrator role.
Compute profile permissions apply to all projects, including those created before this feature was introduced. Any large or extra large profiles already in use in a project are retained, so existing pipelines will continue to run with no action required. To use a large or extra large profile that was not already imported, you must first import it to the project.
Note that streaming and Faster pipelines are not affected; their compute profile selection is unchanged.
What's new
Compute profiles now fall into two tiers:
- Auto-imported profiles (up to and including medium) are imported automatically to the project.
- Non-auto-imported profiles (large and extra large profiles) must be imported manually before a pipeline can use them. This import requires a user to have a Compass project editor or owner role and a Resource Management administrator role.
Import directly in Pipeline Builder
If a pipeline is missing a required compute profile, Pipeline Builder surfaces an error at deploy time. Select Import compute profiles to import the missing profile, provided you have a Compass project owner or editor role and a Resource Management administrator role.
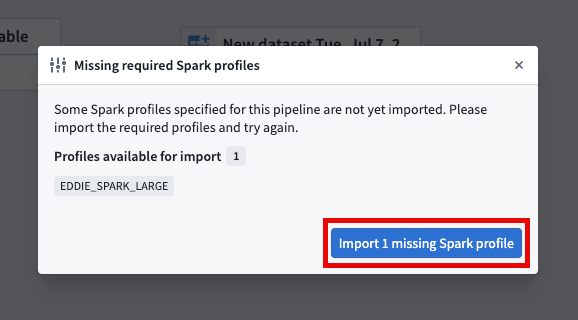
Pipeline Builder will display an error if a pipeline is missing a required compute profile and prompt you to import the missing Spark profile.
If you lack the required role set to import these profiles, you will see Large and Extra Large as disabled in the selection dropdown.
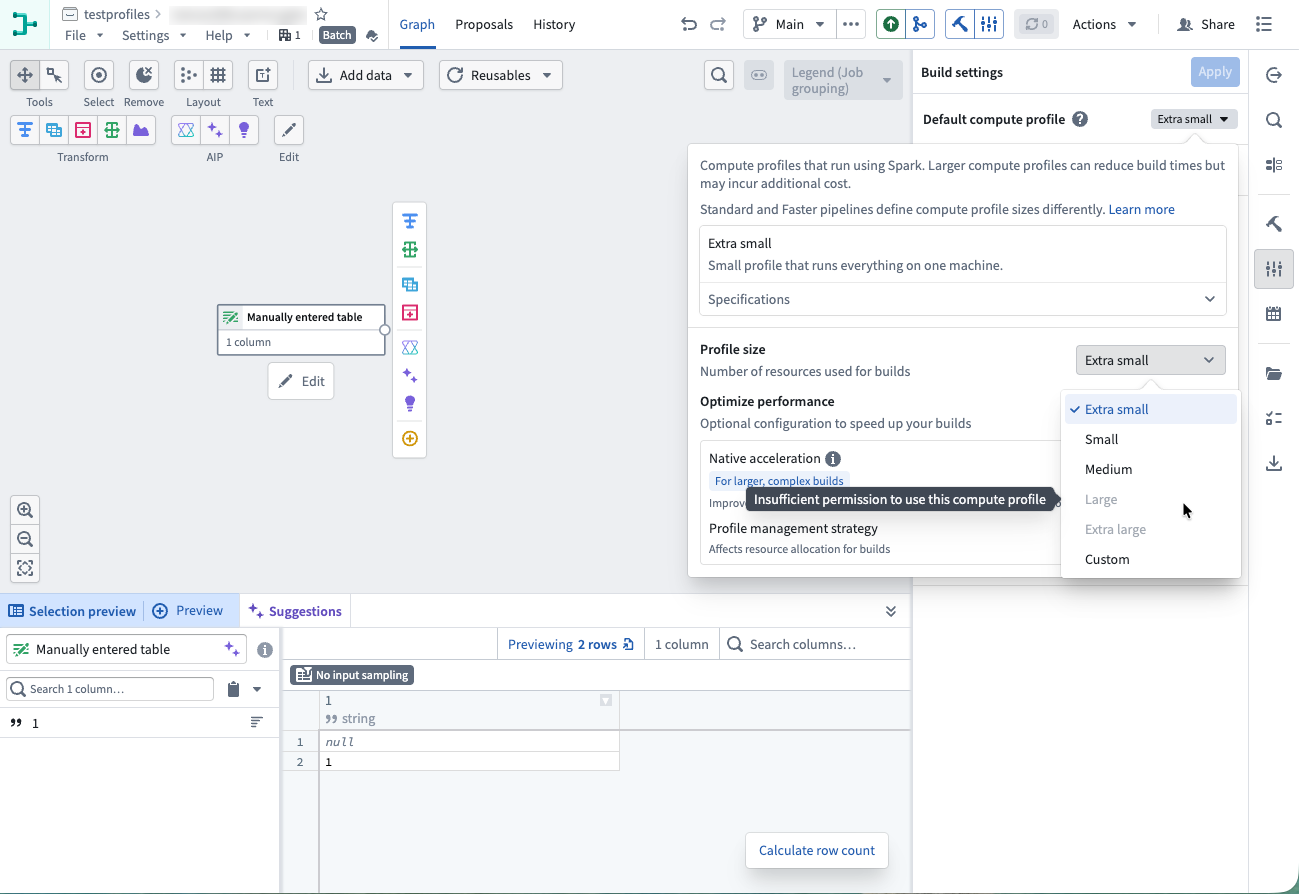
Pipeline Builder will automatically disable Large and Extra Large profiles if you lack the required role set to import these profiles.
To remove a compute profile, open the Compass project, navigate to the External references tab, select the reference, and select the minus button to remove the reference.
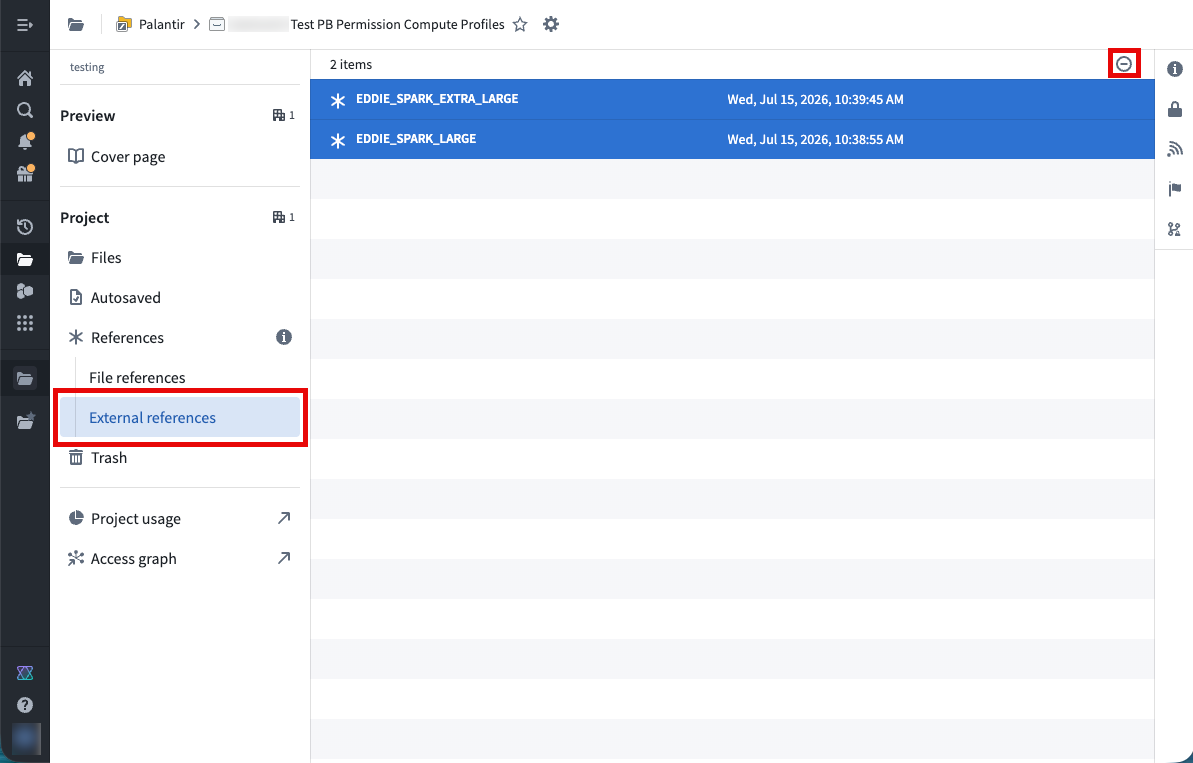
Compass interface for external references, showing the remove reference button (minus sign).
Manage profiles centrally in Control Panel
From the Pipeline Builder section of Control Panel, you can manage compute profile imports across your enrollment.
- See the projects with a given profile imported where you have at least a Compass discover role.
- Import a profile to one or more projects at once.
- Remove a profile from up to 20 projects at once.
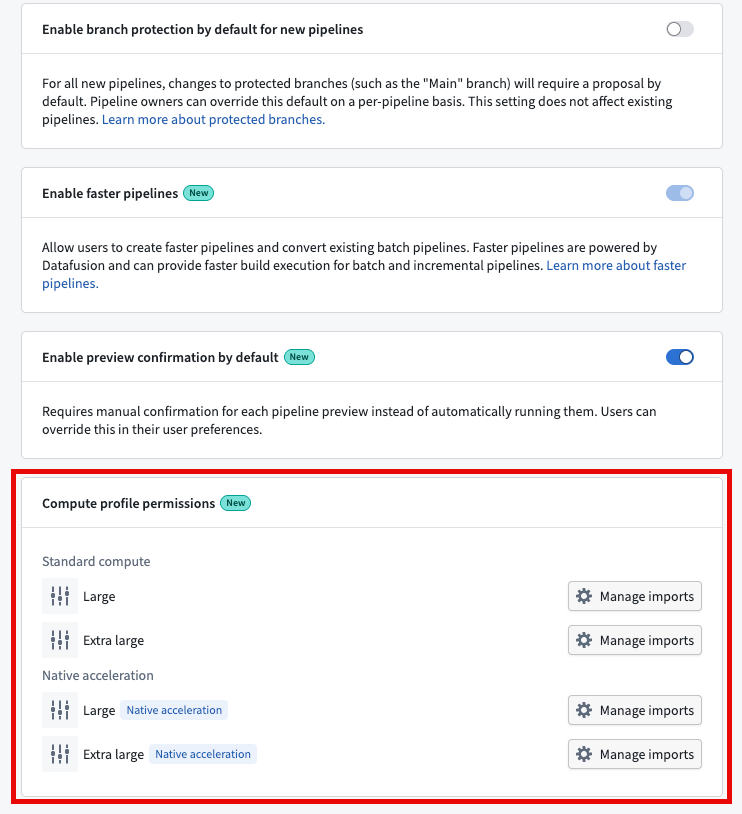
Compute profile permissions menu.
Learn more about configuring compute profile permissions.
Share your feedback
As we continue to add features to Pipeline Builder, we want to hear about your experiences and welcome your feedback. Share your thoughts with Palantir Support channels or our Developer Community ↗ using the pipeline-builder tag ↗.
Compute application metrics in Workshop with SQL query variables
Date published: 2026-08-25
SQL query variables are now generally available in Workshop and enabled by default for all users. This variable definition type lets you compute a variable's value by writing an Ontology SQL query directly in the module, without building and deploying a separate function.
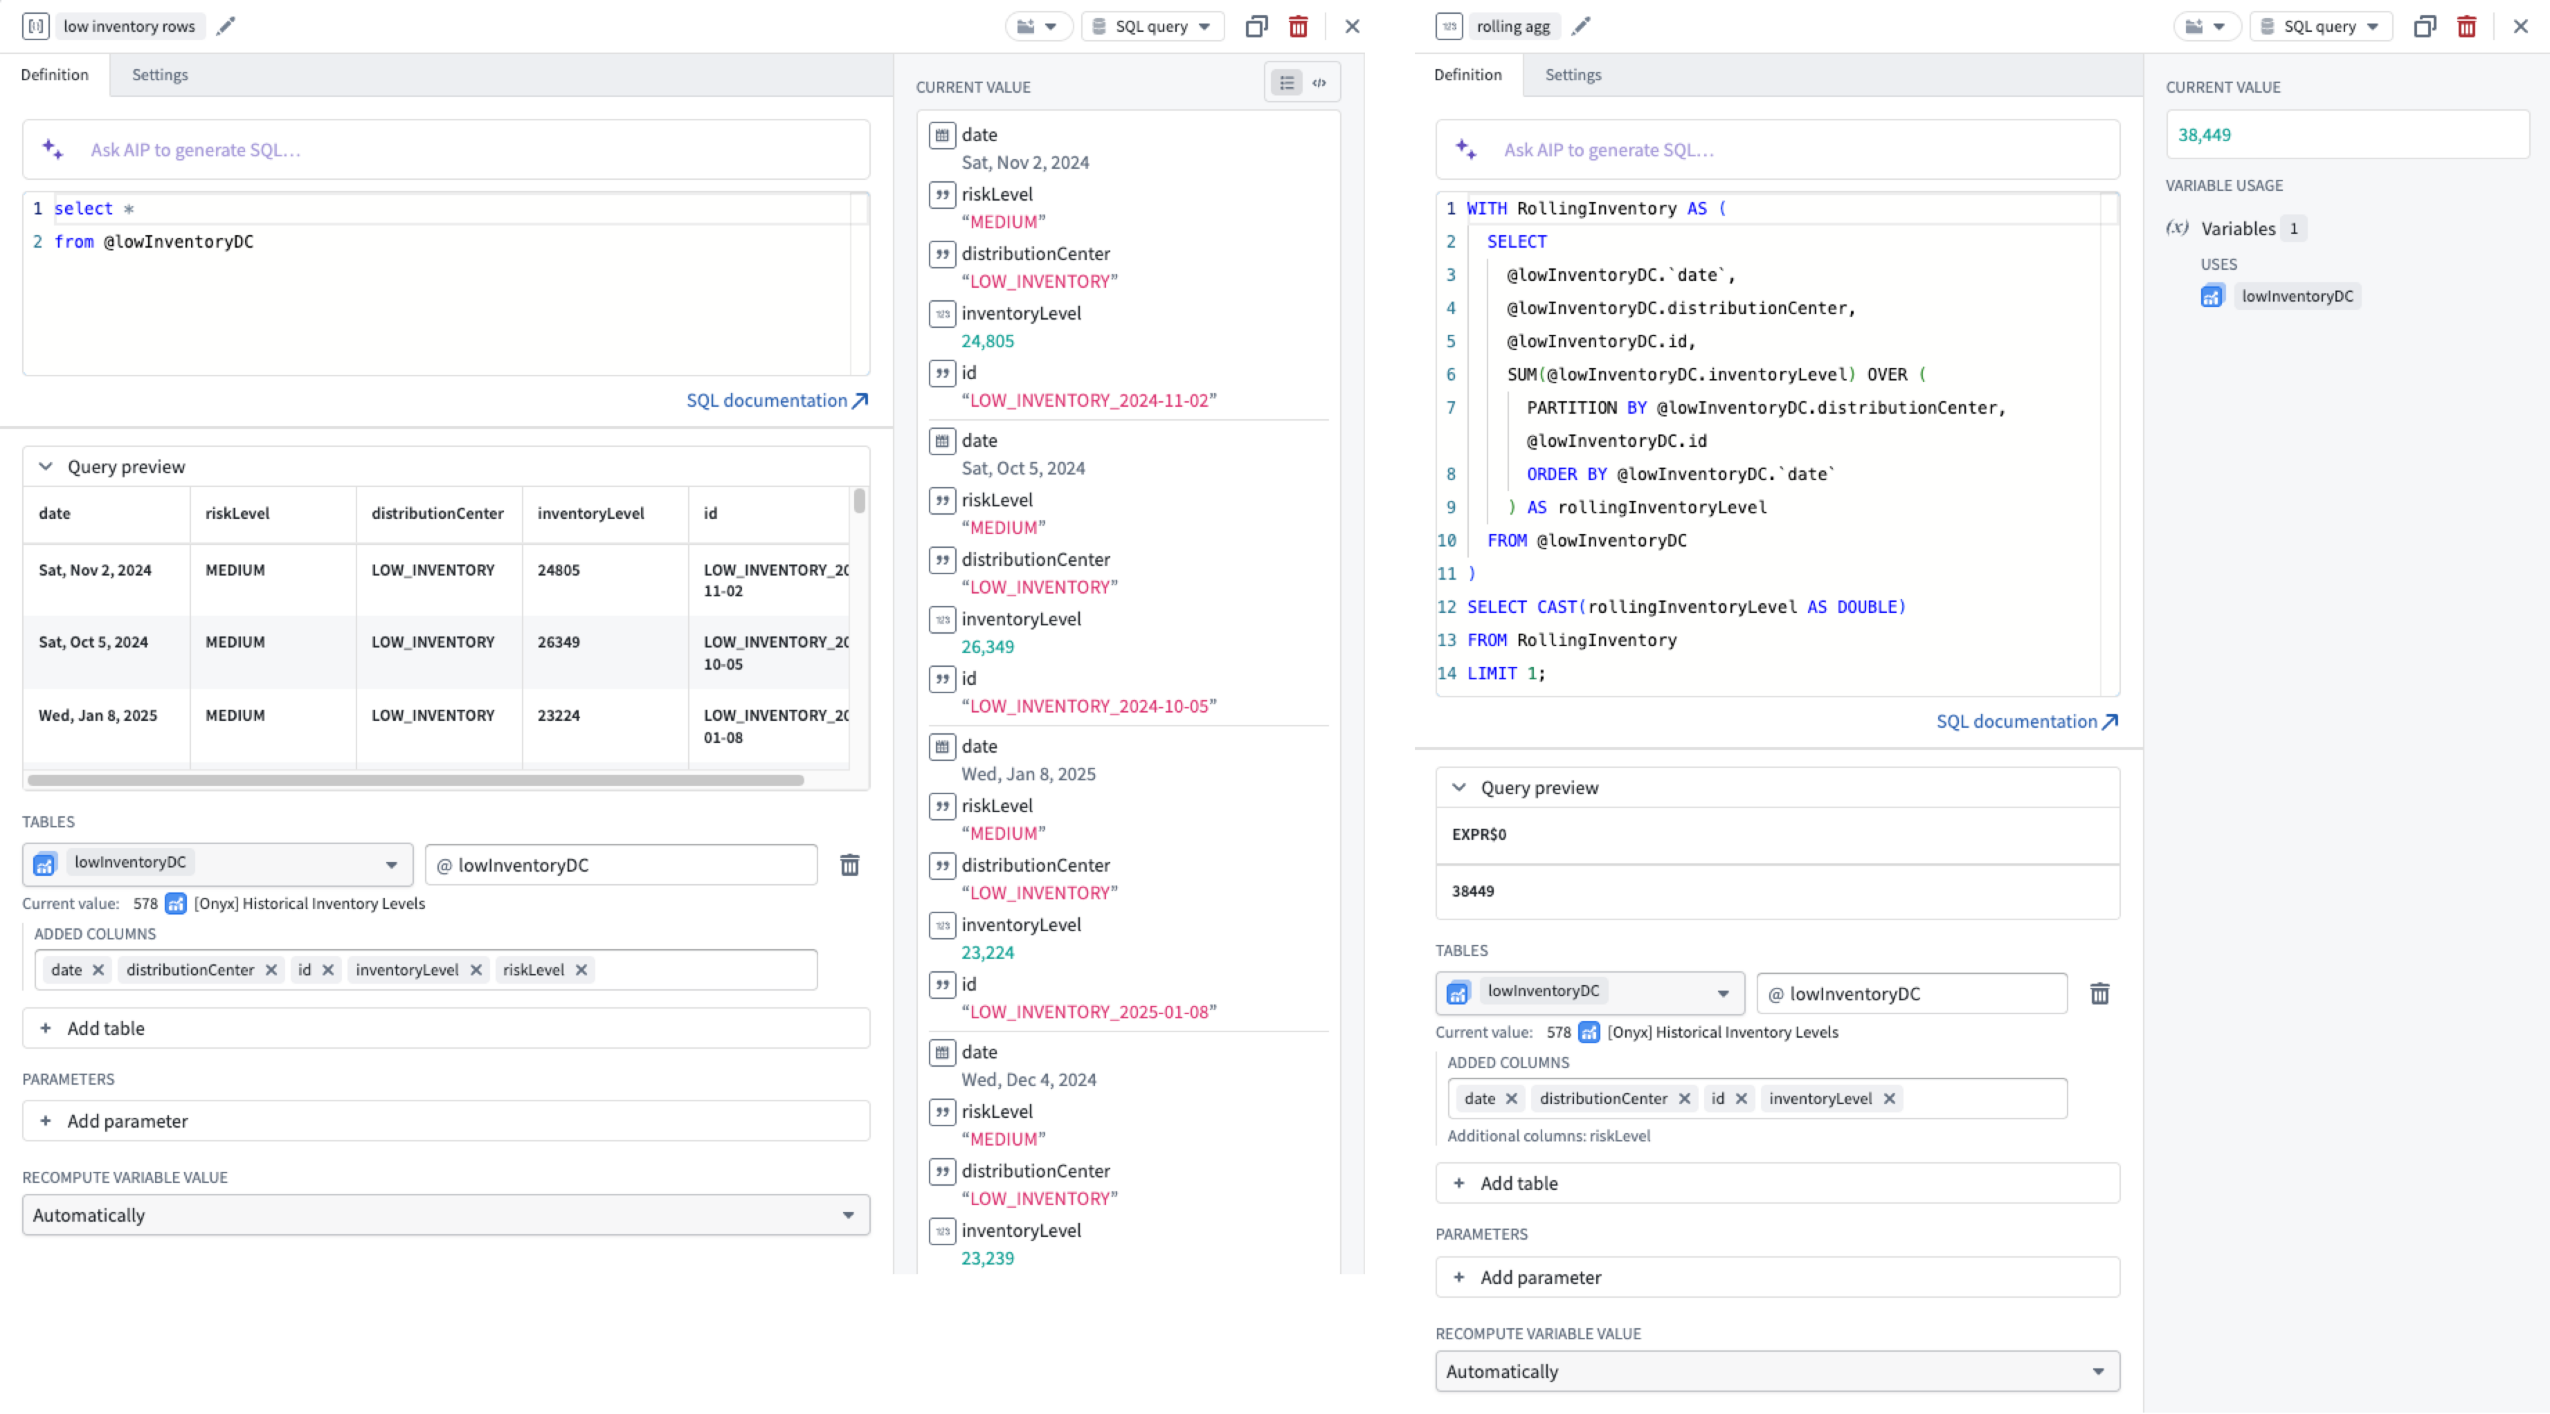
SQL query variable editors in Workshop, showing the AIP input field and code editor above the tables and parameters sections.
Some calculations are natural to express in SQL but awkward to write imperatively. Window functions such as RANK(), ROW_NUMBER(), LAG(), and LEAD() are a common example: computing a ranking, a running total, or a period-over-period comparison in a TypeScript function takes considerable code, while the equivalent SQL is a single statement. With SQL query variables you can write that logic where it lives and have it recompute automatically as its inputs change.
What you can do
To define a SQL query variable, set a variable's definition type to SQL query, then bind the inputs your query needs:
- Tables: Object set or interface set variables from your module are exposed to the query as tables, referenced with the
@aliassyntax. You can select, filter, join, group, and aggregate over them as you would any SQL table. - Parameters: Other variables can be bound as query parameters, also referenced with
@alias. The query recomputes whenever a bound parameter changes, so a value driven by a user selection or another variable stays current.
The editor can autocomplete your bound tables, columns, and parameters, and a Save and run action can execute the query and populate the variable. A Query preview panel below the editor shows the rows and columns your query actually returns, which remains useful while you are still shaping a query. Queries are written in Ontology SQL and run against your ontology data.
You can also generate a query from a natural language description with AIP. Describe the value you want to compute, and AIP produces SQL constrained to the Ontology SQL dialect and to the tables, columns, and parameters you have defined. Always review and validate the generated query before using the variable in a production application.
Supported result types
SQL query variables support single values, arrays, and structs:
- Single values for String, Numeric, Boolean, Date, and Timestamp variables, from a query returning one row and one column. This suits metrics and other individual derived values, such as a headcount, an average, or the name of a top-ranked object.
- Arrays of those same types, from a single-column query. Every row contributes to the array, and array-valued cells are flattened into one ordered list, useful for driving a filter or a selection set from a computed list of values.
- Structs and struct arrays, where the fields are derived from the columns your query returns rather than declared up front. A struct returns several related values from one query; for example a headcount, an average salary, and a top salary that widgets bind to field by field. A struct array returns one struct per row, which can drive a ranked list in a loop layout.
When to use SQL query variables
Consider where SQL query variables fit alongside existing options:
- Use a SQL query variable for logic scoped to a single Workshop application, where the calculation is most naturally written in SQL.
- Use SQL functions when the same business logic should be shared and reused across multiple applications and Foundry surfaces. SQL query variables are defined inside a single module and are not reusable elsewhere.
- Use a function-backed variable when the logic is easier to express in TypeScript or Python, or requires capabilities beyond a SQL
SELECTstatement.
What's next
Future releases will add support for join tables that allow you to join object sets or interfaces that have a many-to-many link.
Share your feedback
We want to hear about your experiences with SQL query variables in Workshop. Share your feedback with our Palantir Support channels or in our Developer Community ↗ using the workshop ↗ tag
Gemma 4 31B now available through AWS Bedrock
Date published: 2026-08-20
Gemma 4 31B is now available in AIP through AWS Bedrock for eligible commercial enrollments.
Model overviews
Gemma 4 31B ↗ is Google's 30-billion parameter dense open weights model supporting multimodal input across text and image, featuring a 256K token context window. Gemma 4 31B is available for commercial enrollments with Google | Bedrock enabled in Control Panel.
Getting started
To use these models:
- Confirm that your enrollment administrator has enabled the relevant model family.
- Review token costs and pricing.
- See the complete list of models available in AIP.
Your feedback matters
We want to hear about your experiences using language models in the Palantir platform and welcome your feedback. Share your thoughts with Palantir Support channels or on our Developer Community ↗ using the language-model-service tag ↗.
Gemini 3.7 Flash from Vertex AI is now available in AIP
Date published: 2026-08-20
Gemini 3.7 Flash is now available in AIP for non-georestricted, US georestricted, EU georestricted, IL2, IL4, and IL5 enrollments with Google Vertex AI enabled.
Model overview
Gemini 3.7 Flash is the next iteration in the Gemini 3 model family, featuring algorithmic improvements to its core reasoning foundation. For more information, review Google's Gemini 3.7 Flash model card ↗ and Google's model announcement ↗.
Availability
Gemini 3.7 Flash is available on:
- Non-georestricted commercial enrollments with Google Vertex AI enabled
- US georestricted commercial enrollments with Google Vertex AI enabled
- EU georestricted commercial enrollments with Google Vertex AI enabled
- IL2, IL4, and IL5 enrollments with Gemini through Google Vertex AI enabled
Getting started
To use this model:
- Confirm that your enrollment administrator has enabled the xAI model family.
- Review token costs and pricing.
- See the complete list of models available in AIP.
Your feedback matters
We want to hear about your experiences using language models in the Palantir platform and welcome your feedback. Share your thoughts with Palantir Support channels or on our Developer Community ↗ using the language-model-service tag ↗.
Grok 4.6 from xAI is now available in AIP
Date published: 2026-08-20
Grok 4.6 is now available in AIP on US georestricted and non-georestricted enrollments with xAI enabled.
Model overview
Grok 4.6 is xAI's latest model, optimized for long-running agents, complex coding and knowledge work, and ambitious interactive or visual projects. For more information, review xAI's Grok 4.6 announcement ↗.
Model metadata
- Context window: 500,000 tokens
- Modalities: Text and image input; text output
- Capabilities: Structured outputs, reasoning, and tool calling
Getting started
To use this model:
- Confirm that your enrollment administrator has enabled the xAI model family.
- Review token costs and pricing.
- See the complete list of models available in AIP.
Your feedback matters
We want to hear about your experiences using language models in the Palantir platform and welcome your feedback. Share your thoughts with Palantir Support channels or on our Developer Community ↗ using the language-model-service tag ↗.
Read, upload, and transform media in TypeScript and Python functions
Date published: 2026-08-20
Working with media in functions is now generally available. Functions can accept media items as inputs, upload new media, attach media to Ontology objects through Ontology edits and function-backed actions, and read both the bytes and the metadata of any media item. These capabilities are available for TypeScript v2, Python, and TypeScript v1 functions.
A function reads media from media sets; this means that functions can use documents, images, audio, and video that have already been ingested without having to export them somewhere else.
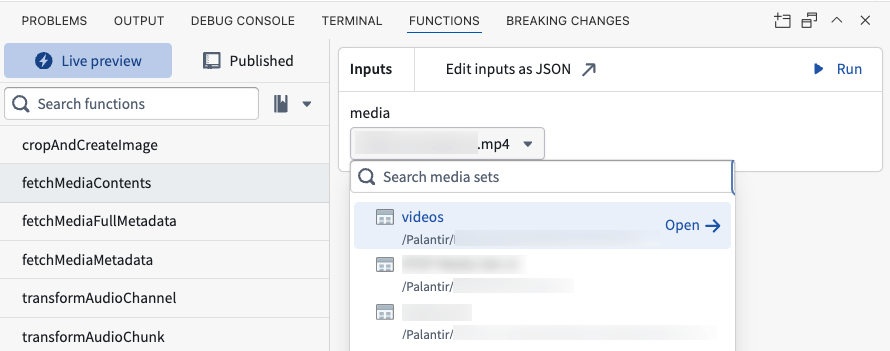
A function that takes a Media parameter, shown in live preview with a media item selected.
Capabilities of media in functions
- Accept and return media: Take a
Mediaas an input or return aMediaas an output, or readMediafrom a media reference property on an Ontology object. - Upload media from inside a function: Turn raw bytes into a
MediawithuploadMediain TypeScript v2 orclient.ontology.media.upload_mediain Python. Python also has an awaitableasync_upload_media. - Attach media to Ontology objects: Set a media property when you create or modify an object in an Ontology edit function, or pass a media reference in as an action parameter.
- Read bytes and metadata: Call
fetchContentsandfetchMetadatain TypeScript v2, orget_media_contentandget_media_metadatain Python. Python'sget_media_full_metadataand TypeScript v2'sfetchFullMetadatareturn format-specific fields such as page counts for documents or dimensions and bands for imagery. - Transform media: Rotate and re-encode images, run OCR on a document, render a PDF page as an image, slice a page range into a new PDF, or draw annotations onto an image.
- Select media in live preview: When you live-preview a function that takes a media parameter, you can now search your media sets and choose an item inline instead of manually pasting in a media reference.
Working with media in a function
TypeScript v2 and Python both use the Media type, which wraps a media reference and adds higher-level operations for reading contents and metadata and for attaching the media to an object. The examples below uploads raw bytes and returns the resulting Media:
import type { Client, Media } from "@osdk/client";
import { uploadMedia } from "@osdk/functions";

// Typescript V2
export default async function uploadMediaItem(
    client: Client,
    body: string,
    fileName: string,
): Promise<Media> {
    const blob = new Blob([body], { type: "text/plain" });
    const media: Media = await uploadMedia(client, { data: blob, fileName });
    return media;
}
from ontology_sdk import FoundryClient
from foundry_sdk_runtime.media import Media
from functions.api import function

# Python
@function
def upload_media(body: str, media_set_filename: str) -> Media:
    client = FoundryClient()
    media: Media = client.ontology.media.upload_media(
        body=body.encode("utf8"),
        filename=media_set_filename,
    )
    return media
Uploaded media is temporary until you set it on an Ontology object’s media reference property. When the Ontology edits are applied, the media persists on that property. Review the media documentation for the full set of examples, including Ontology edits and Action parameters. TypeScript v1 functions continue to use the MediaItem type, which has built-in operations for document text extraction, OCR, and audio transcription. Review the TypeScript v1 media documentation.
Media transformations
A transformation derives new media from existing media. You can rotate or re-encode an image, render a PDF page as a PNG, slice a page range into a new PDF, run OCR to recover text along with per-word bounding boxes, or draw annotations onto an image. The SDK submits the transformation job, polls it to completion, and returns the bytes to your function, so a single function can chain several steps: render each page, OCR that same page, then annotate the render with the boxes the OCR found.
Because transformations are in beta, call the SDK helpers rather than the media transformation endpoints directly. Use transform_and_wait or async_transform_and_wait on the generated Python client, and transformAndWait in TypeScript v2 (@osdk/api 2.55.0 or greater). The helpers keep transformation job details out of your function, so if those details change while the feature is in beta, your code does not have to change with them.The documentation has a worked example for each of these:
- Run page-by-page OCR on a PDF with bounding box output
- Render PDF pages as images and slice page ranges
- Annotate every page with detected bounding boxes
OCR on dense pages can exceed the default function execution timeout. See Manage published functions to configure a longer one.
Get started
Review the media in functions documentation for TypeScript v2, Python, and TypeScript v1 examples of the workflows described above.
Your feedback matters
We want to hear about your experience building functions over media and welcome your feedback. Share your thoughts with Palantir Support channels or on our Developer Community ↗ using the functions ↗ or media-sets ↗ tag.
Optimize builds with custom compute profiles in faster pipelines
Date published: 2026-08-20
You can now configure a custom compute profile in addition to the five standard profile sizes in faster pipelines backed by DataFusion ↗. Custom profiles let you set CPU and memory independently, and tune the DataFusion session parameters that control query partitioning, metadata reads, and output file layout.
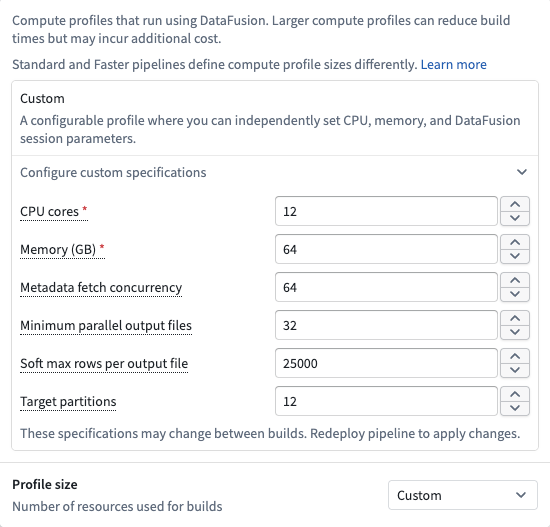
Configure custom specifications for a DataFusion pipeline.
To configure a custom profile, open Build settings, select Custom under Profile size, and expand Configure custom specifications.
Custom profile settings
A custom profile exposes two kinds of settings:
- Resources: CPU cores and memory are the total compute available to your build. A standard profile pairs them at a set ratio; a custom profile lets you set each one on its own. Both are required.
- DataFusion session parameters: The remaining settings tune the query engine rather than the resources it runs on: how work is divided for parallel execution, how many files are read at once, and how rows are distributed across output files. Each setting is optional, and leaving one unset keeps the DataFusion default.
Custom profile use cases
A custom profile is useful when a fixed size does not fit the shape of your workload:
- Decouple memory from cores: A pipeline that needs a large working set but little parallelism can request 2 cores with 60 GB of memory, rather than moving up to a larger fixed profile to reach the memory it needs.
- Scale CPU past the largest fixed profile: A custom profile accepts up to 32 cores.
- Increase query concurrency. Raise Target partitions above the default of one partition per core.
- Control output file layout: Use Soft max rows per output file and Minimum parallel output files to influence how many output files a build writes and how large each one is.
Available specifications
- CPU Cores: Number of virtual CPU cores assigned to the executor.
- Memory: Amount of memory assigned to the executor.
- Metadata fetch concurrency: Number of files to read in parallel when inferring schema and statistics.
- Minimum parallel output files: The minimum number of output files written in parallel.
- Soft max rows per output file: A soft limit on the number of rows per output file. Each output file will contain roughly this many rows.
- Target partitions: Number of partitions for query execution. Increasing partitions can increase concurrency.
Standard Spark-backed pipelines and faster pipelines define compute profiles differently, so the custom specifications described above apply only to faster pipelines. Learn more about compute profiles in Pipeline Builder.
Share your feedback
As we continue to add features to Pipeline Builder, we want to hear about your experiences and welcome your feedback. Share your thoughts with Palantir Support channels or our Developer Community ↗ using the pipeline-builder tag ↗.
Spot unhealthy resources in your workflow with failure rate color mode in Workflow Lineage
Date published: 2026-08-20
Workflow Lineage now includes a failure rate color mode that colors every action, function, and AIP Logic function node in your graph by the proportion of its runs that failed over a selected time window. This new feature shows where failures are concentrated across a given workflow, without needing to open each individual resource to check execution metrics.
Failure rate color mode is generally available on all enrollments starting the week of August 17, 2026.
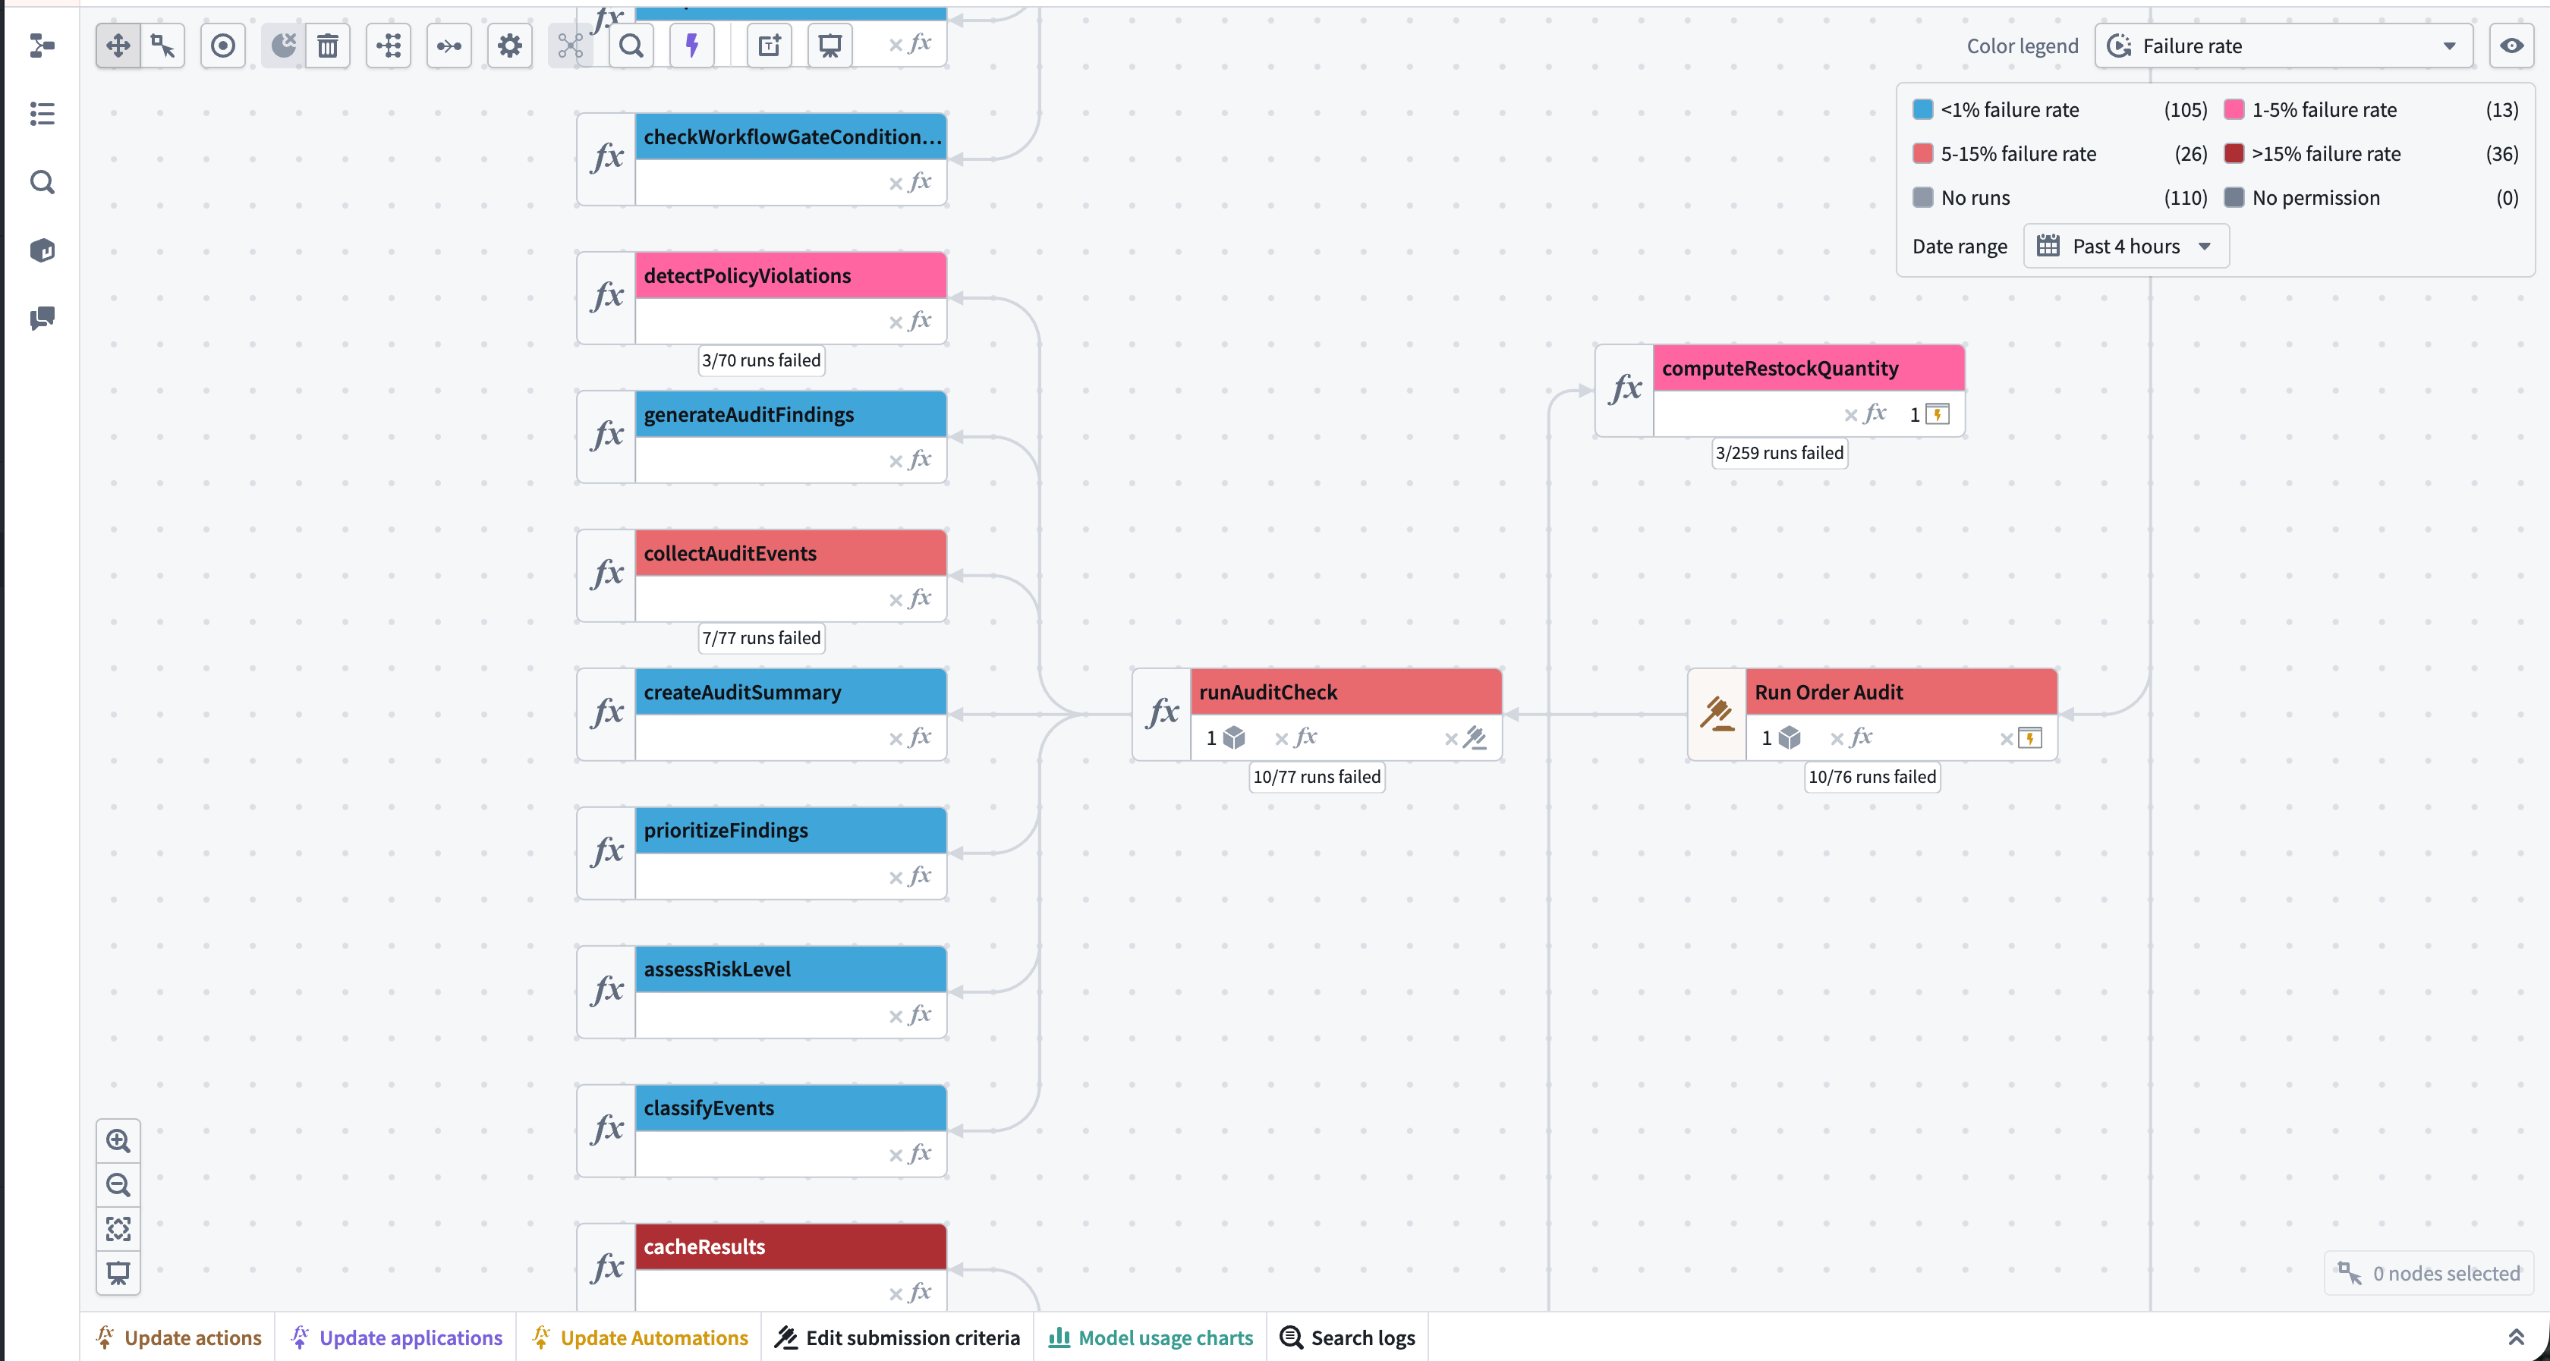
A Workflow Lineage graph colored by failure rate color, with failed run counts annotated on affected nodes.
Color your graph by failure rate
Open the color legend in the Workflow Lineage toolbar and select Failure rate under the Health group. Every action, function, and AIP Logic function node in your graph is then colored by its failure rate over the selected time window:
- Less than 1% failure rate
- 1-5% failure rate
- 5-15% failure rate
- Greater than 15% failure rate
- No runs: The resource had no executions in the selected time window or is not supported.
- No permission: You are not a Viewer on the resource, so its metrics are not visible to you. Review the log permissions documentation for more information.
Nodes with at least one failed run are annotated with their run counts (for example, 12/430 runs failed), so you can distinguish a resource that failed 3 times out of 5 from one that failed 300 times out of 500. Node types that do not execute, such as object types, Workshop applications, and language models, are not colored by this mode.
Choose the time window you care about
Use the Date range selector in the color mode configuration to set the window over which the failure rate is calculated. The default is the past four hours, and you can select any window up to one day, either as a shortcut duration or as a specific date range. Coloring refreshes approximately once a minute while the graph is open in a visible tab. If you select a relative window, such as the past four hours, that window moves forward with each refresh. A fixed date range will remain where you set it.
The same color mode supports different questions depending on the window you choose. A four-hour window shows current failures, useful during an active investigation. A one-day window includes overnight scheduled activity, which is helpful when checking whether an intermittent failure from a previous day has recovered.
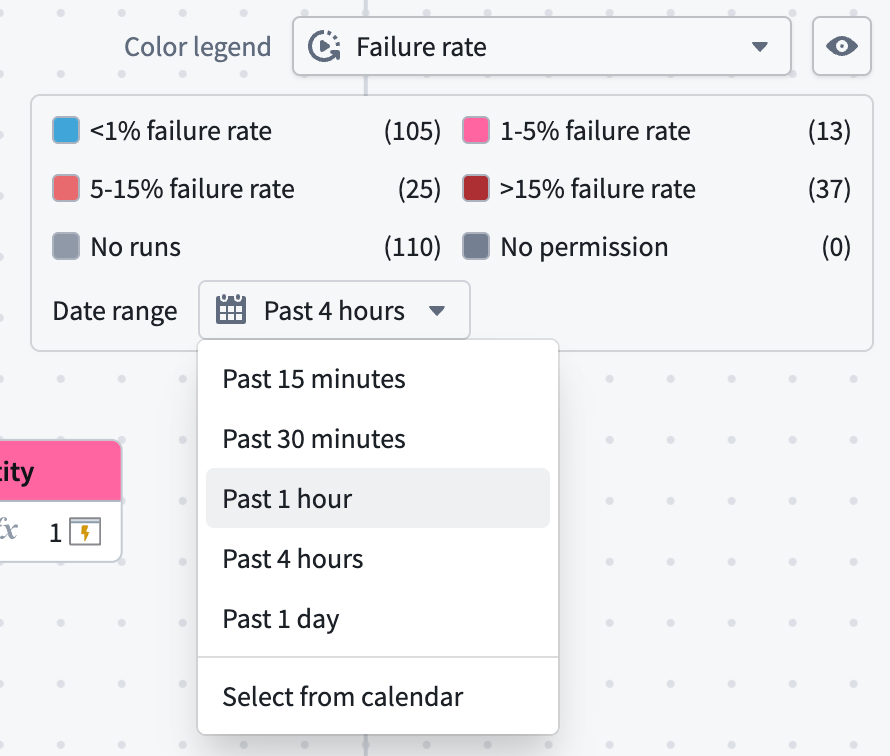
The failure rate color mode configuration panel, with the Date range selector showing available duration options.
When to use failure rate coloring
Failure rate coloring is a graph-wide triage view; it shows which resources in a workflow are failing and how failures are distributed. You can then select a node to view its execution metrics, execution history, and logs to determine why the failures are happening.
Learn more about metrics and observability in Workflow Lineage.
Tell us what you think
As we continue to develop Workflow Lineage, we want to hear about your experiences and welcome your feedback. Share your thoughts with Palantir Support channels or our Developer Community ↗ using the workflow-lineage ↗ tag.
AIP Analyst now supports AIP skills, analysis lookup, time series analysis, Ontology interfaces, and Foundry exports
Date published: 2026-08-18
AIP Analyst now supports new ways to capture reusable knowledge, analyze time series data, work with Ontology interfaces, and export results to Foundry resources.
Capture reusable knowledge with AIP skills and past analyses
Skills provide a first-class way to capture and share organizational knowledge. Users can configure which skills AIP Analyst has access to in the settings menu. AIP Analyst can load existing skills when they are relevant, create new skills from an analysis via the new export options, and modify existing skills. Skills are also supported as inputs to the AIP Analyst Workshop widget.
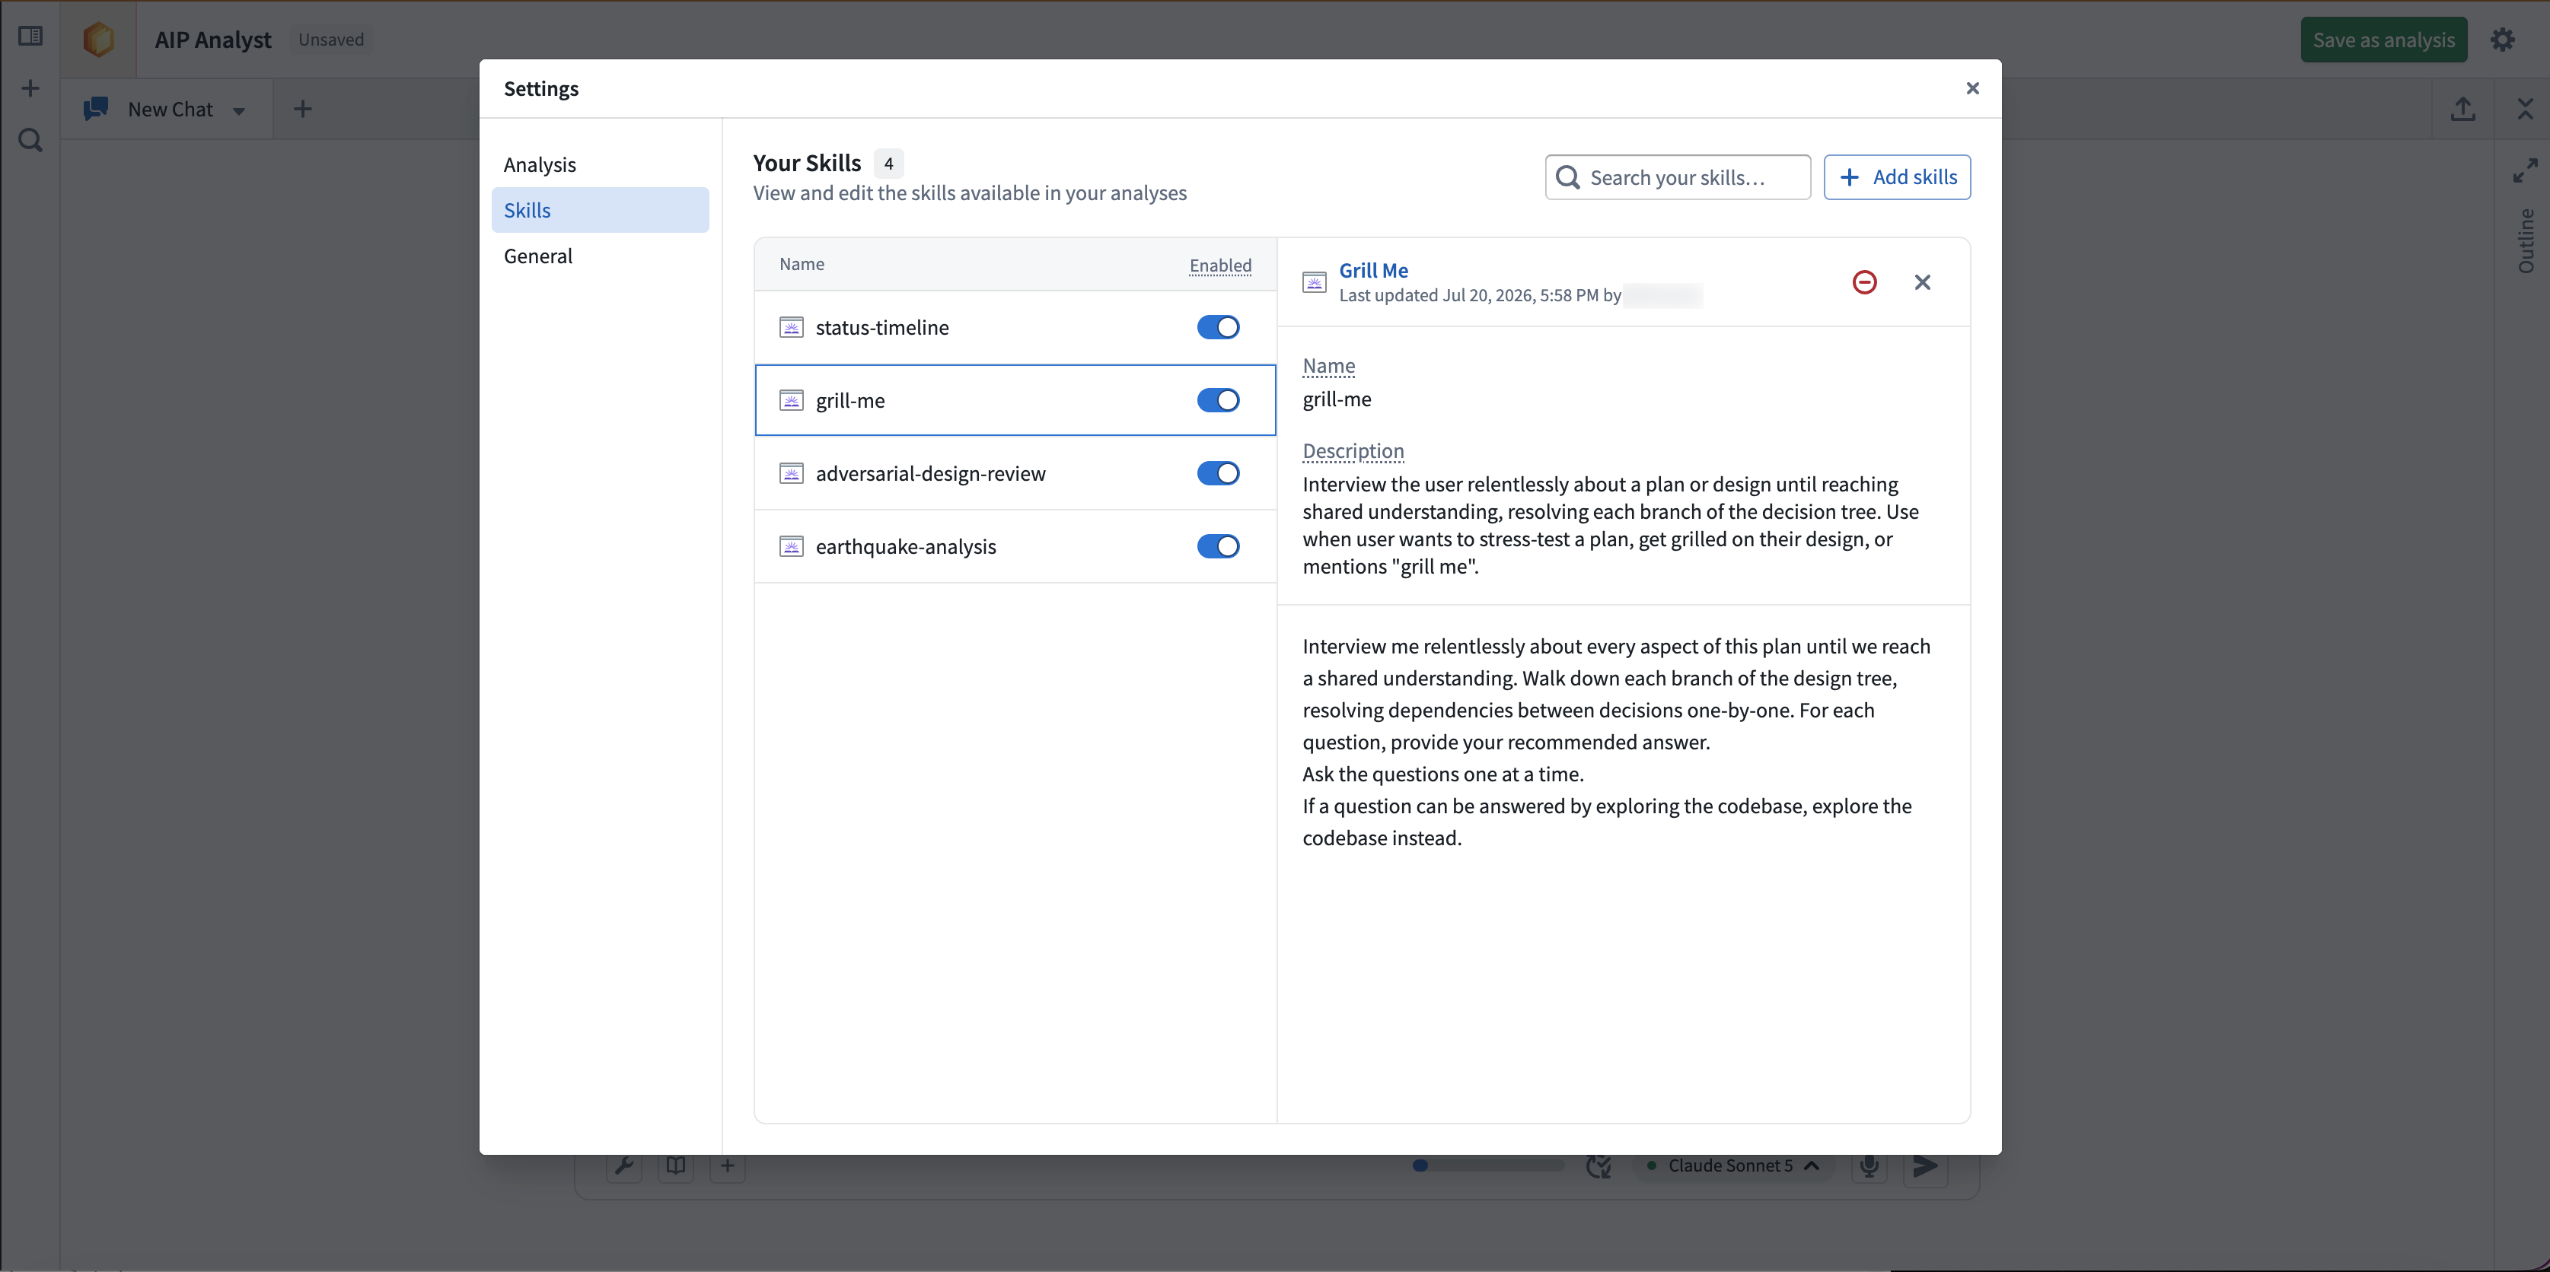
Configure what skills AIP Analyst has access to in the settings menu.
Additionally, the new Analysis lookup tool turns past analyses into a source of reusable knowledge. AIP Analyst can load a recent or favorite analysis by its RID directly into context, letting it understand how a related question was previously answered. The loaded analysis acts as a template: it shows what resources and tools were used, but carries no live results, so any relevant tool is rerun in the current analysis and always reflects current data.
Export conversations into Foundry resources
AIP Analyst now supports exporting conversations into a Notepad document, a Quiver analysis or dashboard, a Contour analysis, or an AIP skill. These tools are available in a redesigned Export button, which also includes the Print to PDF option. They are also available in-chat, by using a prompt such as “Export this conversation to a Notepad document”. These tools also support modifying existing resources, so you can ask for example “Update this notepad {notepadRid} with the results from this conversation”. To add these resource types to the conversation, select Add context, or drag and drop the resource into the chat window.
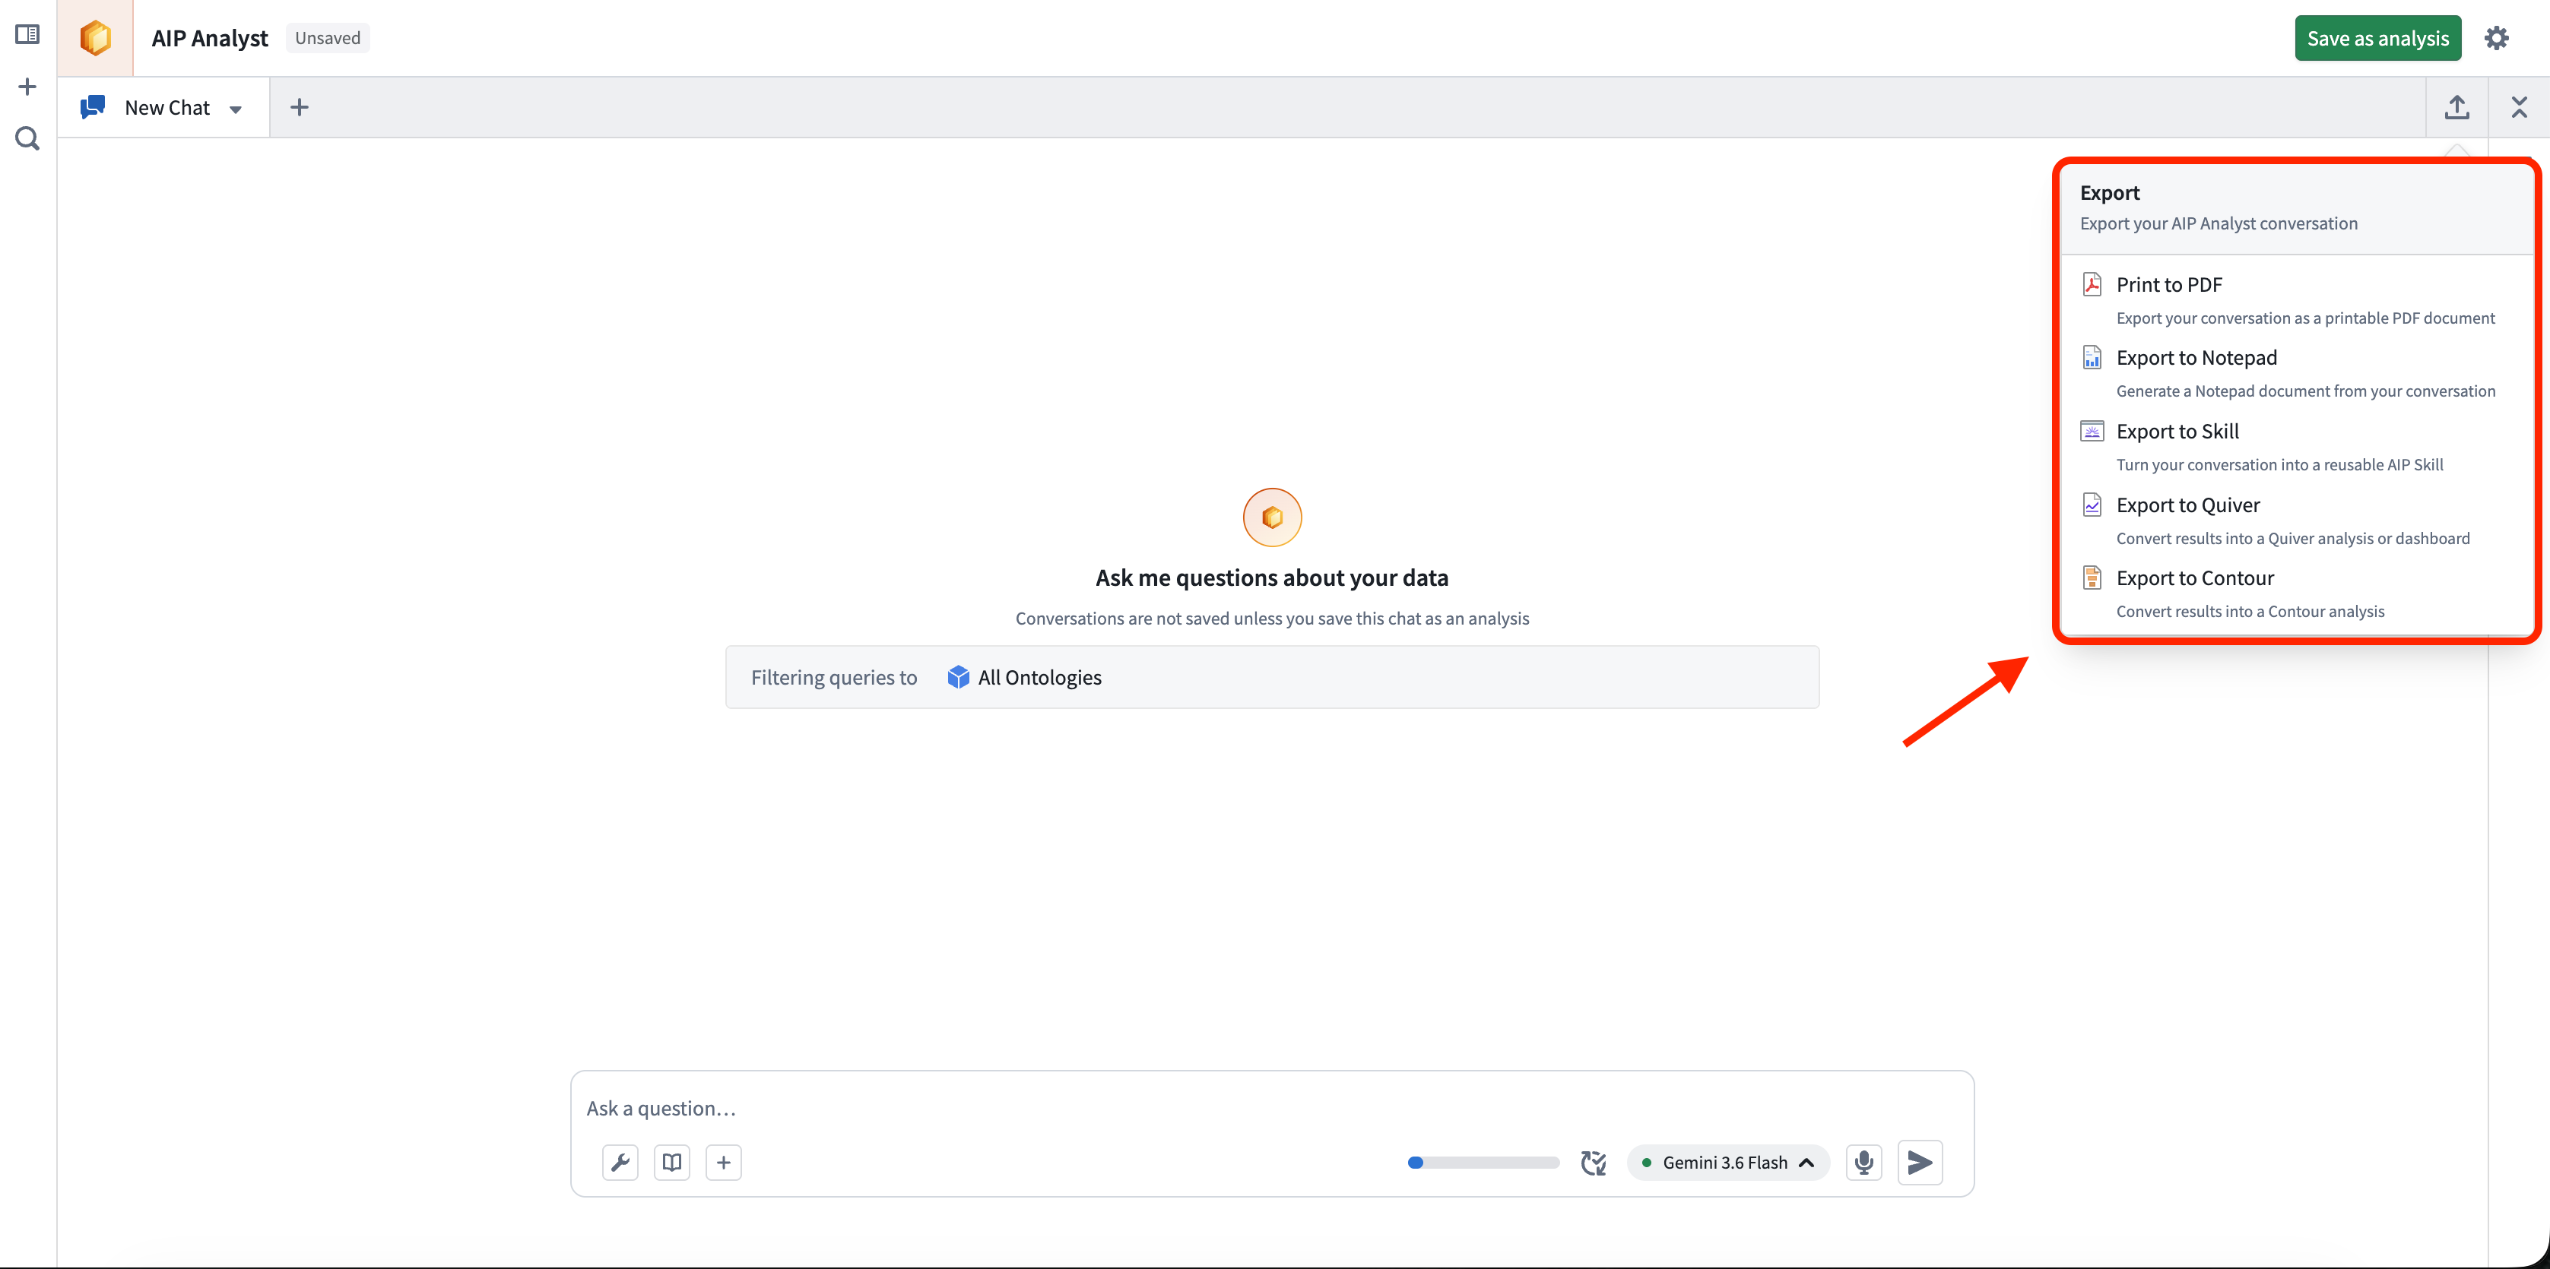
Open the export menu to export to PDF, Notepad, AIP Skills, Quiver, or Contour.
Analyze time series data
You can now import time series into your AIP Analyst chat in one of three ways:
- Add an object type with a time series property
- Add a time series property through the Add context button
- Add a time series sync using the Add context button
A full suite of time series transformations are available to manipulate the data, including filters, aggregates, mathematical operations, and event-based operations. You can export these time series charts into corresponding Quiver analyses and dashboards or included as Notepad images.
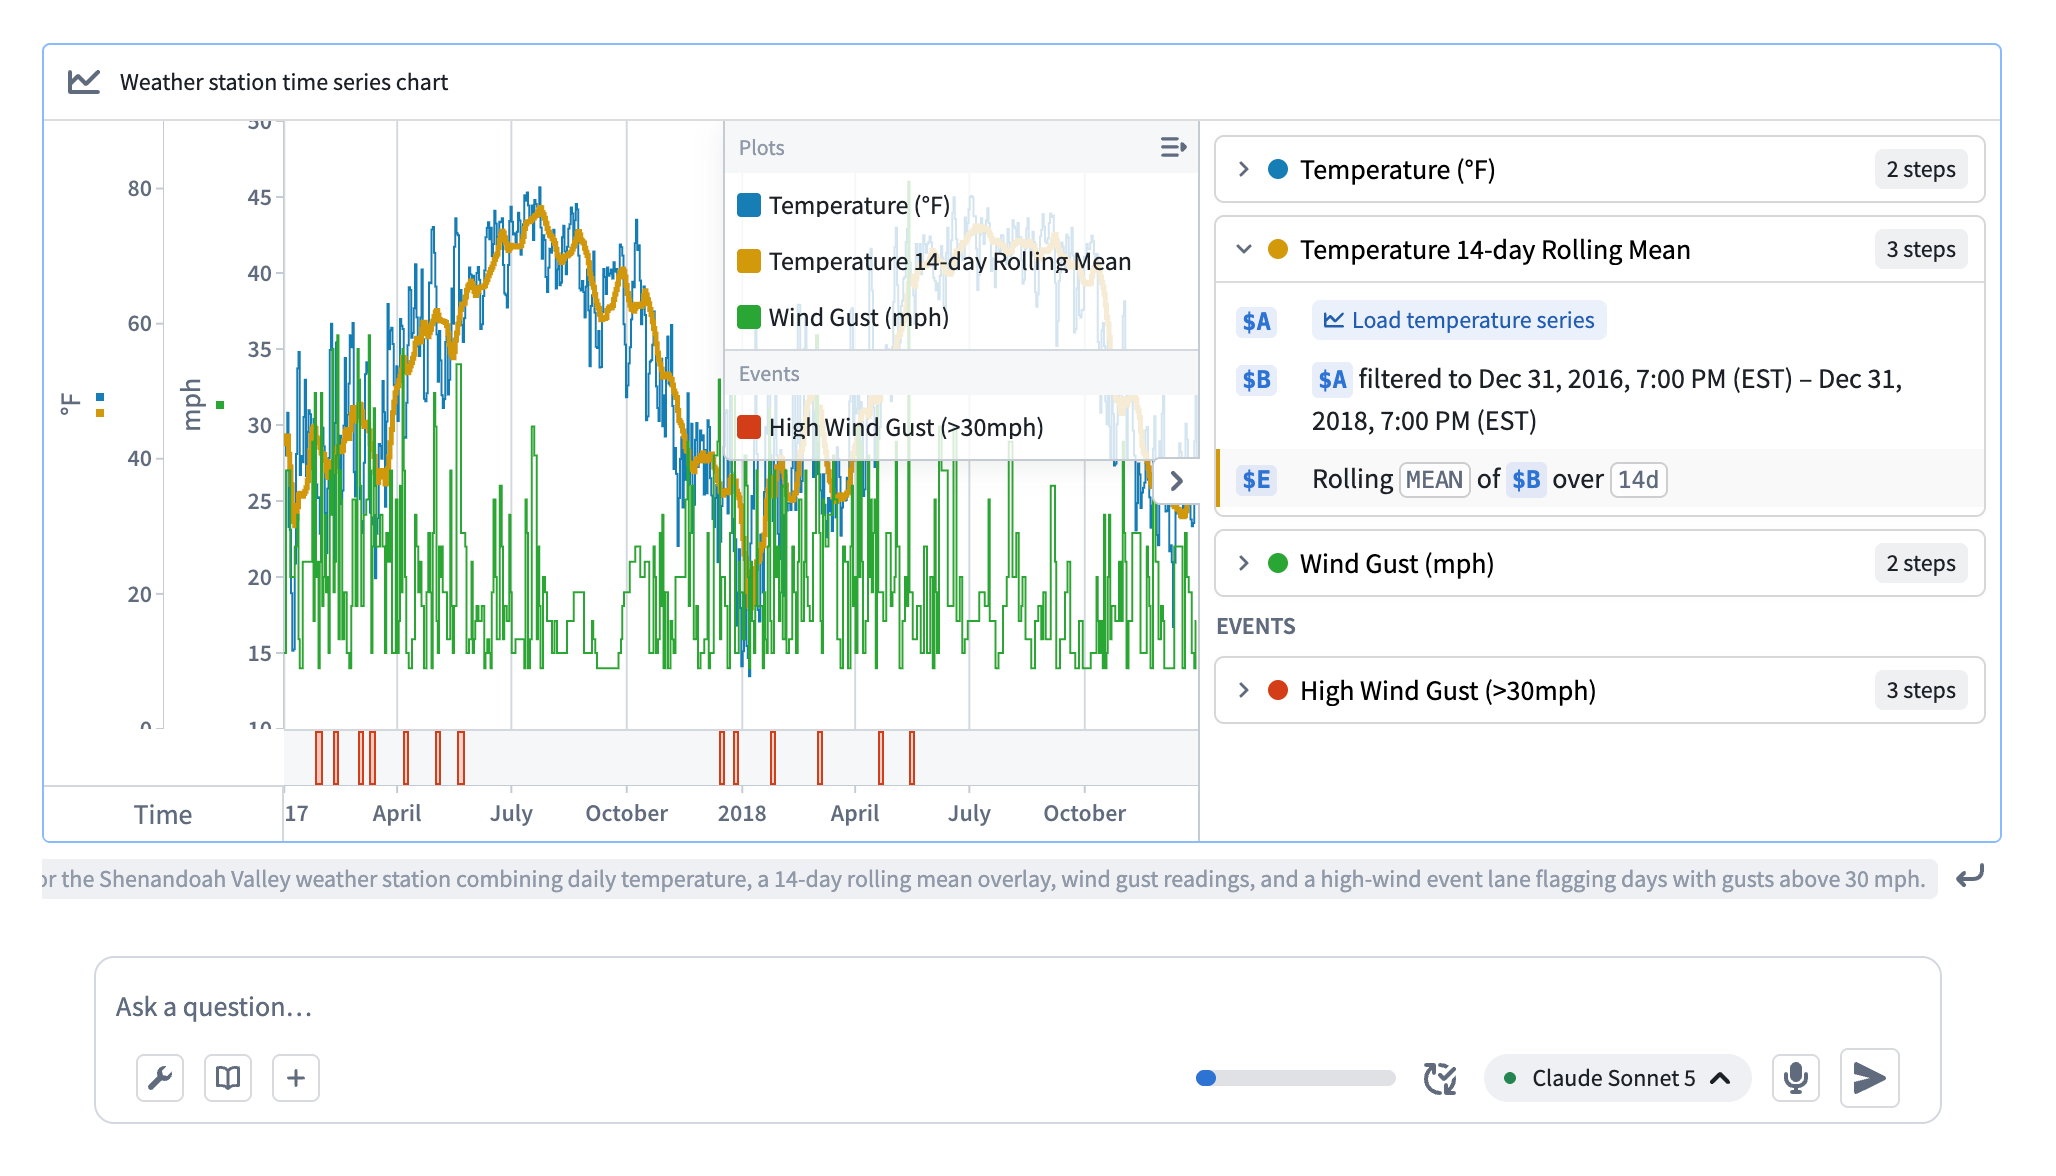
The time series transform tool uses built-in transform operations to analyze time series data at scale.
Work with Ontology interfaces
AIP Analyst now supports Ontology interfaces as a first class resource. You can import interfaces, search for them like object types, and use interface-scoped object sets in all of the regular object-set-supporting tools. Add them using the Add context button, or continue with your analyses as usual and they will be discovered by the object type search tool.
Alongside this change, AIP Analyst can now support multi-scope object sets. Unions, intersections, and differences can be created within AIP Analyst and consumed by most downstream tools, with warnings thrown if they are not. Both of these changes are compatible with Workshop.
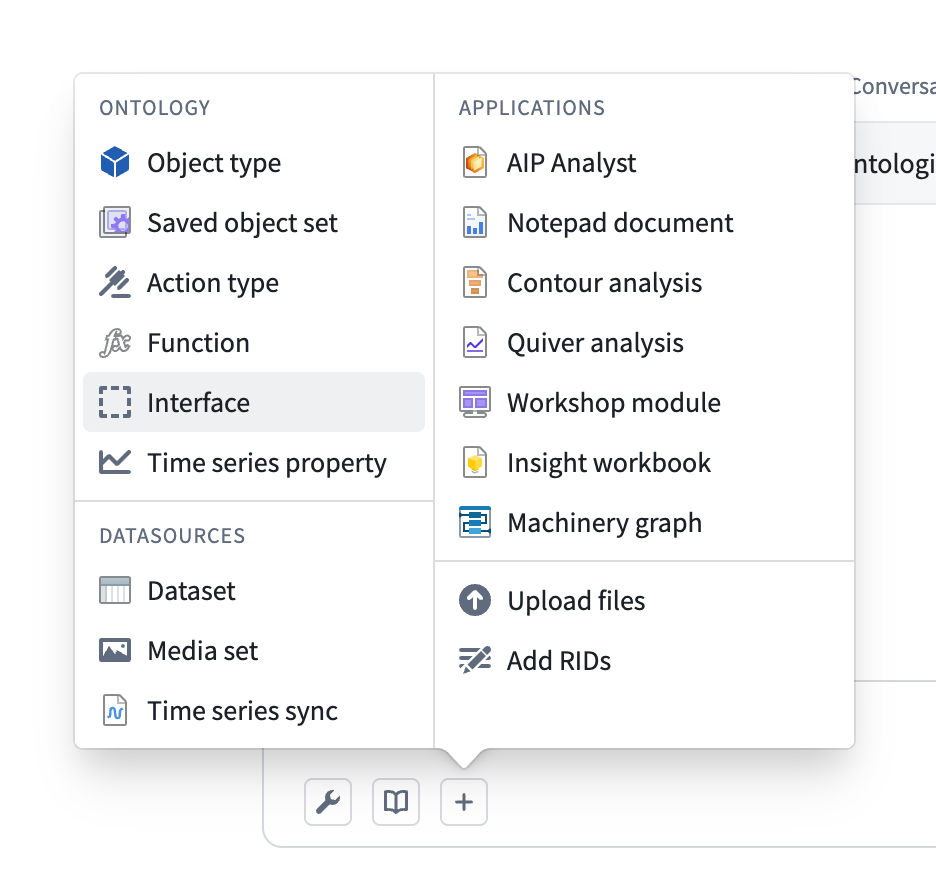
The Add context button supports adding many new options, such as interfaces.
We want to hear from you
We welcome your feedback on AIP Analyst, and your posts help the team prioritize what to build next. Share your thoughts with Palantir Support channels or our Developer Community ↗ using the aip-analyst ↗ tag.
Introducing AIP Evolve: Coordinate AI FDE agents to improve AI systems in Foundry
Date published: 2026-08-18
AIP Evolve is now available in beta for enrollments with AIP enabled and access to AI FDE. AIP Evolve coordinates fleets of AI FDE agents to improve AI systems in AIP. Define a target, optimization goal, validation strategy, and operational constraints, then review the resulting proposal and agent activity before merging changes.
Early adopters of AIP Evolve have used it to autonomously cut AI costs, improve eval performance, and migrate workloads to open source models. Learn more about AIP Evolve.
Key features
AIP Evolve supports iterative improvement workflows with the following features:
- Guided setup for model migration, cost reduction, latency reduction, evaluation score improvement, and custom goals.
- Flexible validation using selected test cases or existing evaluation suites.
- Configurable scoring criteria and acceptable output divergence.
- Agent constraints that control permitted change types and the maximum number of iterations.
- A proposal view containing proposed changes, validation results, output comparisons, supporting evidence, and confidence assessments.
- An interactive agent graph for monitoring progress and inspecting agent goals, insights, and artifacts.
- Integration with Global Branching for reviewing proposed changes before merging.
- The ability to resume an evolution in AI FDE with additional instructions.
Requirements
To use AIP Evolve:
- Enable AIP and ensure that you can access AI FDE.
- Install the AIP Evolve Marketplace product in an Ontology.
- Ensure that you have access to the target resource and any data or evaluation suites used for validation.
Getting started
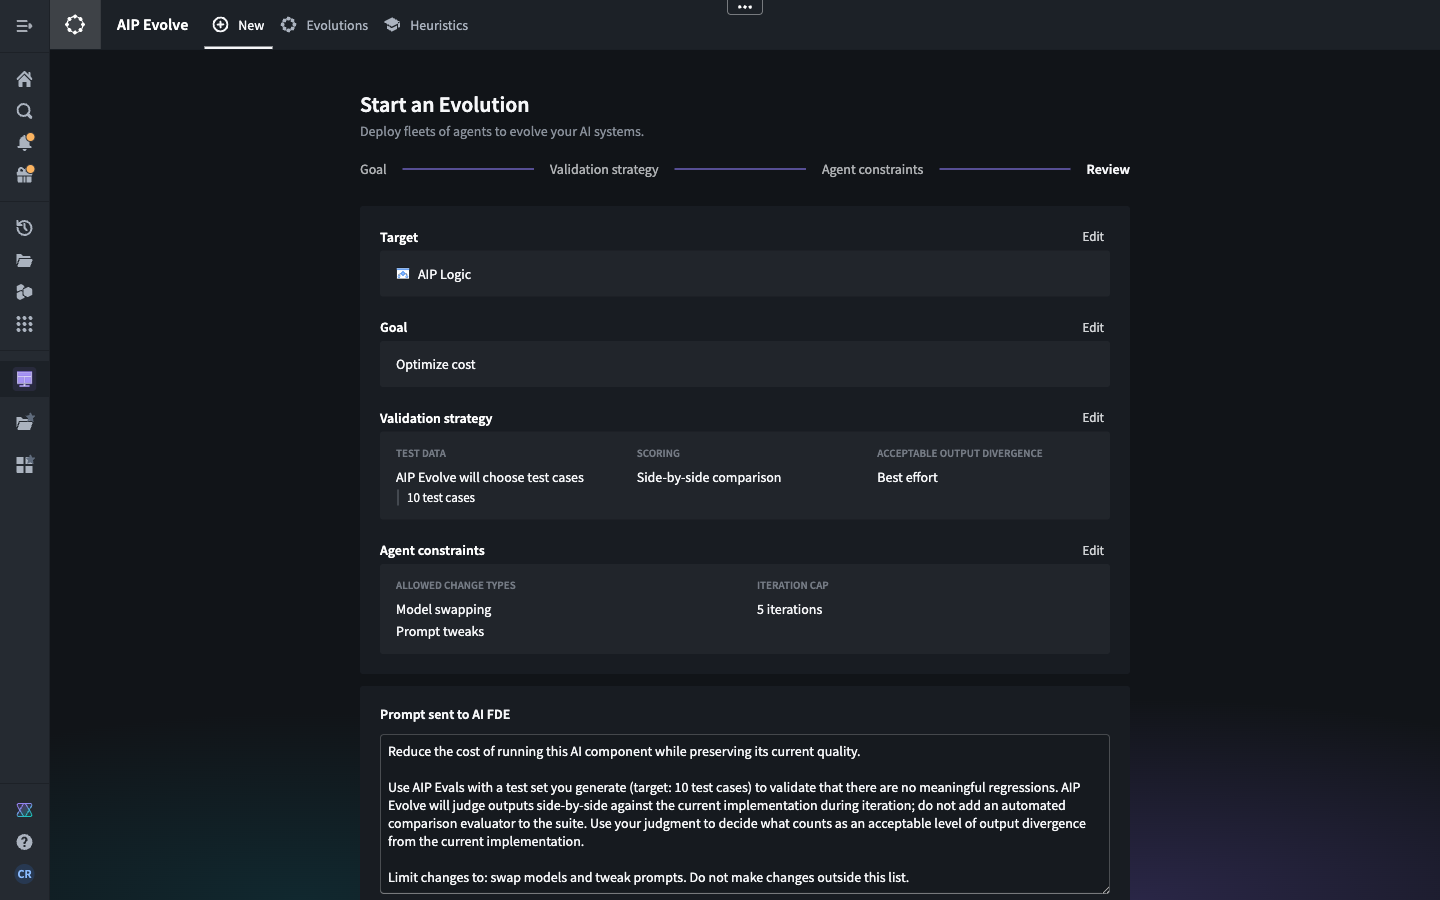
The AIP Evolve setup screen, showing the "Review" stage with a fully specified evolution.
Open AIP Evolve and select New to create an evolution. Select the Foundry resource you want to evolve, then configure the following:
- Goal: Choose a predefined optimization goal or describe a custom objective.
- Validation strategy: Define the test data, scoring approach, and acceptable output divergence.
- Agent constraints: Select the types of changes agents may propose and set an iteration policy.
Review the generated prompt, then select Evolve. AIP Evolve opens AI FDE in a new tab and starts the evolution. You can also select Write custom prompt to provide your own instructions.
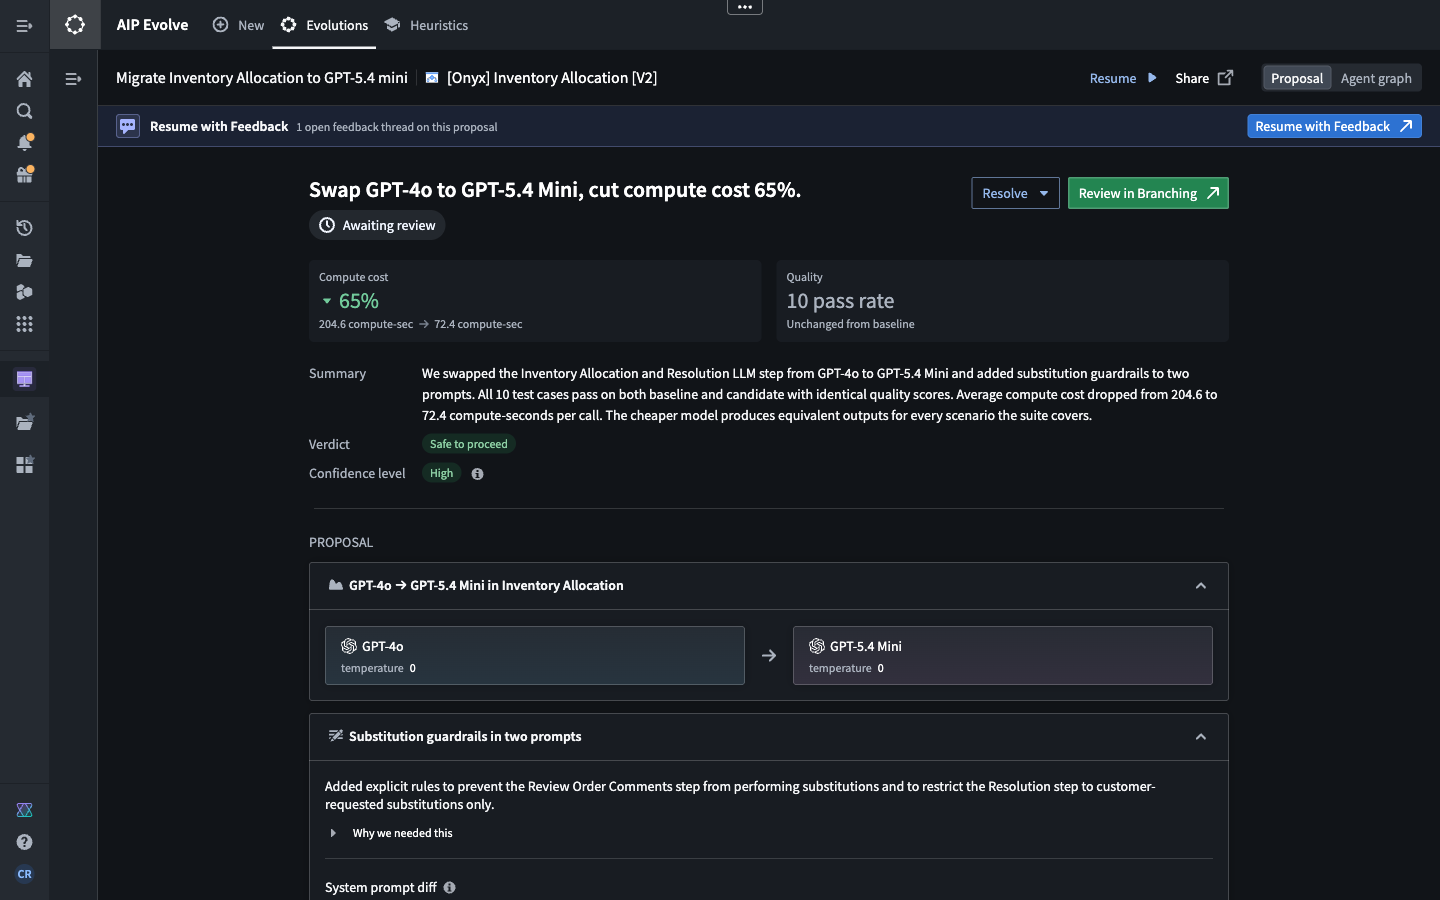
An example AIP Evolve proposal, where the system presents a model swap for cost reduction and the evidence that supports why the change is safe to make.
Open Evolutions to monitor active and completed evolutions. Use Proposal to review results and proposed changes, or Agent graph to inspect the agents involved in the evolution. When a proposal is ready, open it in Global Branching for final review and merging.
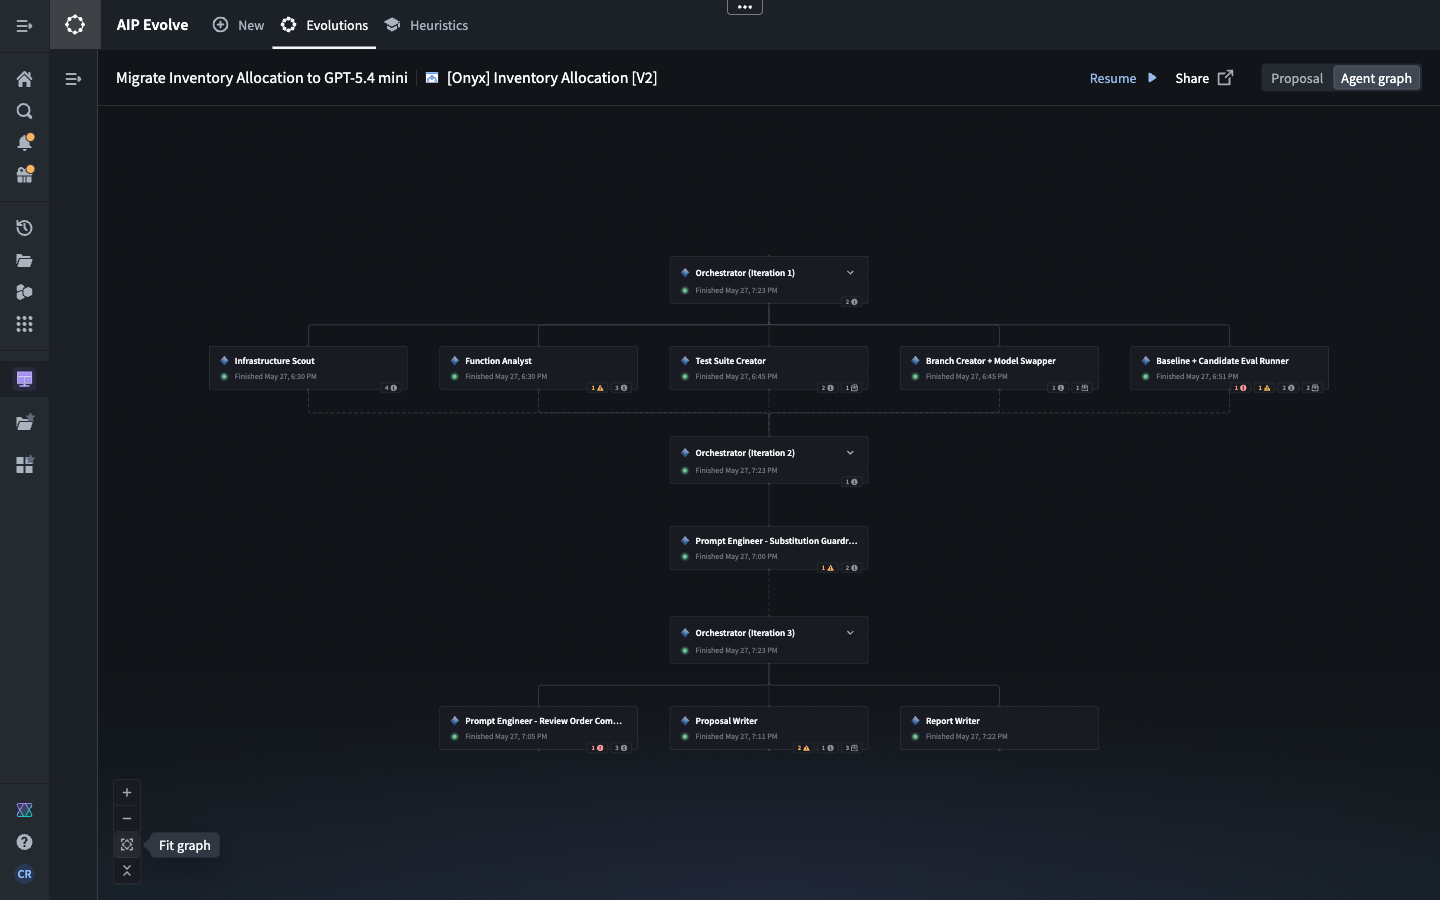
The AIP Evolve agent graph, showing each of the subagents that were spawned along the way to optimize the target AI component.
Your feedback matters
As we continue developing AIP Evolve, we welcome feedback about your experience. Share your thoughts through Palantir Support channels.
Process two streams with custom logic using CoProcess user-defined functions in Pipeline Builder
Date published: 2026-08-13
CoProcess user-defined functions (UDFs) are now supported in Pipeline Builder. A keyed CoProcess UDF allows users to define custom stateful logic for processing events from two different streams and merging them into a single output stream.
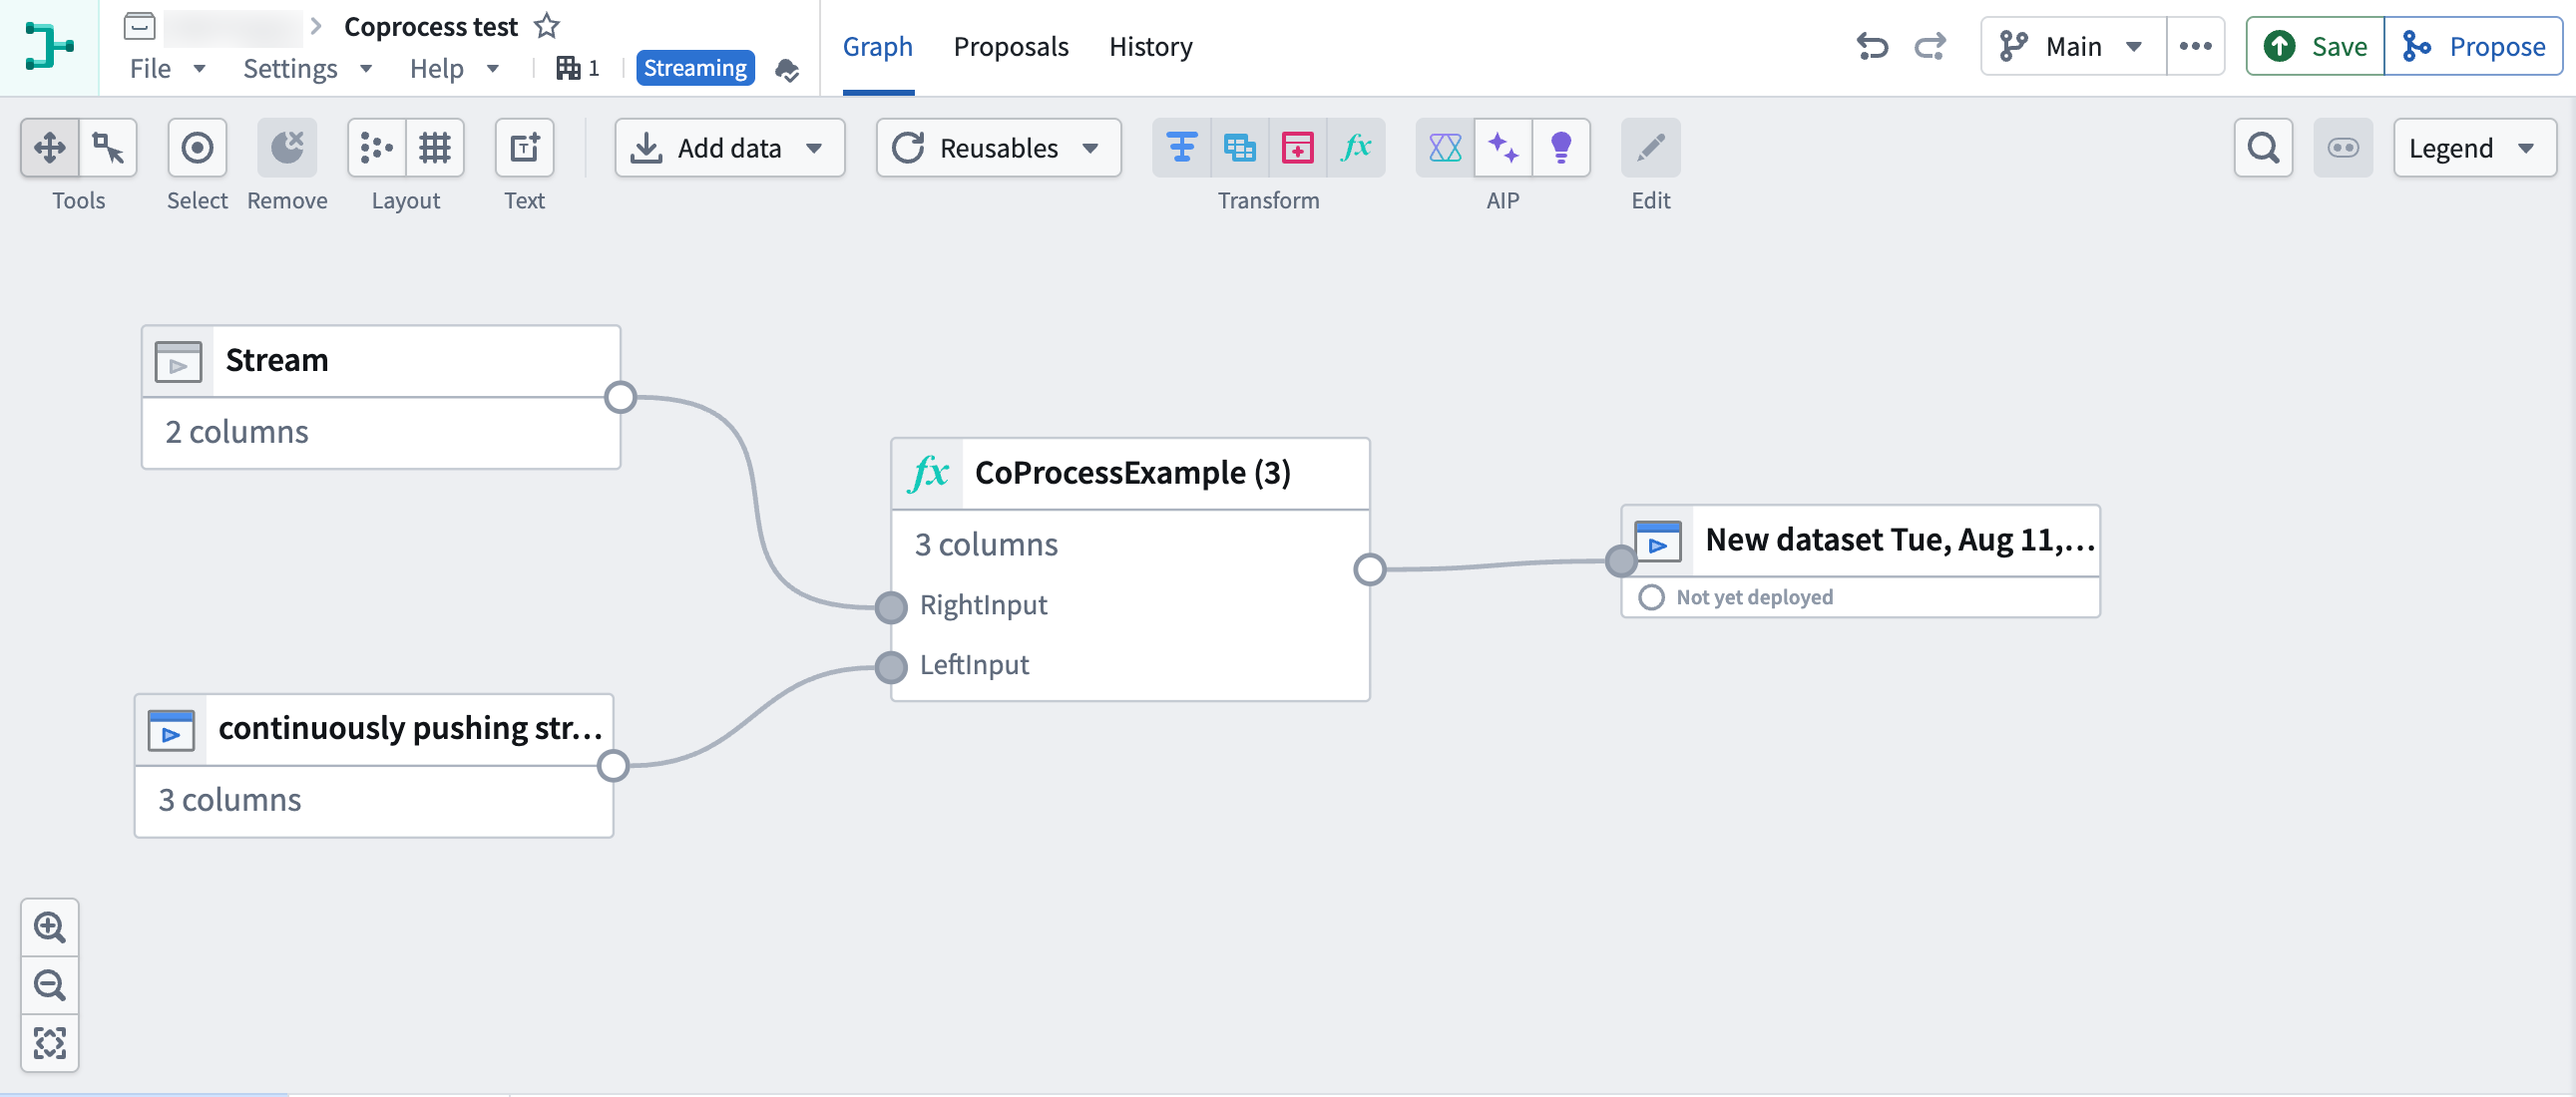
A keyed CoProcess UDF takes a separate stream on each of its left and right inputs.
Rows can be processed and emitted from either stream, which allows sophisticated real-time pipelines that go beyond standard join patterns. As with any stateful UDF, keyed CoProcess UDFs can be imported into a pipeline and used like any other transform.
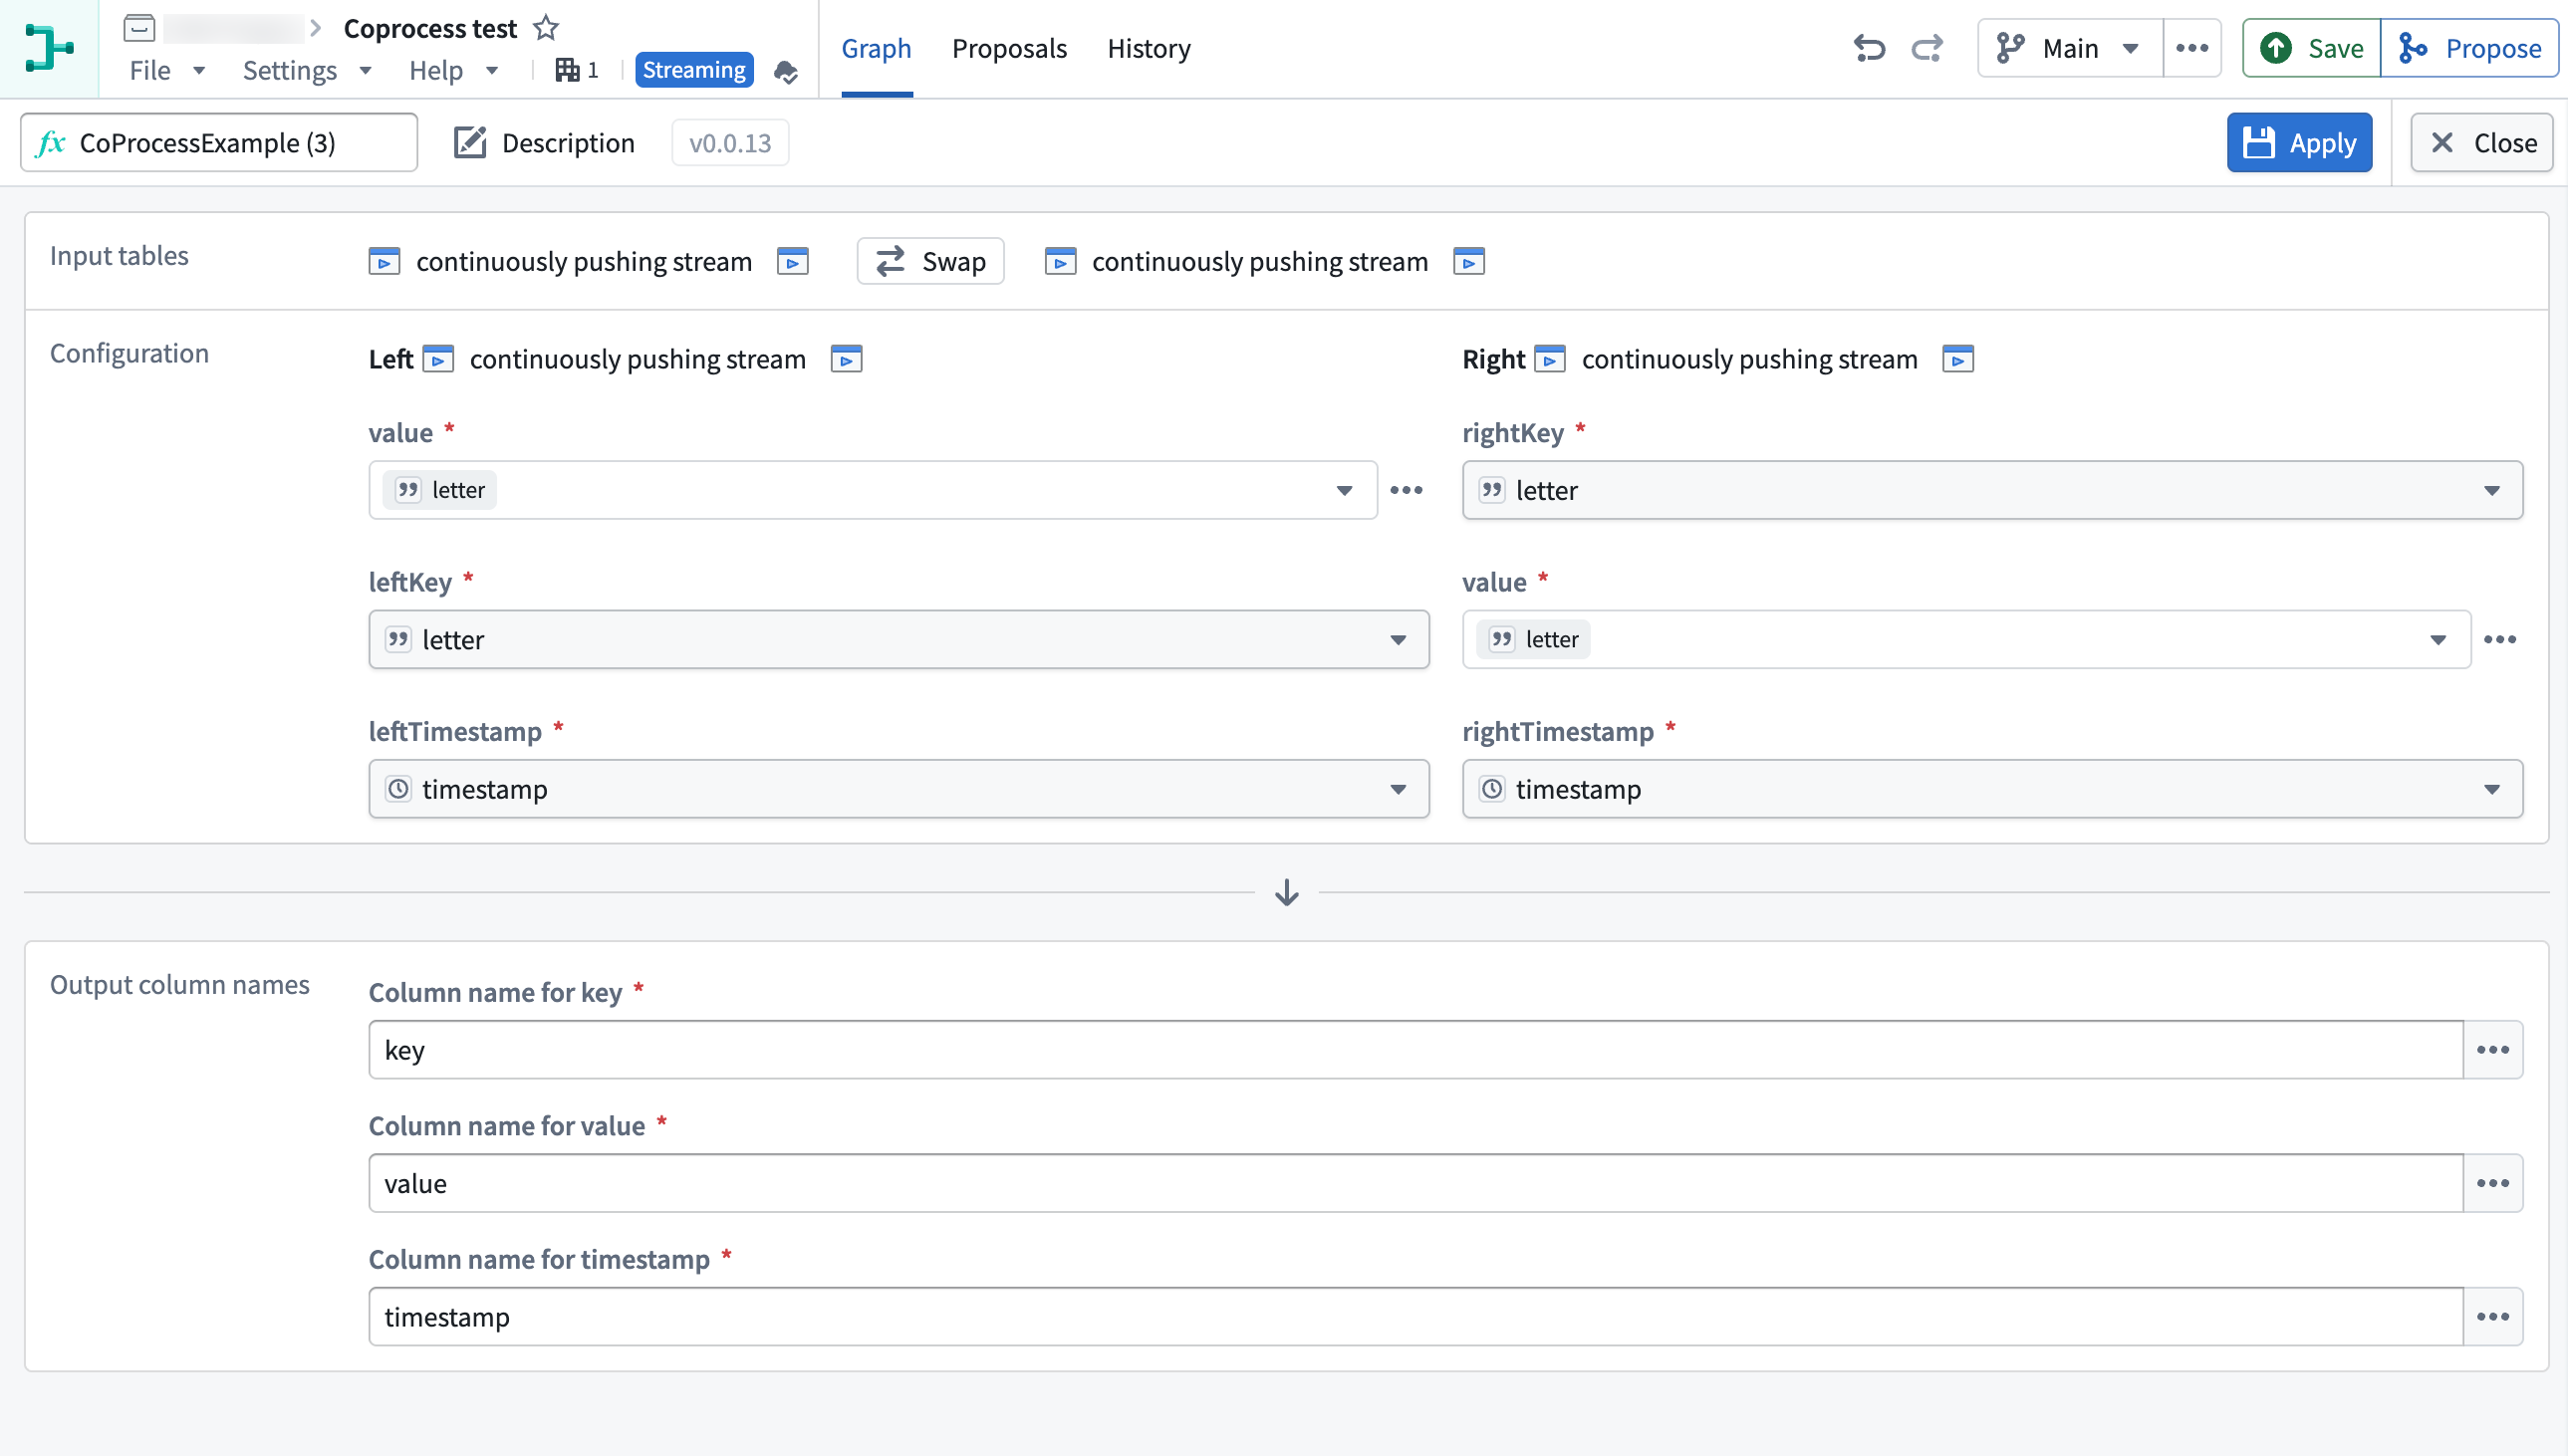
Configure a keyed CoProcess UDF by mapping the columns of each input to the UDF.
What's new
With keyed CoProcess UDFs, you can:
- Maintain custom state across both input streams. State is shared between the two inputs rather than scoped to a single stream.
- Emit output rows from either stream independently. Neither stream has to wait on the other to produce output.
- Implement complex matching logic that standard joins cannot express.
Example use cases
- Flight tracking: Join a stream of live aircraft positions with flight plan schedule updates to detect route deviations in real time.
- Supply chain: Join shipment tracking events with inventory updates to suggest restocking before a warehouse runs out.
- Wildfire alerting: Join satellite thermal detections with ground-level weather data to escalate alerts when hotspots coincide with high-risk conditions.
Share your feedback
As we continue to add features to Pipeline Builder, we want to hear about your experiences and welcome your feedback. Share your thoughts with Palantir Support channels or our Developer Community using the pipeline-builder tag ↗.
Observe and optimize your agents, objects, and workflows with object timeline
Date published: 2026-08-11
The new object timeline feature provides observability into actions performed on an object. See edits performed by agents or by manual action along with full attribution for each one. Monitor token usage, runtime, and agentic coverage to find where to optimize. Trace any edit back to the execution that made it.
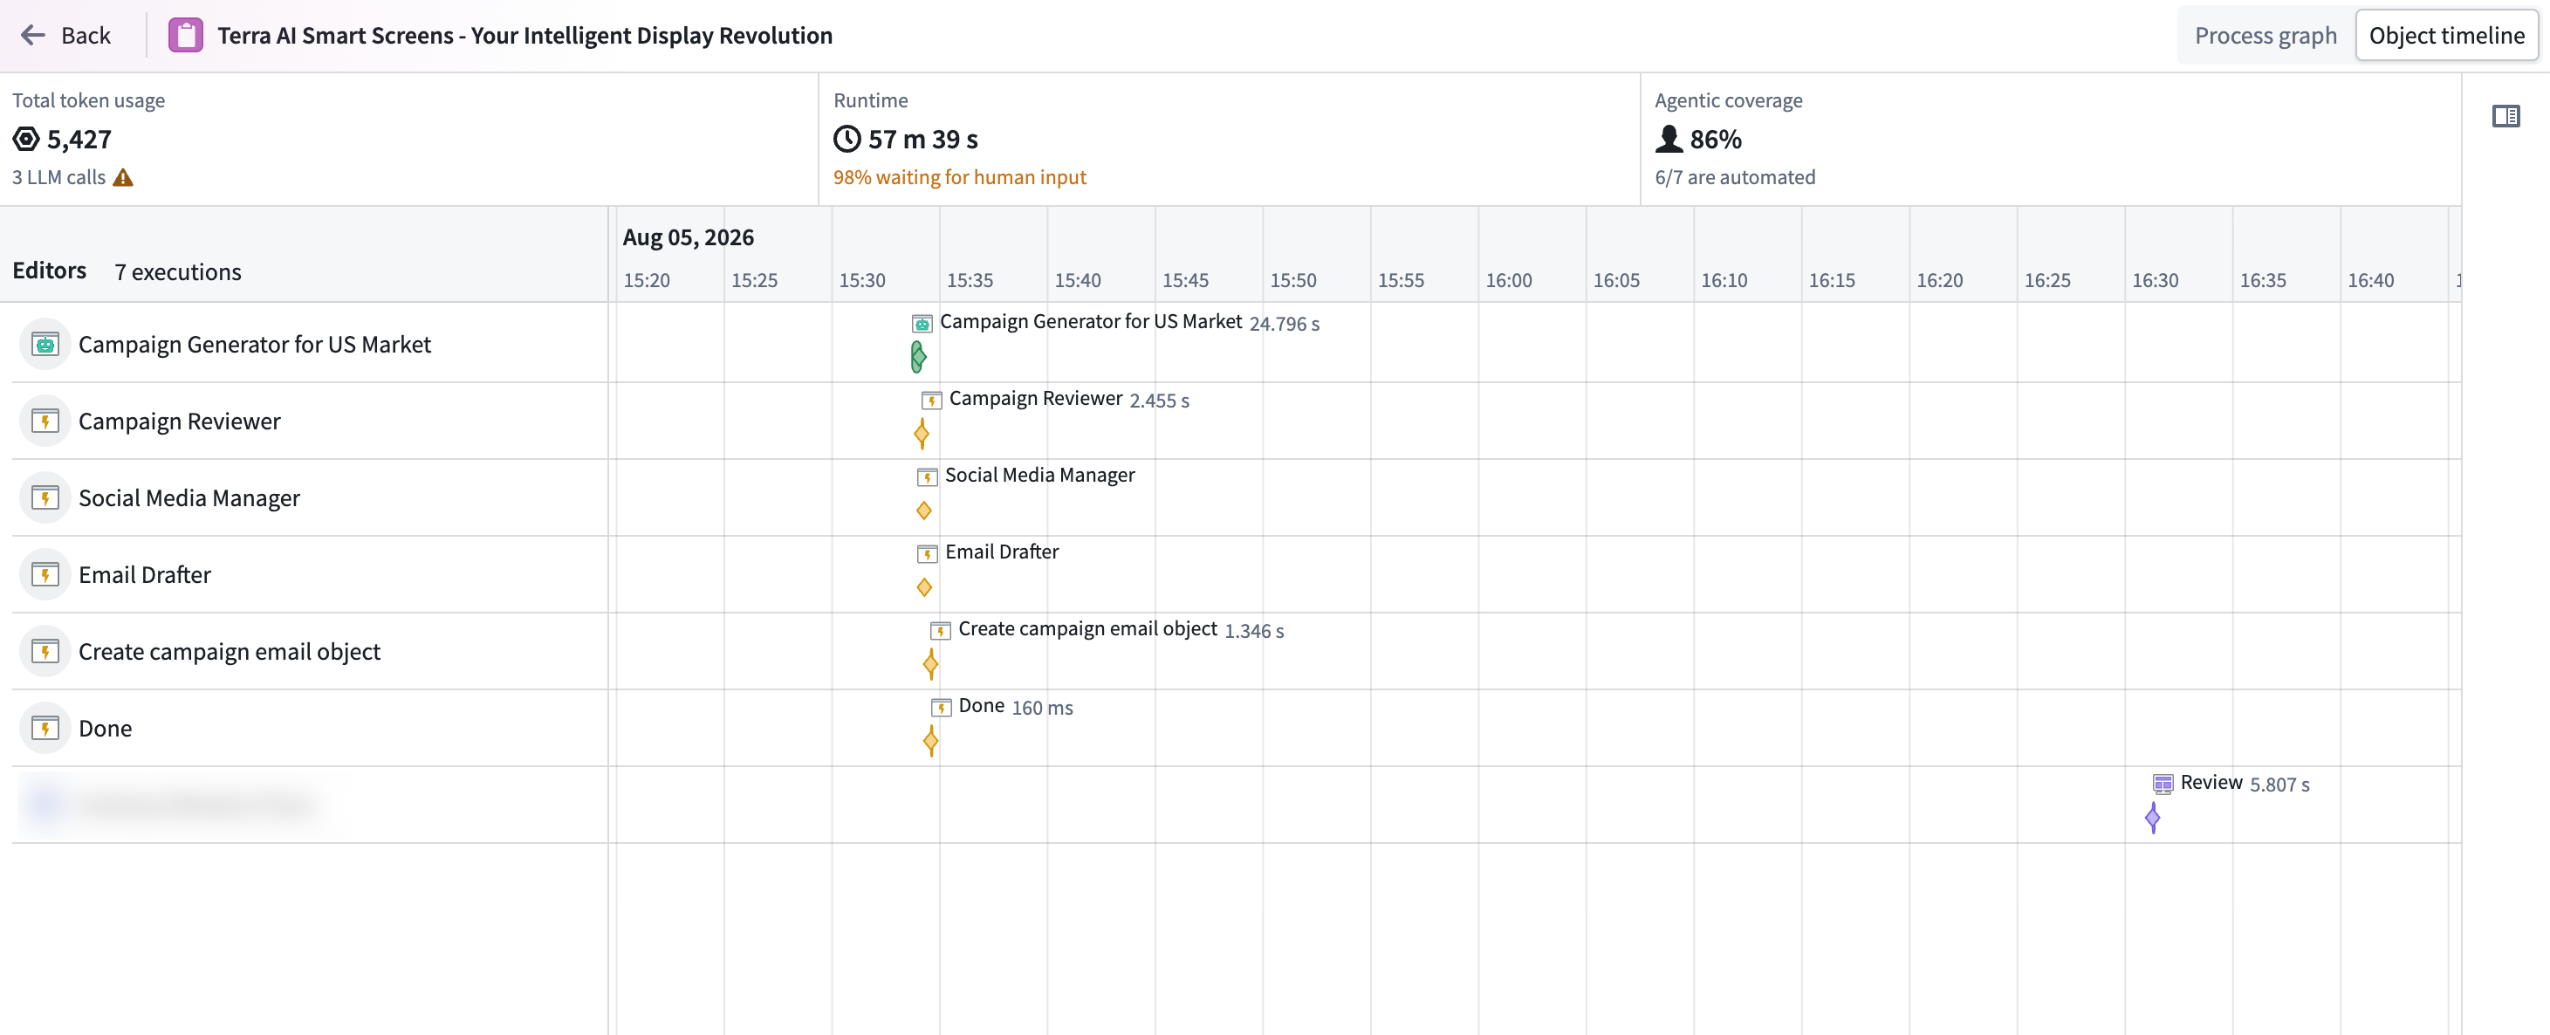
Object timeline showing edits to an object, with attribution, token usage, runtime, and change costs.
View a demonstration of object timeline on the Palantir Developers YouTube channel. ↗.
Summary metrics
The object's summary metrics give you a starting point for optimization:
- Total token usage: The number of tokens consumed across all executions.
- Total runtime: The length of time from the first to the last execution.
- Waiting time: The amount of time spent waiting for human input, shown in the same cell as total runtime.
- Agentic coverage: How much of the object's history was driven by agents versus humans.
Explore the timeline
Each row represents an agent, human, or resource. Bars show each execution, and diamond markers show each edit made to the object in the ontology through an action. Together, the timeline shows how each has worked on the same object over time, including where activity overlapped or one picked up from another.
Select any bar or diamond to open a side panel with the metrics for that execution and the edits it made to the object.
Optimize your workflow
- Token usage per step lets you quickly identify which steps consume the most, so you know where to focus, whether to refine your prompt or switch models. Select any diamond on the timeline to view detailed metrics.
- Easily spot that most of the token usage in this use case comes from the agent that creates a new campaign. At a glance, you can see where to prioritize optimization, whether that is refining the prompt, switching models, or reducing token usage another way.
- Time breakdown helps you spot where you are losing time in a run, so you can identify manual steps to automate and reduce overall workflow duration.
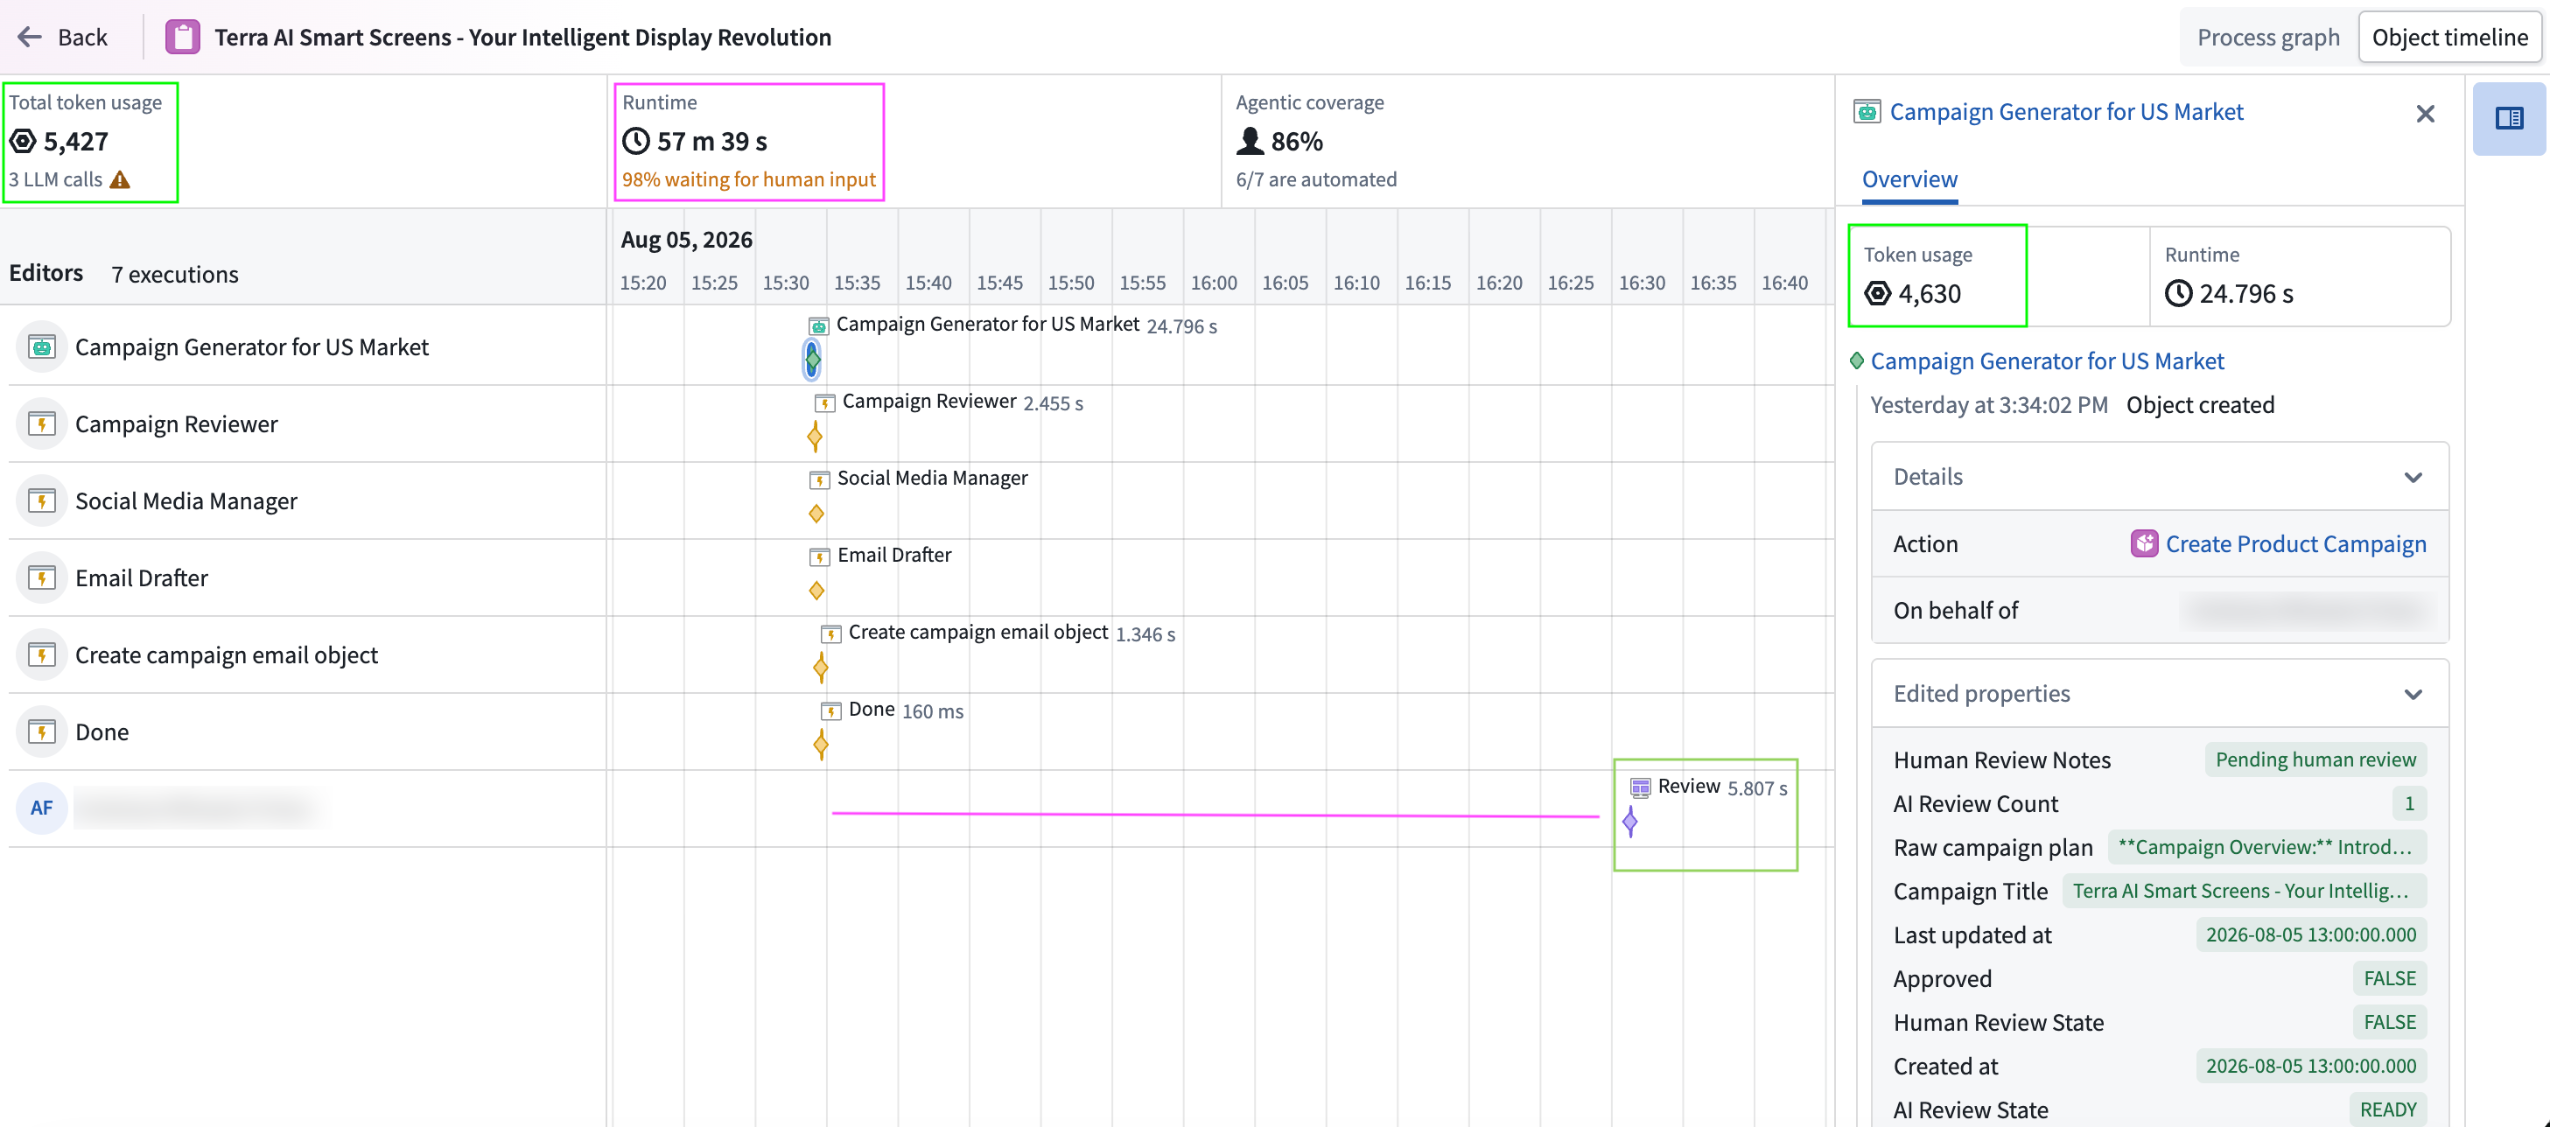
The notional example above shows that 98% of the time is spent waiting on human input for the final review. Knowing this metric can help you understand where you can intervene to speed up the runtime.
Access object timeline from Autopilot or Object Explorer
You can access object timeline from Autopilot, as well as from Object Explorer if edit history is turned on.
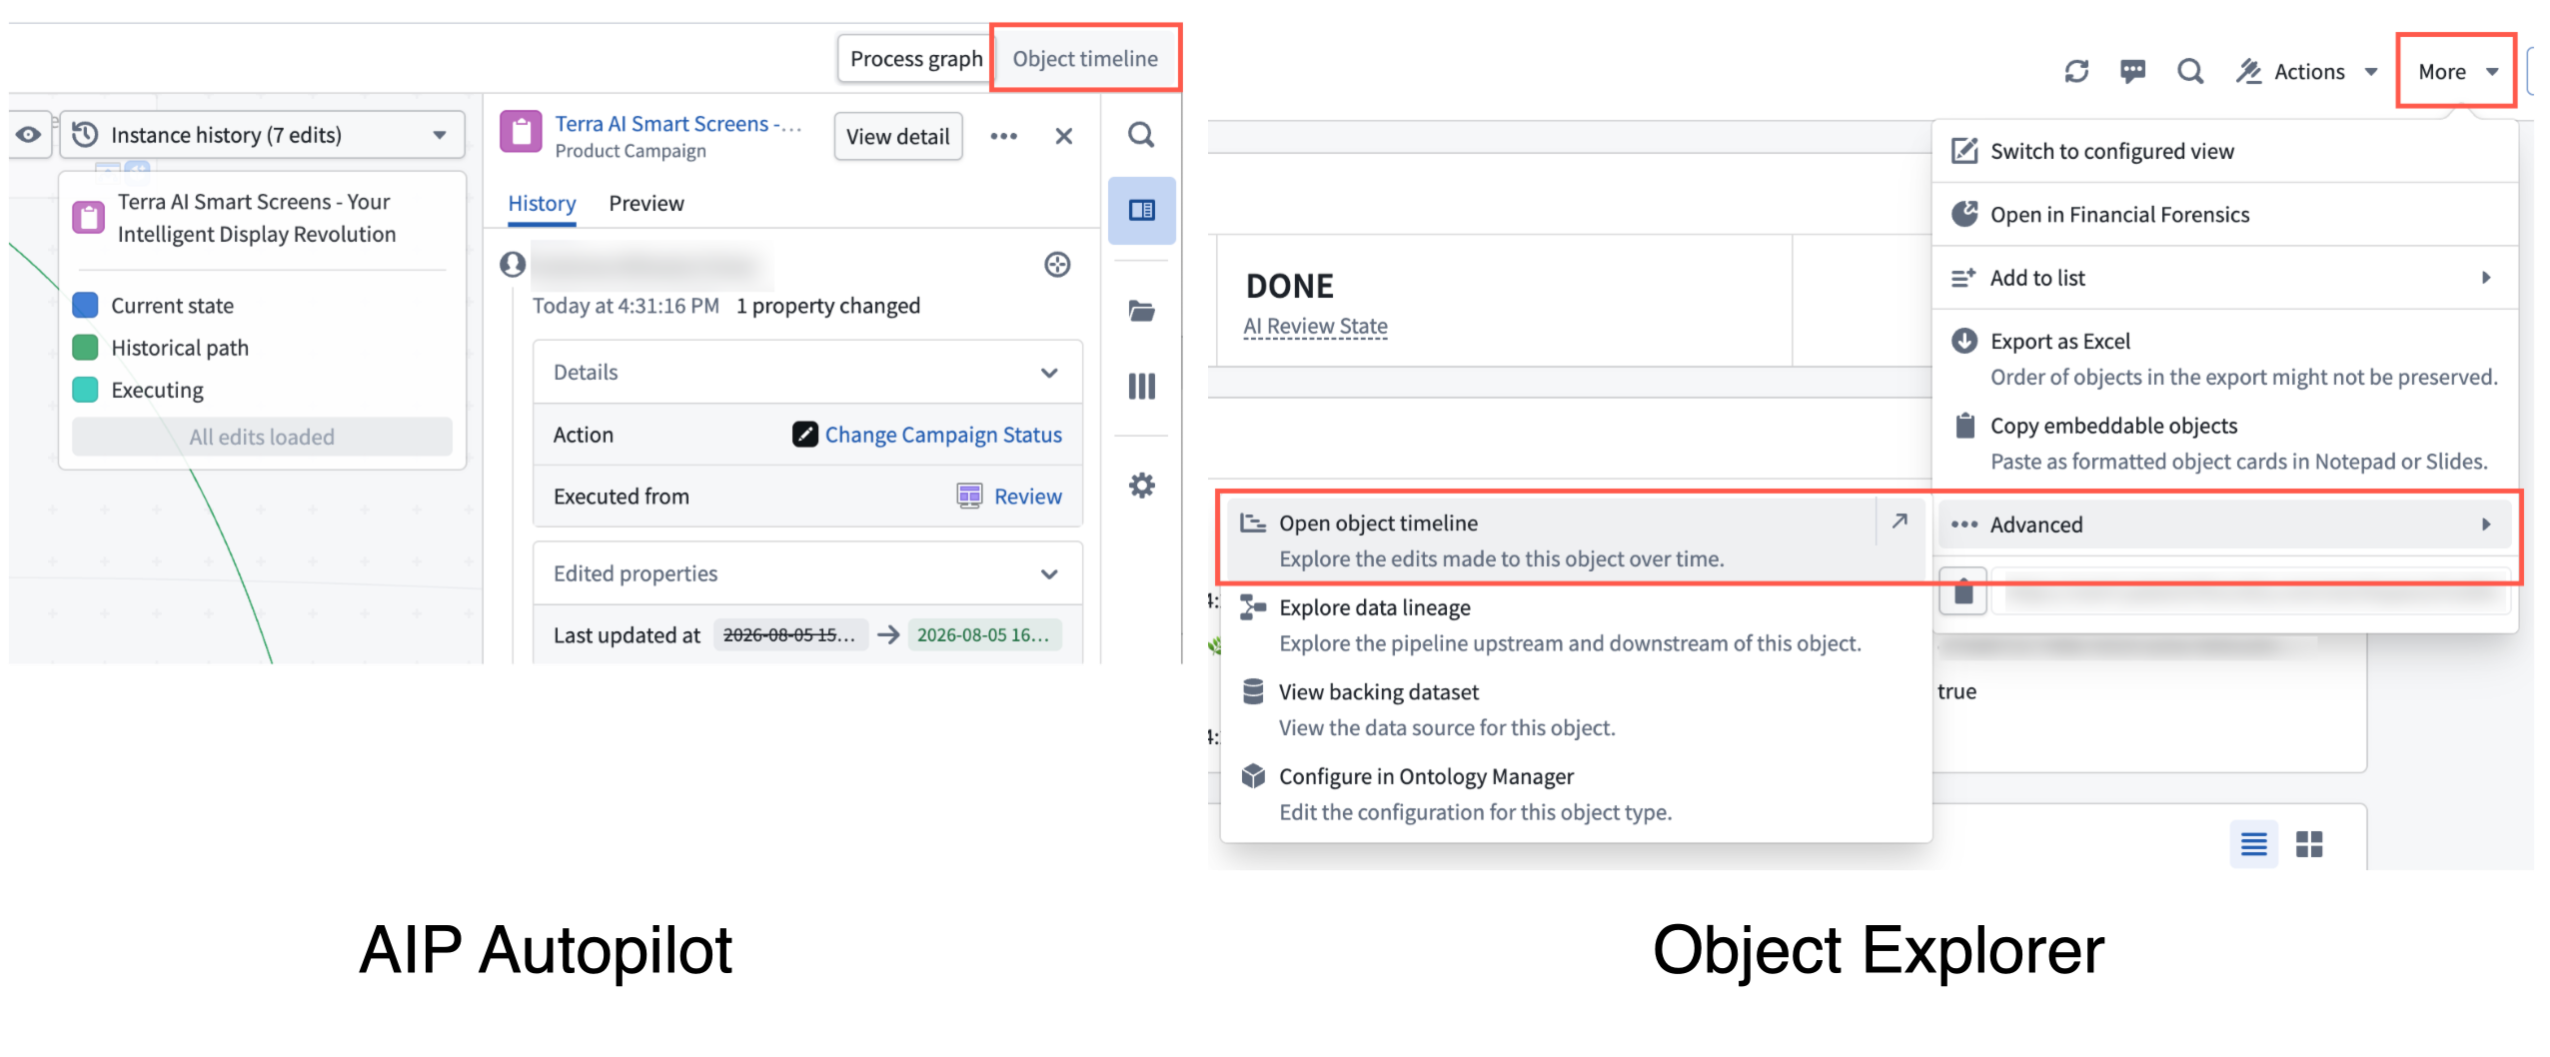
Access the object timeline from Autopilot's graph view or from the More menu in Object Explorer.
Share your feedback
As we continue to add features to Autopilot, we want to hear about your experiences and welcome your feedback. Share your thoughts with Palantir Support channels or our Developer Community ↗ using the aip-autopilot tag ↗.
Additional open-weight models now available in AIP through AWS Bedrock
Date published: 2026-08-04
Select models from DeepSeek, Z.ai, and Moonshot AI are now available in AIP through AWS Bedrock on non-georestricted, US, EU, UK, and JP commercial enrollments.
Model overviews
DeepSeek V3.2 ↗ is DeepSeek's mixture-of-experts reasoning model optimized for reasoning, coding, and instruction following. It supports client-side tool use and a 164,000-token context window with up to 8,000 output tokens.
GLM 5 ↗ is Z.ai's multimodal reasoning model, designed for coding, multilingual understanding, and agentic workflows. It supports text and image inputs, client-side tool use, and a 256,000-token context window with up to 16,000 output tokens.
Kimi 2.5 ↗ is Moonshot AI's frontier-class reasoning model, optimized for complex systems engineering and long-horizon agentic tasks. It supports advanced reasoning, mathematics, coding, and client-side tool use, with a 200,000-token context window and up to 128,000 output tokens.
Getting started
To use these models:
- Confirm that your enrollment administrator has enabled the relevant model family.
- Review token costs and pricing.
- See the complete list of models available in AIP.
Your feedback matters
We want to hear about your experiences using language models in the Palantir platform and welcome your feedback. Share your thoughts with Palantir Support channels or on our Developer Community ↗ using the language-model-service tag ↗.
Introducing SuperRepo: Build full-stack Ontology applications in a pro-code monorepo
Date published: 2026-08-04
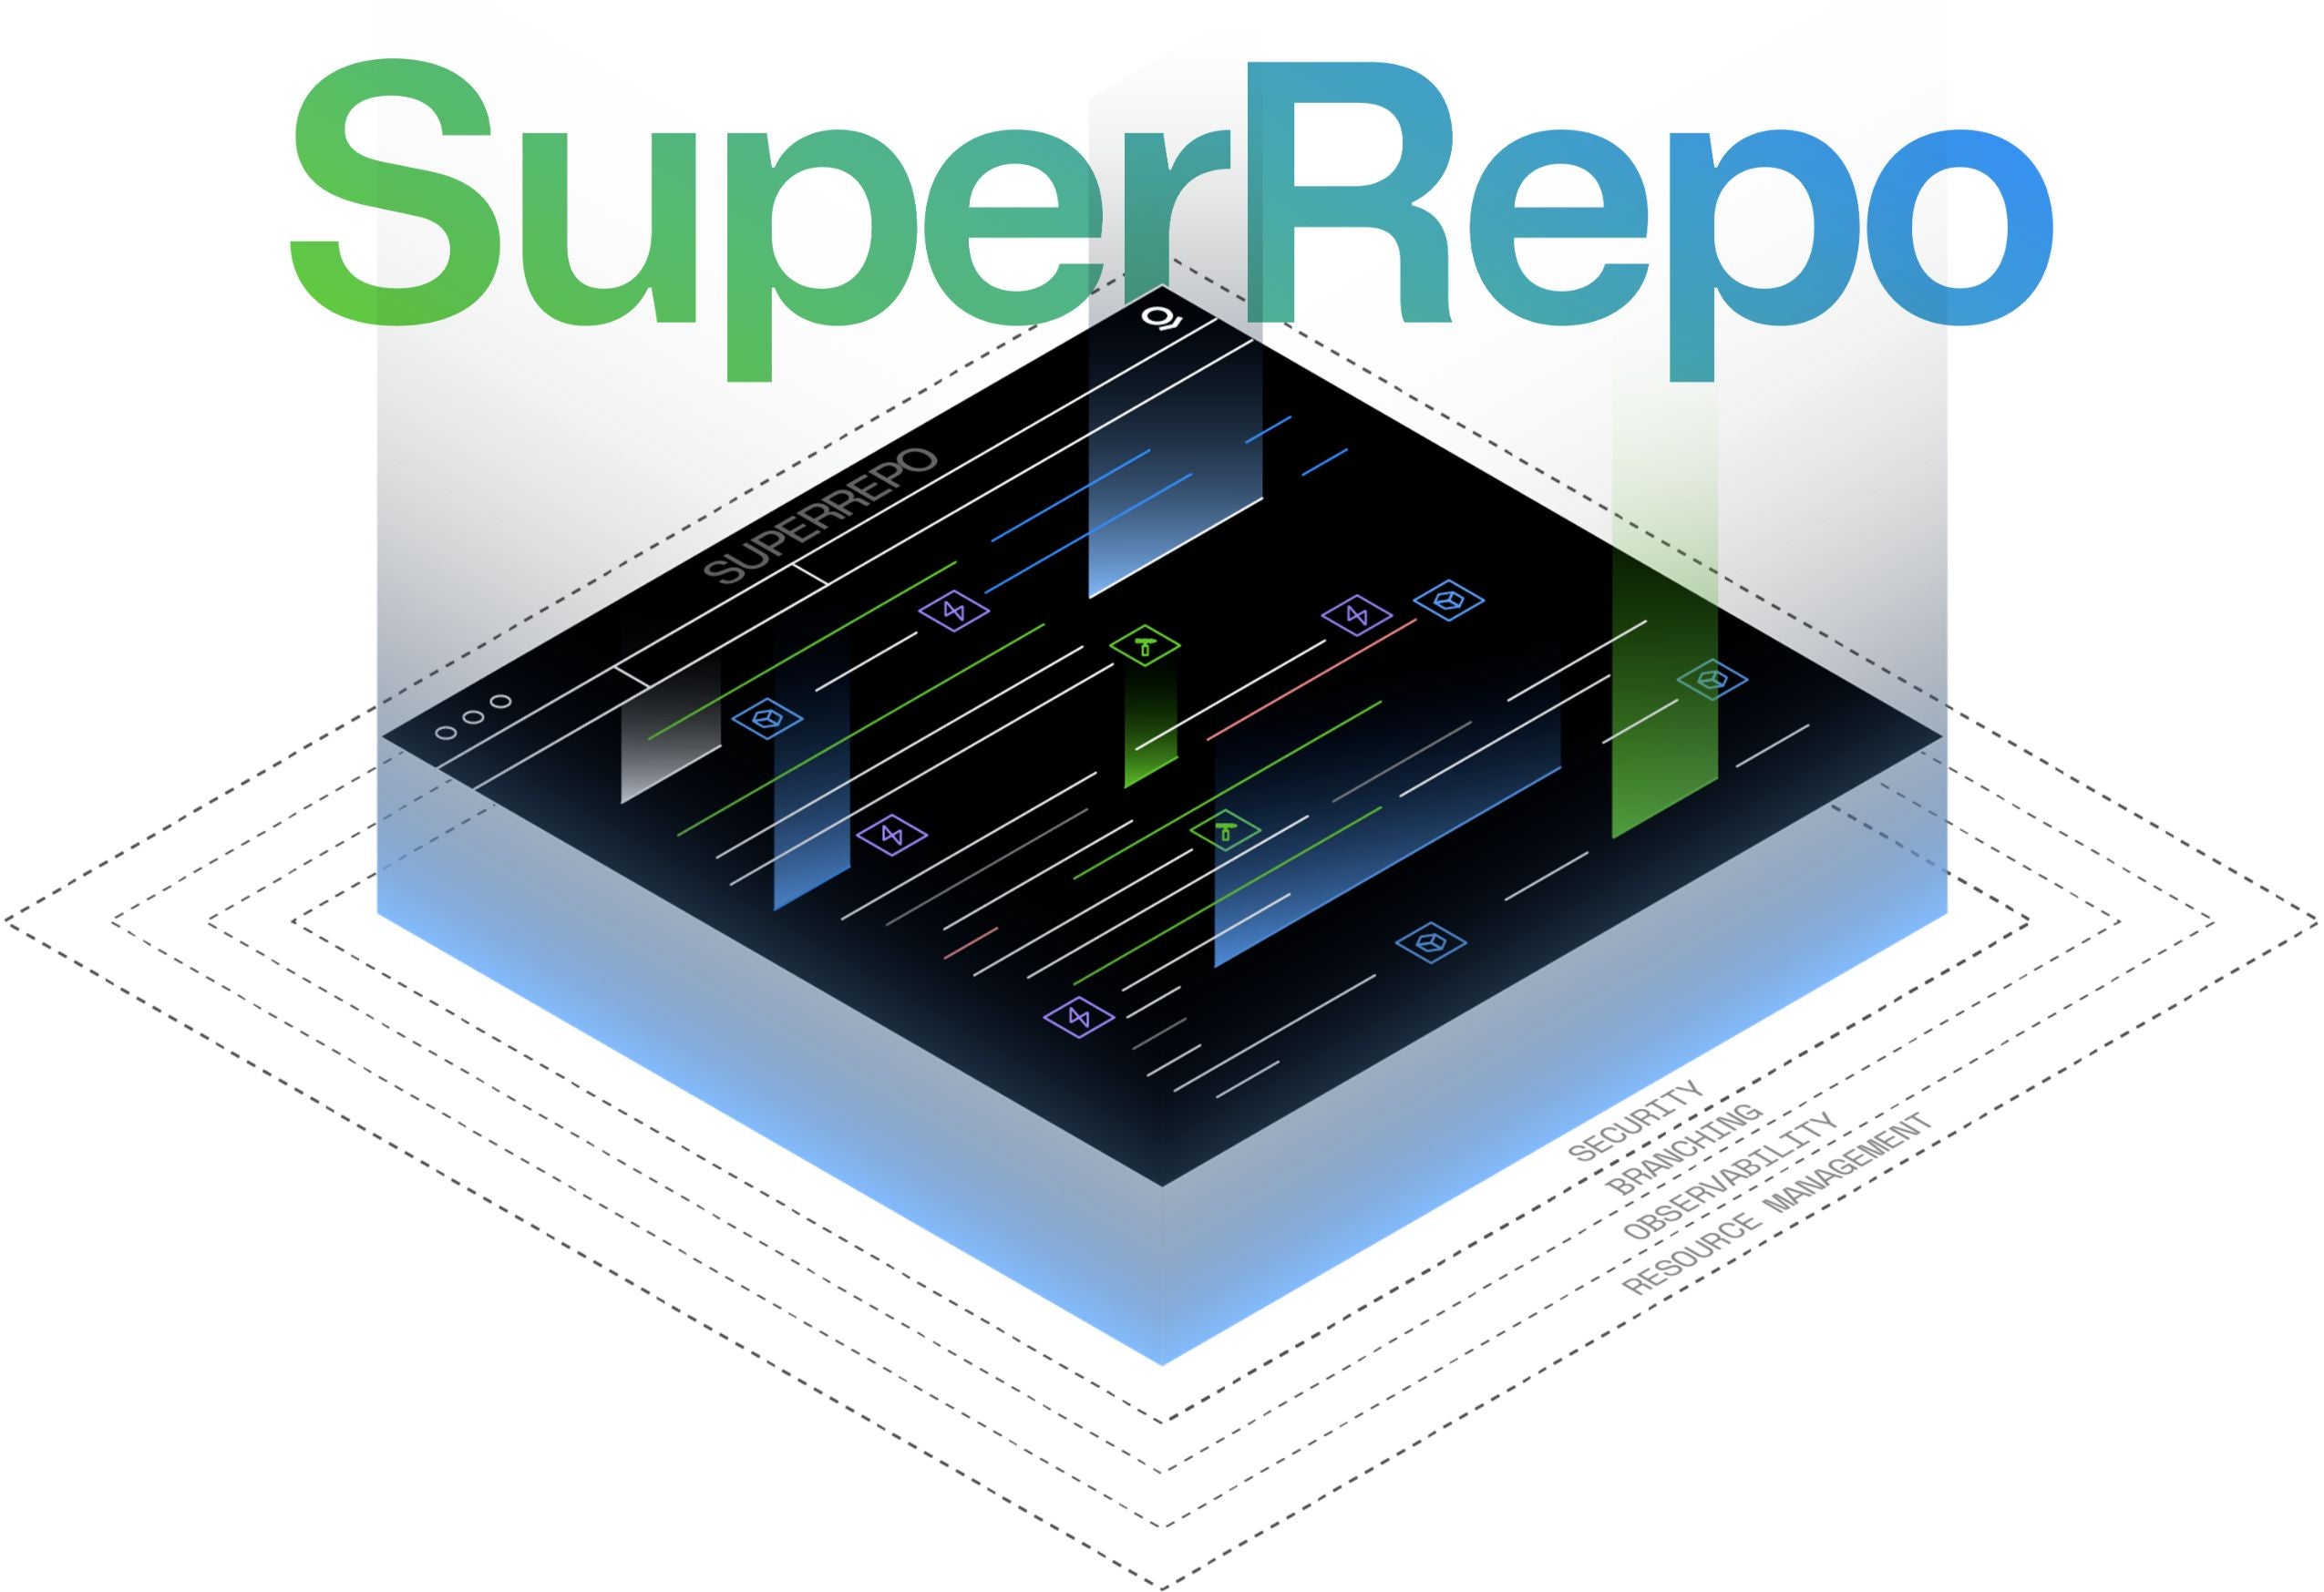
As of the week of August 3, SuperRepo is now available in beta, bringing a pro-code way to build complex full-stack applications anchored around the Ontology. A SuperRepo is a single monorepo that holds your Ontology definitions, your functions, and your React application together, so you can develop, build, and deploy them as one versioned artifact.
With SuperRepo, you ship a feature that spans the Ontology, a function, and a frontend from one repository, in a single edit-and-preview cycle.
Iterate across the whole application locally
The Foundry CLI runs your SuperRepo on your own machine so you can change the Ontology, your functions, and your application together:
- Ontology-as-code: Declare object types, links, interfaces, and actions in TypeScript. Your code definitions are the source of truth, and they materialize as real entities on your enrollment when your product is deployed.
- Embedded Ontology preview: Local servers reproduce the Ontology's behavior on your machine. Function-backed actions route through the embedded Ontology, and functions run in language-specific preview runtimes. Seed data files populate a fresh local database each time the server starts.
- Locally generated Ontology SDK: SDK bindings are generated from your Ontology-as-code definitions and regenerated automatically whenever those definitions change, then consumed directly by your functions and your Ontology SDK application. You can extend the Ontology and use the new types in a single loop, with no SDK republish in between.
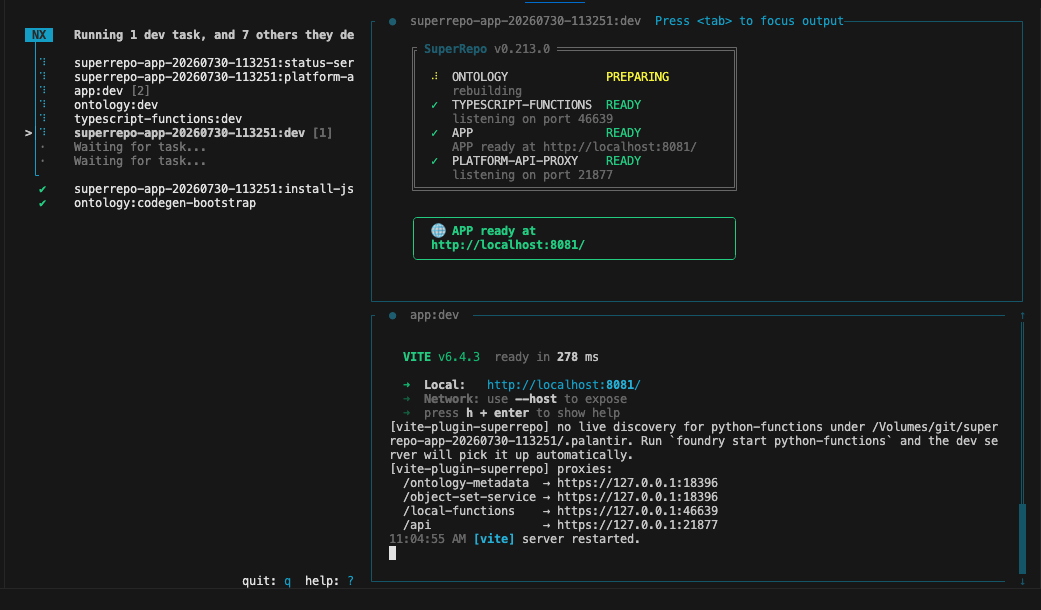
Track Ontology SDK rebuild progress in the ontology section of the preview output.
Deploy programmatically to any enrollment
A SuperRepo compiles natively into a Marketplace product: a self-contained, reproducible, and cryptographically signed bundle you can install on one or more enrollments. Run foundry deploy configure once to map your deployment inputs into an env.yml file, commit it, and both deployment paths read the same configuration:
- From the Palantir platform: If your source is hosted in the platform, tag a version of your repository and Foundry CI builds and deploys the product for you.
- From your own CI system: If your source is hosted elsewhere, build and deploy from your terminal or from any CI provider, such as GitHub Actions or CircleCI, with the Foundry CLI.
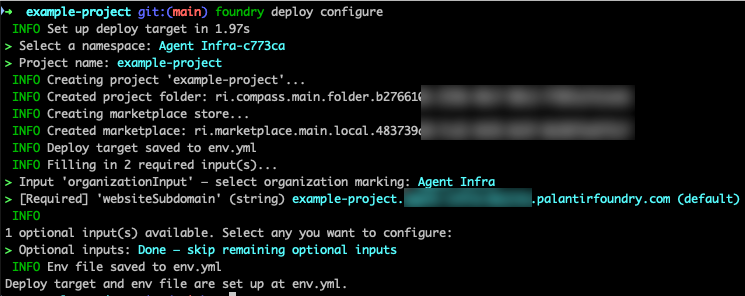
The interactive foundry deploy configure flow writes your deployment configuration to env.yml.
Use the Ontology you already have
A SuperRepo does not require a separate Ontology. Entities that already exist on your enrollment, including those built in the Ontology Manager, can be imported into your SuperRepo instead of being redefined in code, and types created in code are visible in the UI. Applications are never siloed by how their Ontology types were created.
Getting started
Create a SuperRepo in whichever environment you prefer:
- In the platform, select New > Code repository, then Applications > SuperRepo, and select Open in VS Code to launch it in VS Code workspaces.
- Locally, install the Foundry CLI and run
foundry create.
Then follow the end-to-end tutorial to import an object type, define a link type, add a TypeScript function, expose it as a function-backed action, and consume all of it from a React application without leaving your editor. When you are ready to install on an enrollment, review Prepare for your first deployment.
Learn more about SuperRepo in our documentation.
What is coming next
The following are in active development and not available yet:
- Python functions
- Agent engine and Agent SDK
- External sources
- Automate
- Data pipelines
Review Coming in the future and the FAQ for details.
We want to hear from you
We welcome your feedback on SuperRepo, and your posts help the team prioritize what to build next. Share your thoughts with Palantir Support channels or our Developer Community ↗ using the superrepo ↗ tag.