- Capabilities
- Getting started
- Architecture center
- Platform updates
Announcements
REMINDER: Sign up for the Foundry Newsletter to receive a summary of new products, features, and improvements across the platform directly to your inbox. For more information on how to subscribe, see the Foundry Newsletter and Product Feedback channels announcement.
Share your thoughts about these announcements in our Developer Community Forum ↗.
Claude Opus 5 is now available from Anthropic, AWS Bedrock, Google Vertex, and Microsoft Azure
Date published: 2026-07-30
Claude Opus 5 is now available on non-georestricted enrollments from Anthropic, AWS Bedrock, Google Vertex, and Microsoft Azure. For US, EU, and non-georestricted enrollments, the model is available from AWS Bedrock and Google Vertex. For JP georestricted enrollments, the model is available from AWS Bedrock.
Model overview
Claude Opus 5 adds improvements in life sciences, task verification, and solving coding problems. For more information, review Anthropic's model documentation ↗.
- Context window: 1,000,000 tokens
- Modalities: Text, image
- Capabilities: Extended thinking, function calling
Getting started
To use this model:
- Confirm your enrollment administrator has enabled the Anthropic, Azure, Bedrock, and Vertex model families.
- Review token costs and pricing.
- See the complete list of models available in AIP.
Your feedback matters
We want to hear about your experience using language models in the Palantir platform. Share your thoughts through Palantir Support channels or on our Developer Community ↗ using the language-model-service tag ↗.
Gemini 3.6 Flash and Gemini 3.5 Flash Lite from VertexAI are now available in AIP
Date published: 2026-07-30
Gemini 3.6 Flash is now available for commercial enrollments with VertexAI enabled in the US, EU, and non-georestricted regions. Additionally, Gemini 3.5 Flash Lite is now available for commercial enrollments with VertexAI enabled in the US, EU, and non-georestricted regions as well as for IL2 and IL4 enrollments.
Model overviews
Gemini 3.6 Flash is Google's latest Flash model, optimized for multi-step orchestration, full-stack code refactoring, and general reasoning. It is ideal for quickly executing agentic tasks. For more information, review Google's model documentation ↗.
Gemini 3.5 Flash Lite is Google's fastest and lowest cost model in the Gemini 3.5 model family best used for latency-sensitive tasks where striking a balance between model performance and cost is important. For more information, review Google's model documentation ↗.
Getting started
To use these models:
- Confirm your enrollment administrator has enabled the relevant model family.
- Review token costs and pricing.
- See the complete list of all the models available in AIP.
Your feedback matters
We want to hear about your experiences using language models in the Palantir platform and welcome your feedback. Share your thoughts with Palantir Support channels or on our Developer Community ↗ using the language-model-service tag ↗.
Bulk upgrade function-backed automations in Workflow Lineage
Date published: 2026-07-30
Bulk function upgrades for automations are now available in Workflow Lineage, allowing you to keep your function-backed automations up to date without updating each one individually. Bulk upgrades work for both AIP Logic functions and code repository functions.
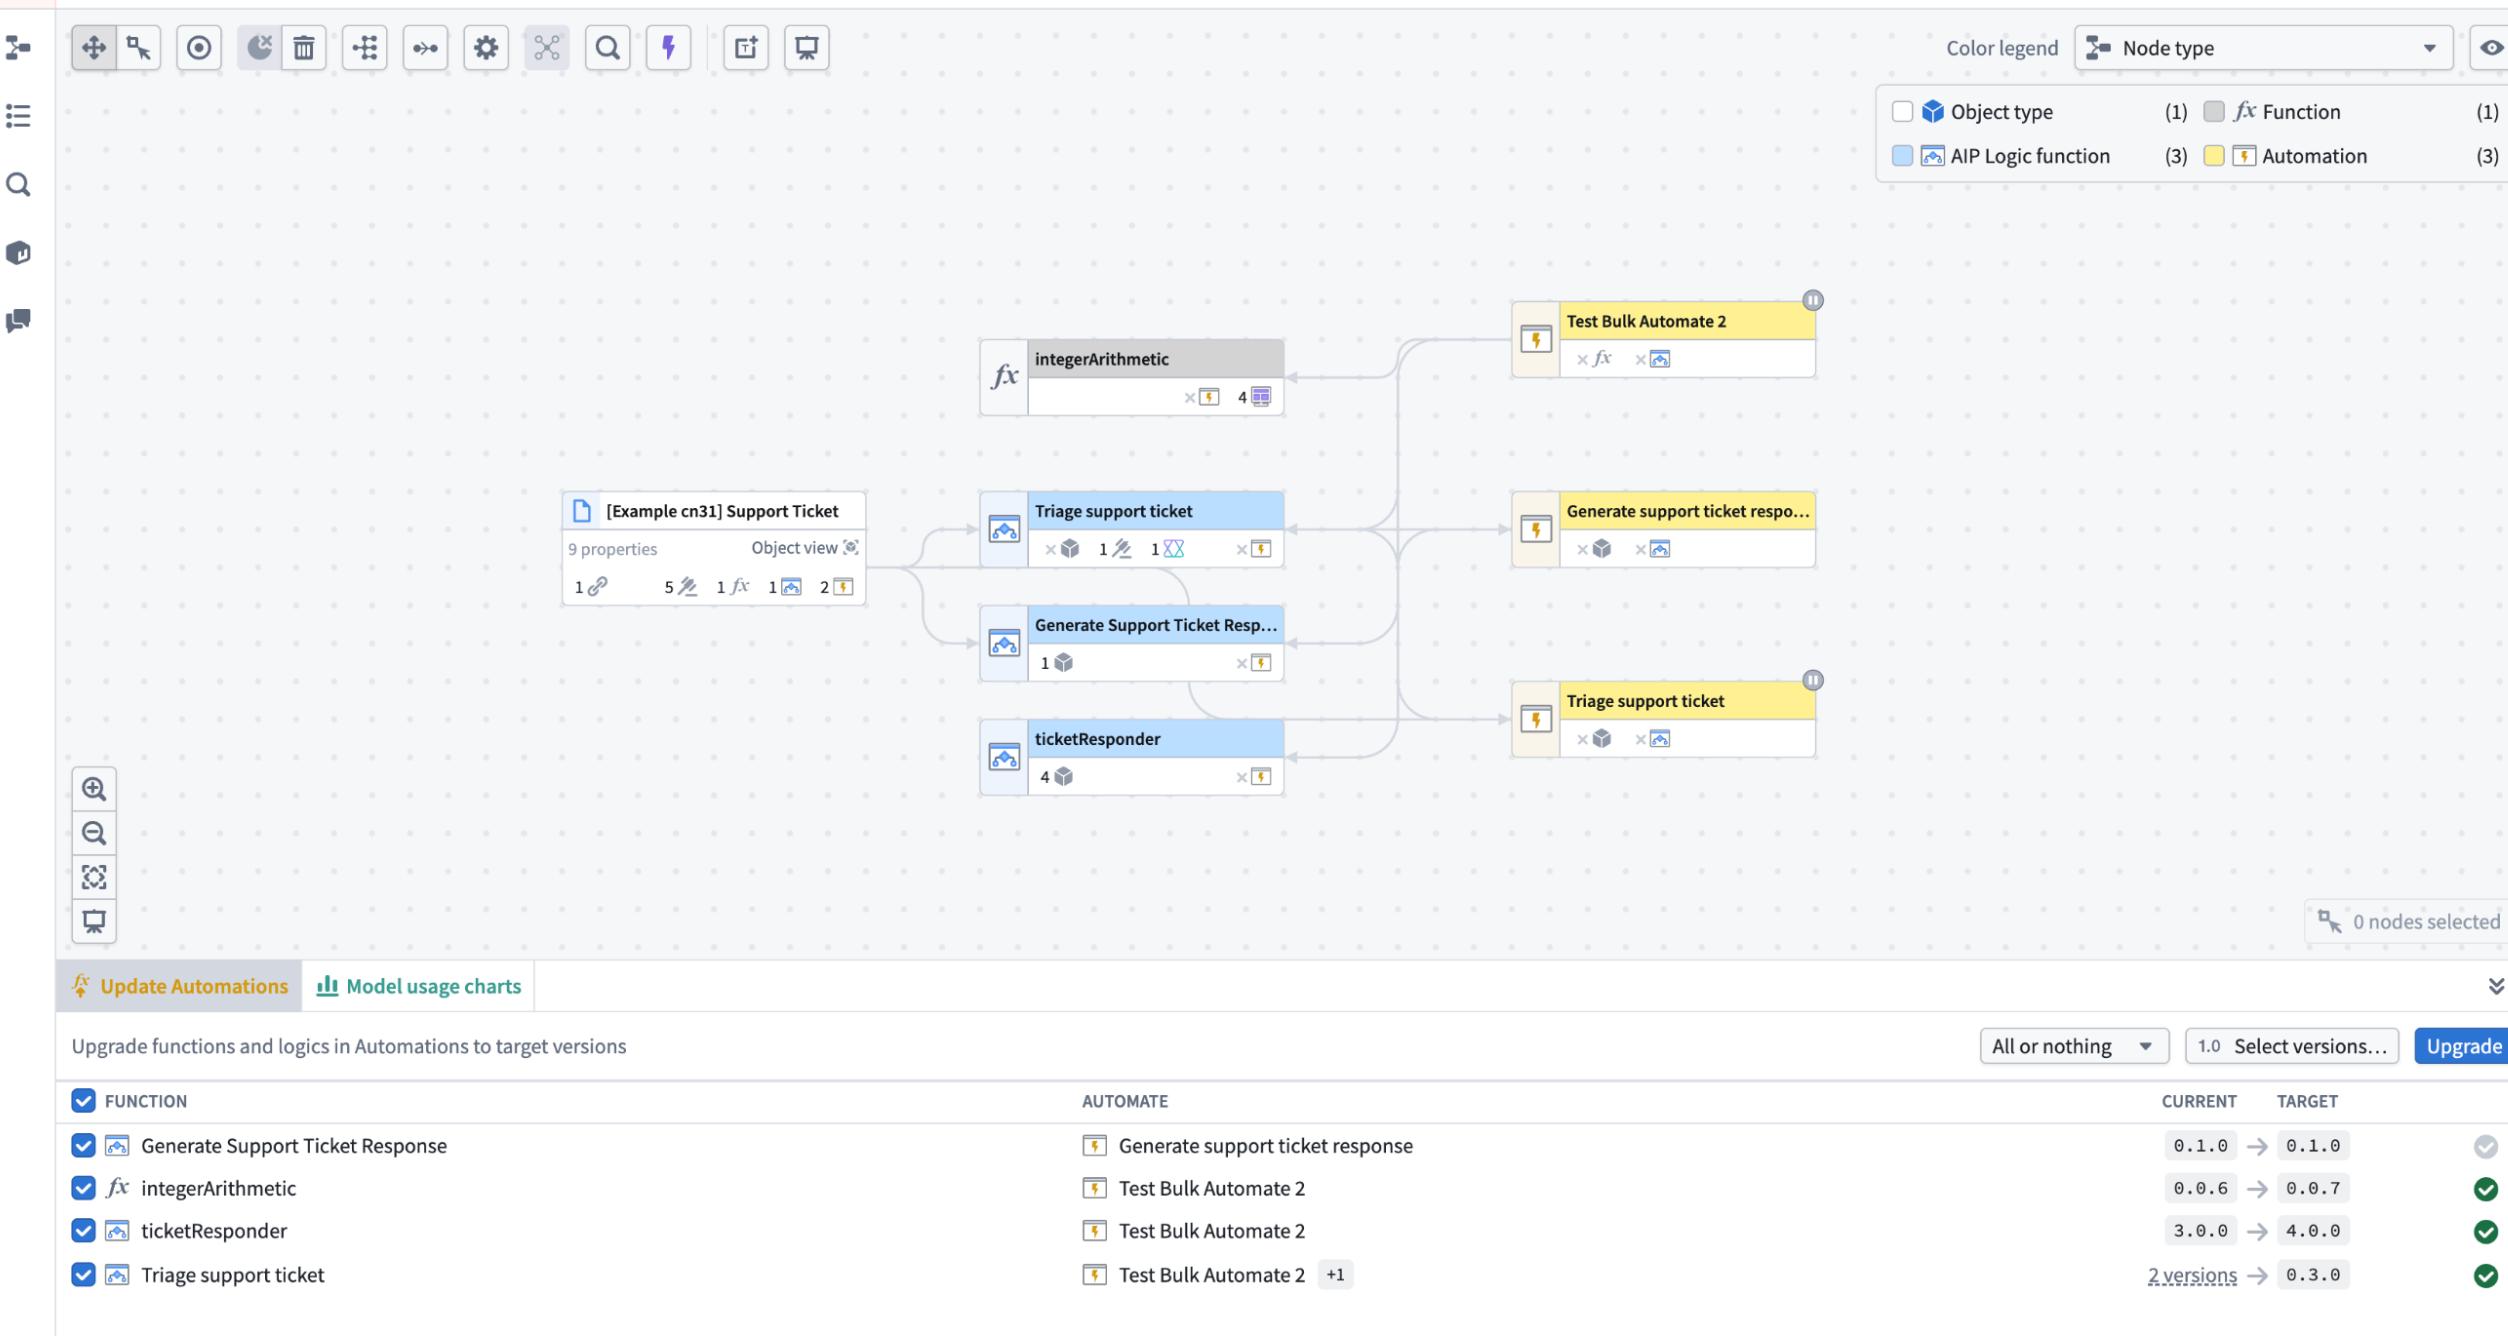
The Update Automations panel in Workflow Lineage where users can bulk update functions in their automations.
What's new
Previously, updating the functions behind your automations meant handling changes individually. Now, you can review and upgrade all your automation functions to target versions in a single, streamlined action.
You have two upgrade options: All or nothing, which upgrades functions only if all can upgrade without breaking changes, or Partial, which upgrades only the functions without breaking changes and leaves the rest untouched.
Apply upgrades
Open Update Automations in the bottom panel of Workflow Lineage and select which automations to update. A pop-up window lists the automations queued for the upgrade. Select Upgrade to apply the changes. A summary shows which automations upgraded successfully and which failed.
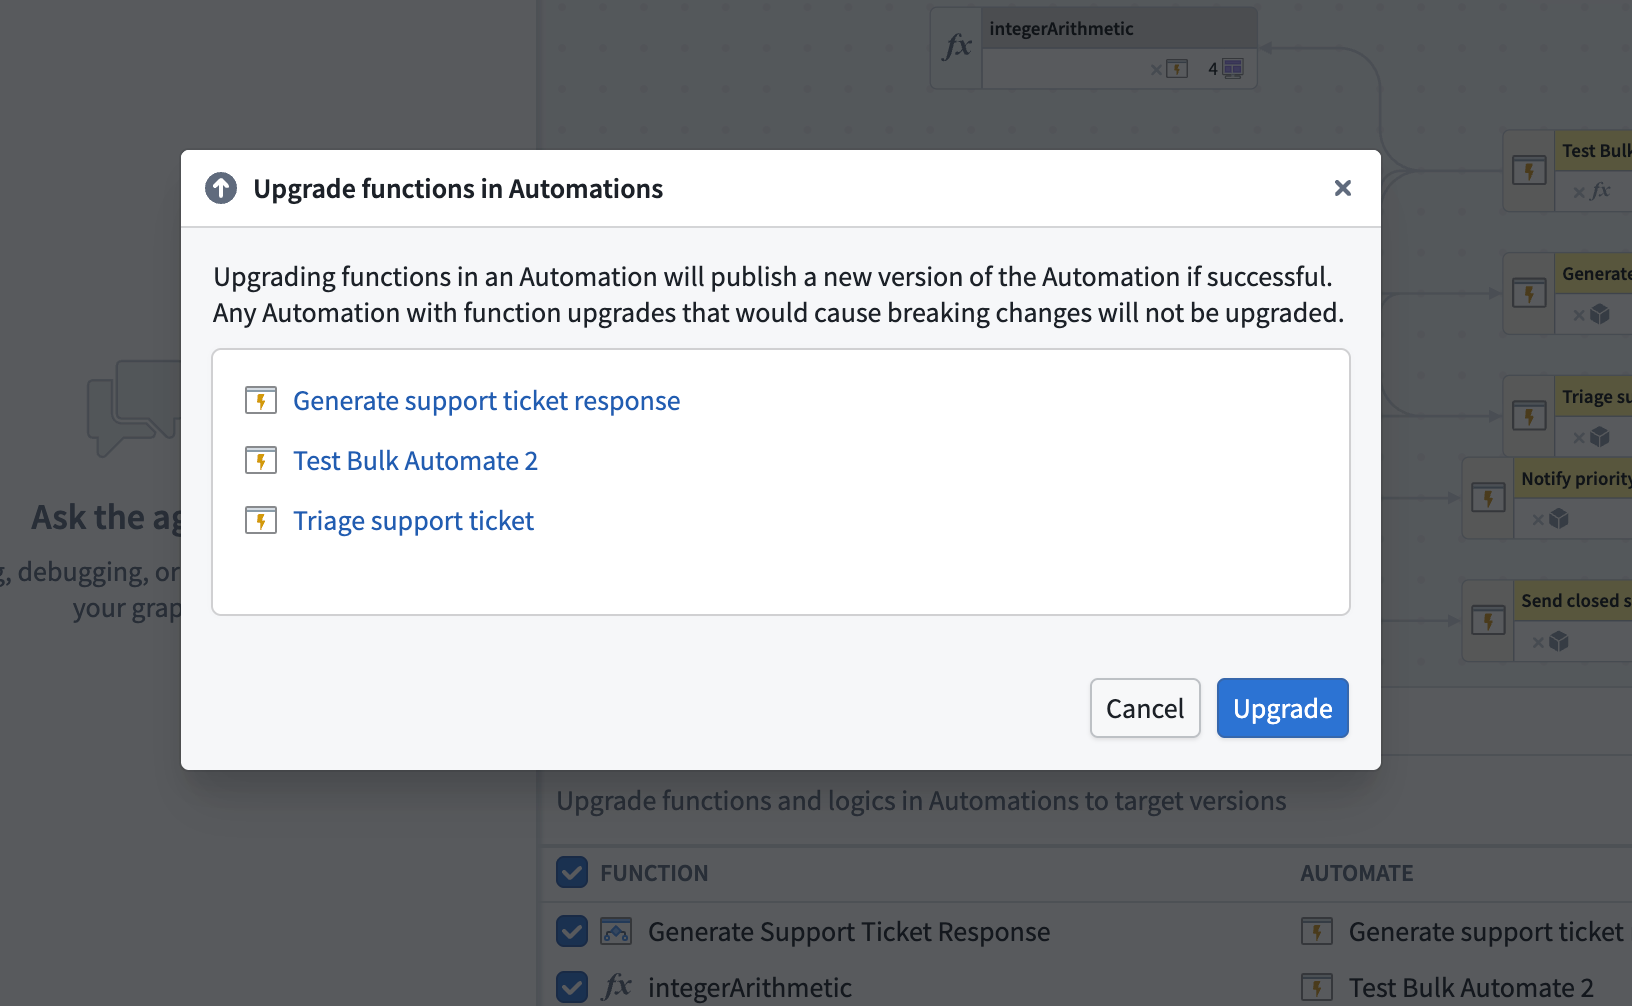
A pop-up window in Workflow Lineage lists which automations are queued for the upgrade.
Review our documentation for more details.
Tell us what you think
We welcome your feedback on bulk updating function-backed automations in Workflow Lineage. Share your thoughts with Palantir Support channels or our Developer Community ↗ using the workflow-lineage ↗ tag.
Deploy extraction strategies as Python functions in AIP Document Intelligence
Date published: 2026-07-28
Deploying extraction strategies to Python functions is now generally available in AIP Document Intelligence. As an alternative to running your strategy in a batch pipeline, you can deploy it as per-page Python functions and build your own document extraction workflow around the Ontology, structured however your use case requires. Use event-driven tools such as Automate and Ontology actions to orchestrate the workflow to fit your needs.
To deploy a strategy, select View code snippets in the Deploy to functions panel in the AIP Document Intelligence application, then follow the in-platform guide to set up a Python functions repository with the generated code. For setup requirements and code details, review our documentation.
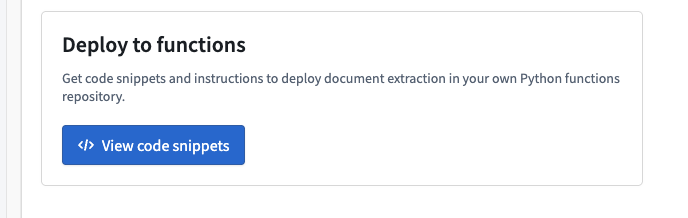
The View code snippets option in the AIP Document Intelligence, allowing you to deploy extraction strategies to Python functions.
You can optionally chunk your extracted text and generate embeddings for downstream use in search or retrieval workflows. Chunk size, chunk overlap, and embedding model are configured in the AIP Document Intelligence application.
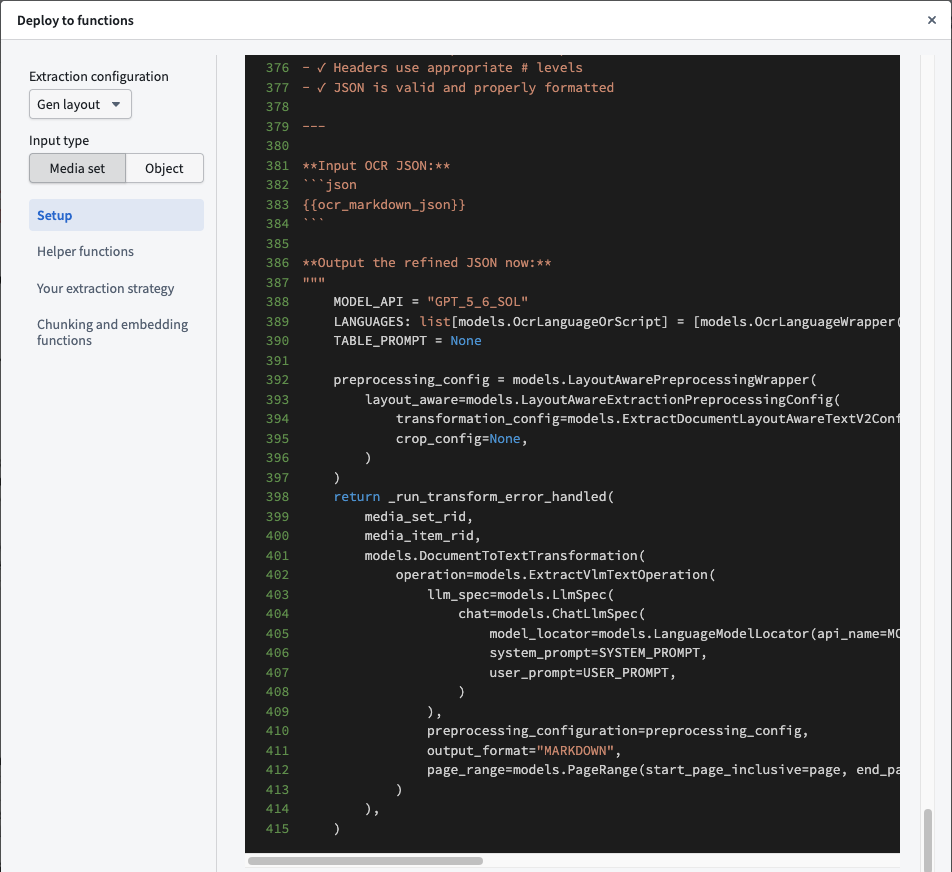
An example of available code snippets in the Deploy to functions panel in the AIP Document Intelligence application.
We want to hear from you
We welcome your feedback on deploying extraction strategies to Python functions. Share your thoughts with Palantir Support channels or our Developer Community ↗ using the aip-document-intelligence ↗ tag.
Scope your Insight session to a branch with Global Branching
Date published: 2026-07-28
Insight now supports Global Branching, allowing you to scope your analysis session to a branch to view Ontology data and run actions on that branch. When your session is on a branch, your analysis reflects the branch instead of main, including the workbook, the home page, and any actions you run.
What's new
Branch selector: Use the branch selector in the workbook header or on the home page to switch onto a branch from main.
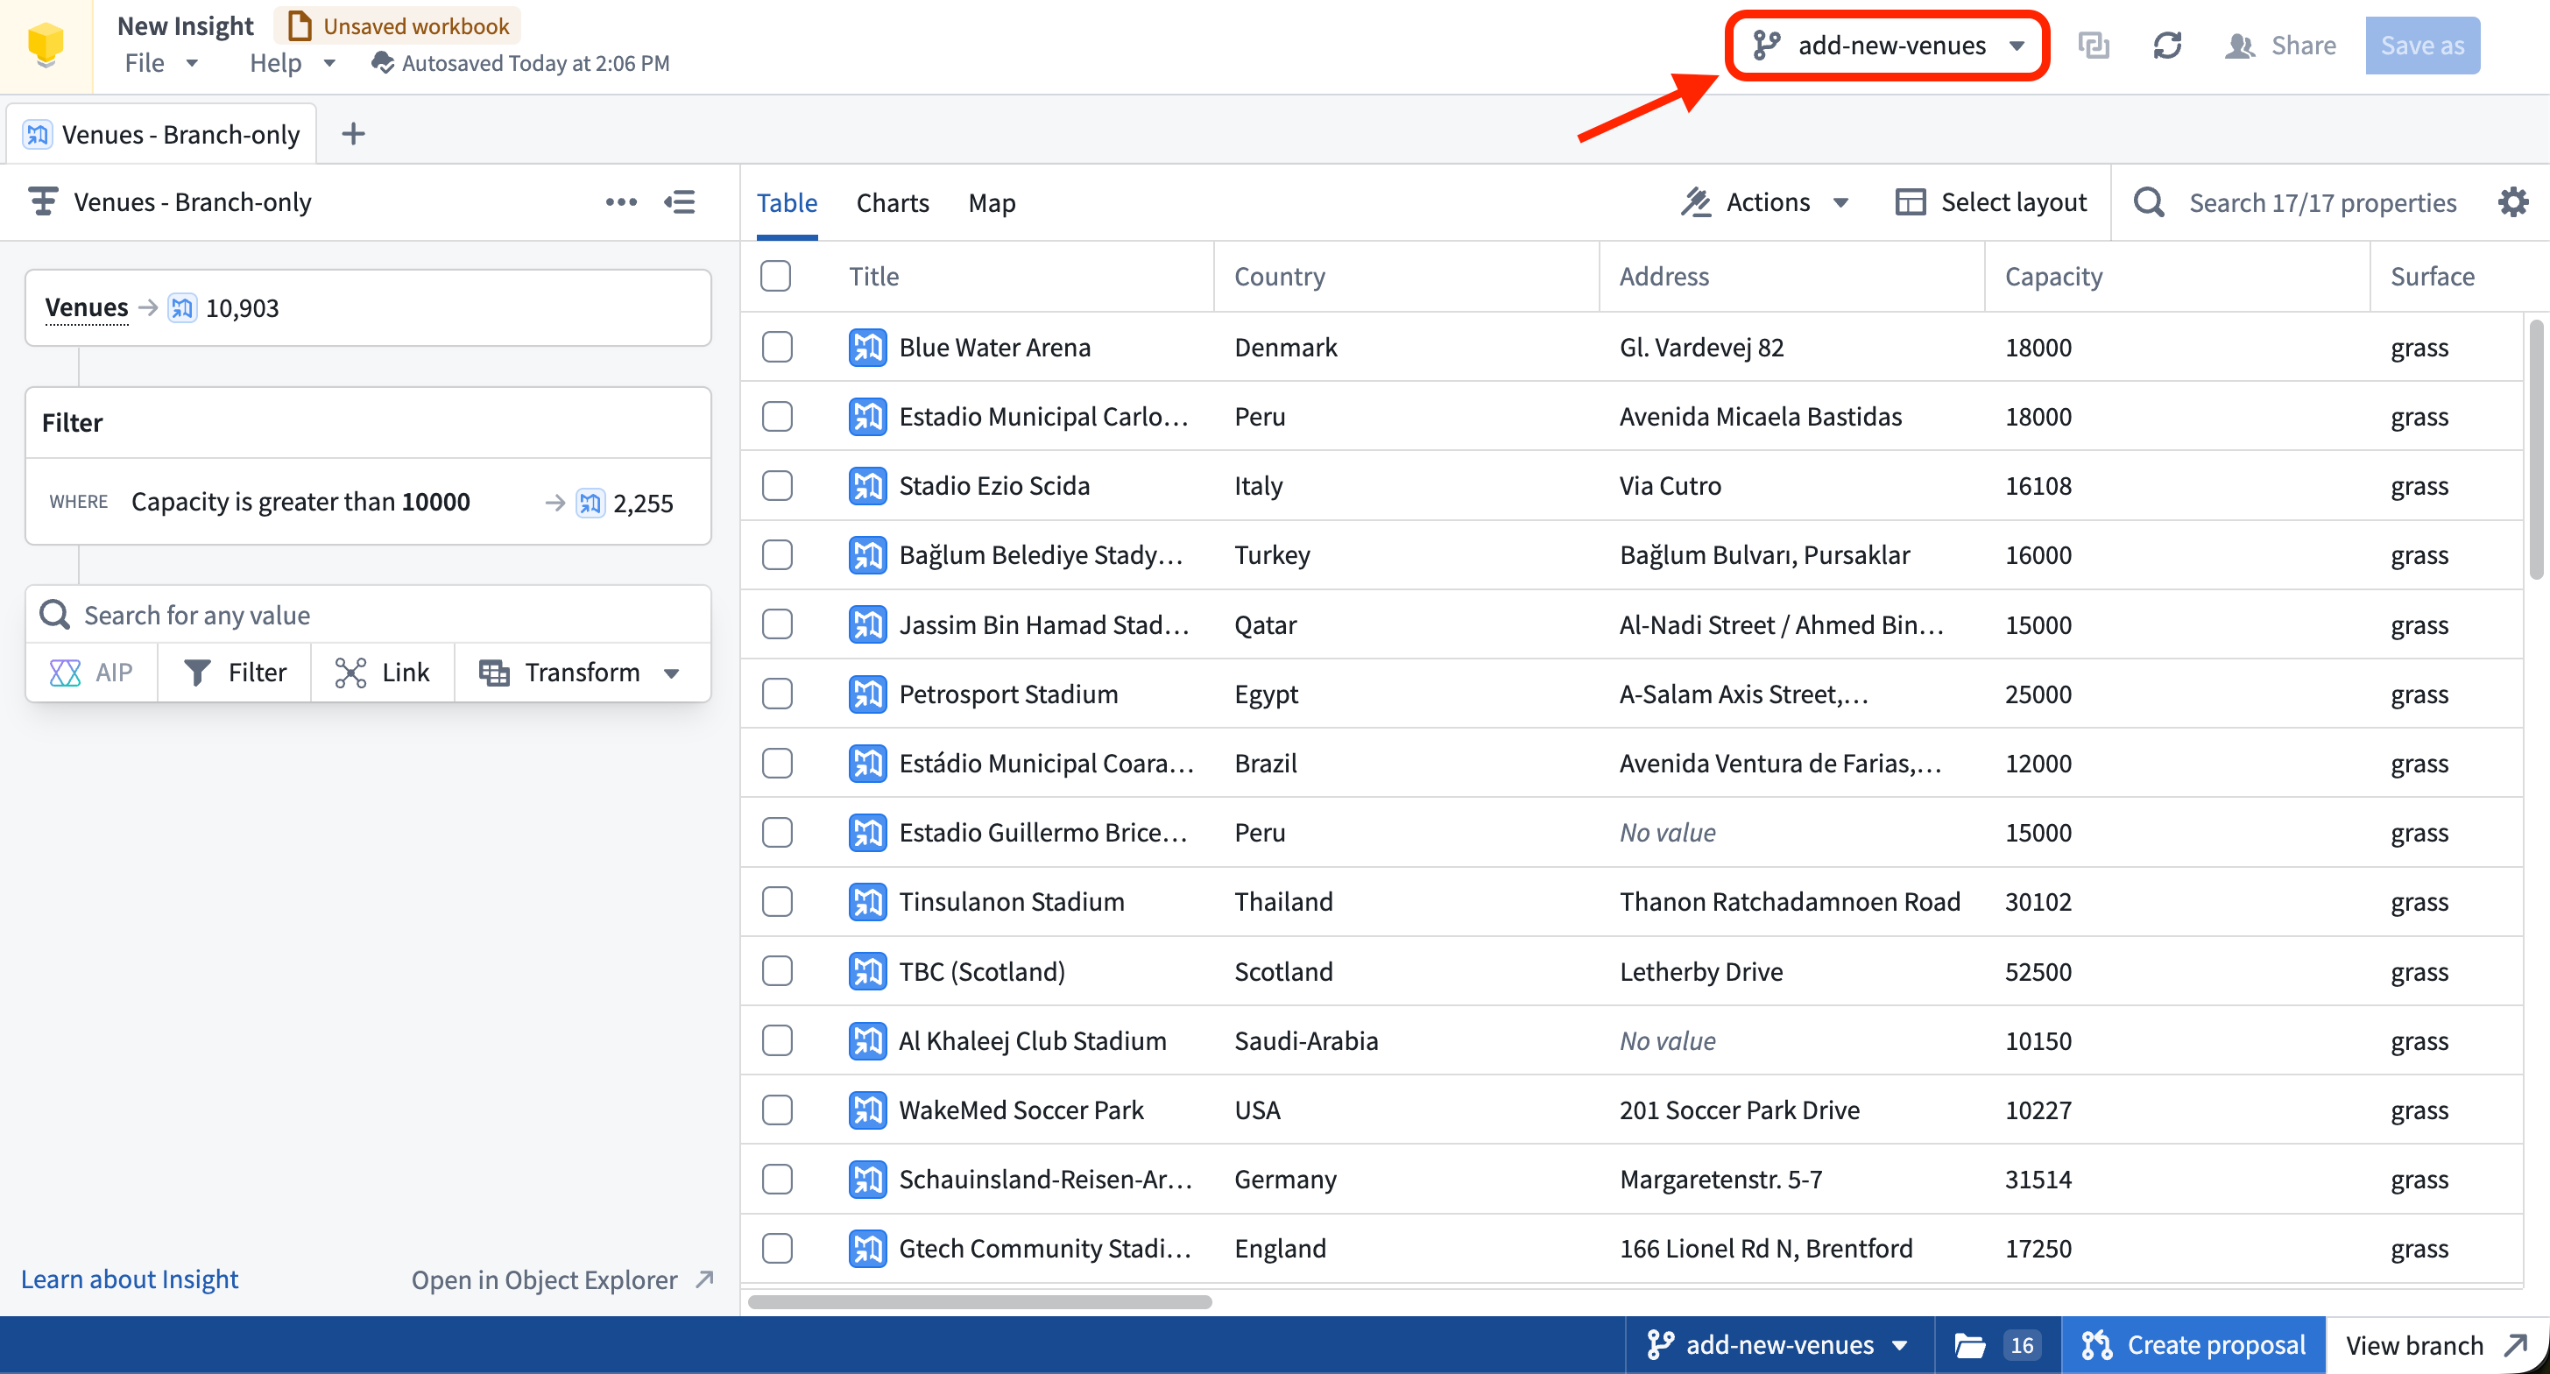
An Insight workbook scoped to a global branch, with the branch selector located in the workbook header.
Branch taskbar: Once you are on a branch, the platform branch taskbar appears at the bottom of your screen so you can view and manage your branch context.
Branch URL parameter: Open Insight from a link that includes a branch parameter to load a session already scoped to that branch.
What's not supported?
An Insight workbook is not a branchable resource, so some operations that write or export data are not yet branch-aware and are disabled while you are on a branch. The following features are not supported on a branch:
- Saving a workbook or layout
- Publishing an object set, or saving one as a list
- Exporting to Excel
- Opening results in an application that does not support branching
Autosave continues to preserve your in-progress work while you are on a branch, even though you cannot save the workbook itself.
Learn more about Global Branching in Insight.
Tell us what you think
We welcome your feedback on Global Branching in Insight. Share your thoughts with Palantir Support channels or our Developer Community ↗ using the insight ↗ and global-branching ↗ tags.
Investigate dataset history with Time Travel
Date published: 2026-07-23
Time Travel is now available in Dataset Preview, providing an interactive way to investigate how a dataset or Iceberg table changed across its committed versions. You can inspect data at a previous point in time, compare changes across a range of versions, and find when a specific row or value changed. Time Travel is in a beta state of development, and functionality may change.
To use Time Travel, open a dataset or Iceberg table in Dataset Preview, then select the Time Travel tab. The timeline displays committed versions in chronological order.
Inspect a single version
Use Single version view to move through the timeline and see the data and schema at each version. Select Refine query to view and edit the underlying SQL query, filtering rows, selecting columns, sorting, or aggregating results. Time Travel carries the query forward as you move through the timeline, so you can follow the same analysis across earlier or later versions.
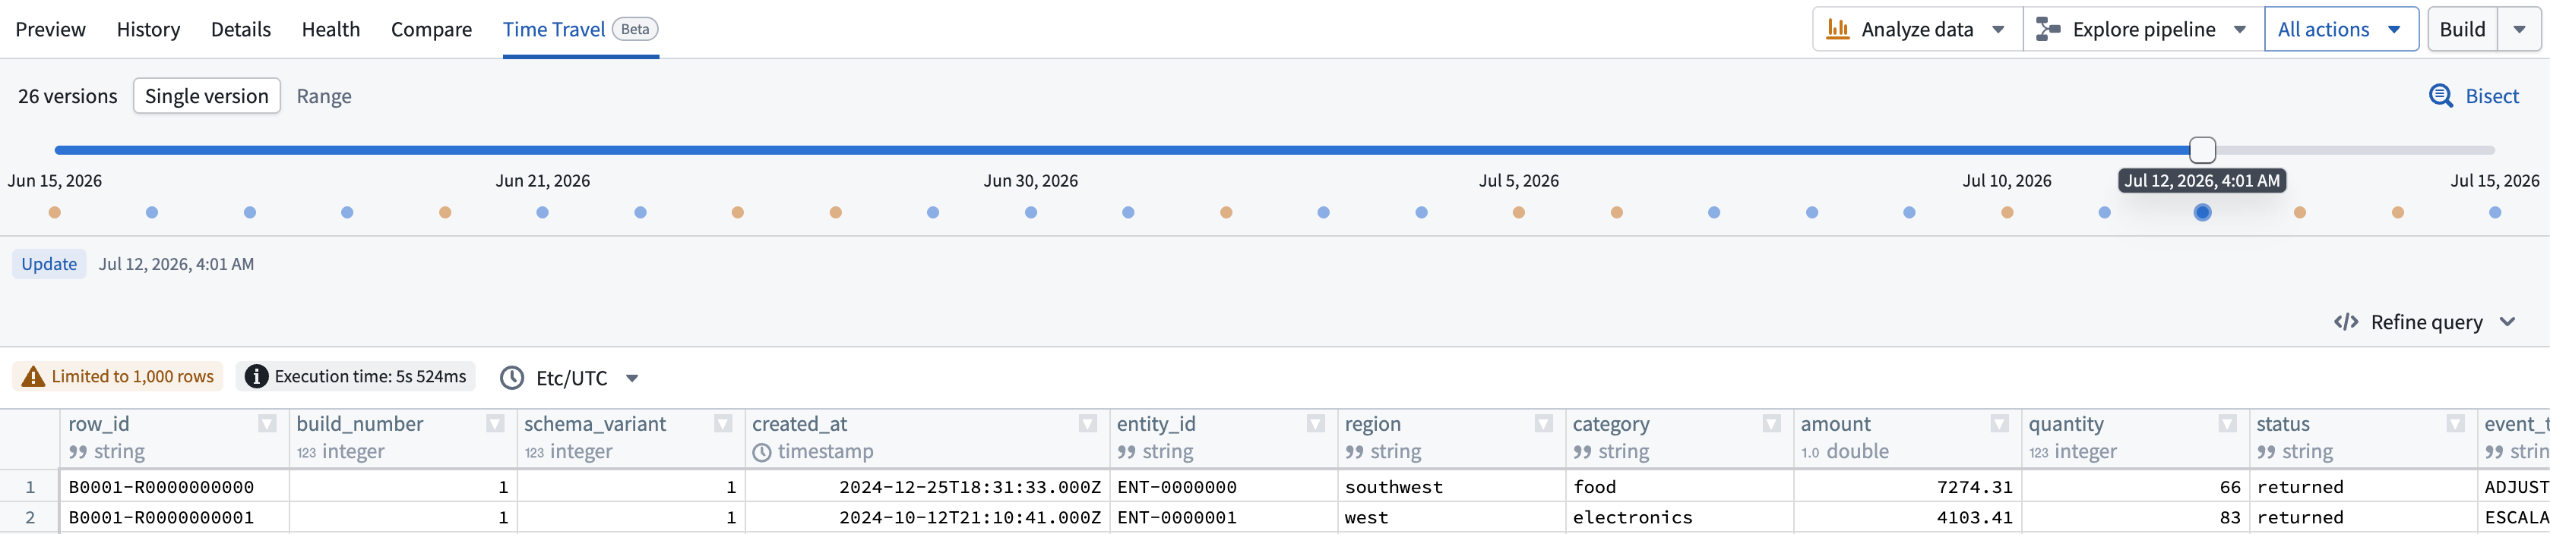
The Time Travel Single version view, where you can view the schema of each version of the dataset.
Compare a range of versions
Use Range view and select two points on the timeline to see rows added, removed, or modified between them. When no key column is selected, edits to a row appear as a removal and an addition. Select a column that uniquely identifies each row to surface those edits as modifications instead. If the schema changed within the selected range, Time Travel also summarizes the columns that were added, removed, or changed.
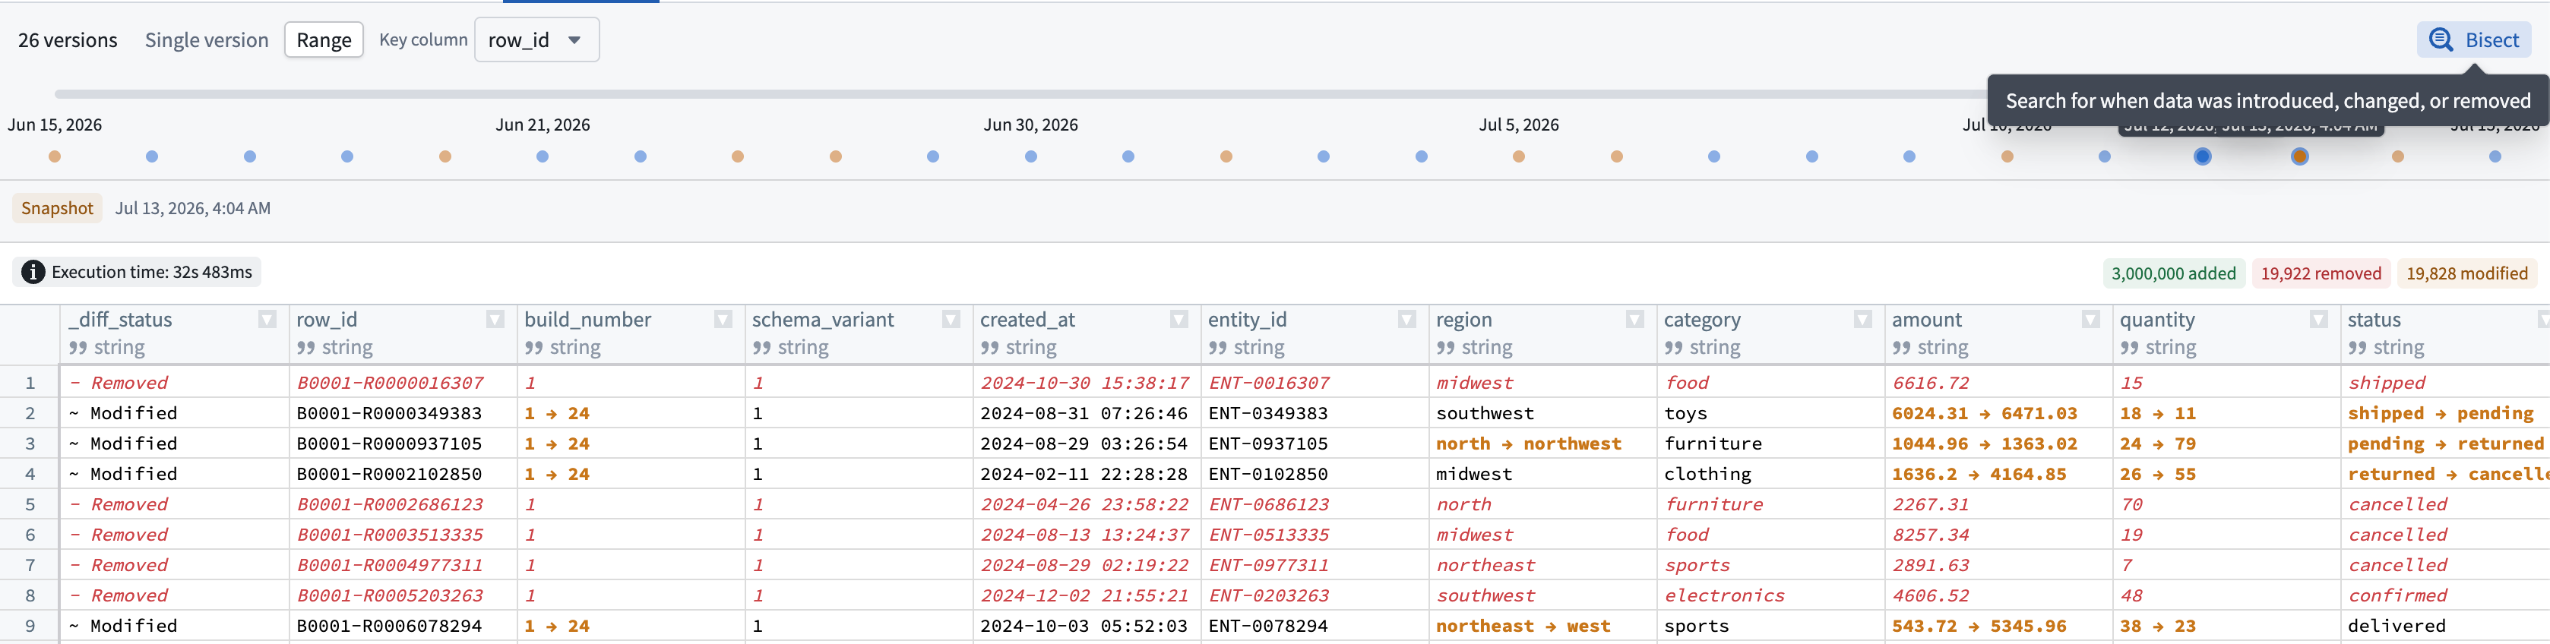
The Time Travel Range view, where you can view changes in a dataset between two points of time.
Find when a change occurred
Use Bisect to search version history for the first time a row was added or removed, or a cell value changed, then navigate directly to the matching version. Right-click a table cell to start a bisect with that row or value pre-filled. Bisect only searches across the versions currently loaded on the page.
Time Travel only allows inspecting versions where data remains available under the applicable retention policy.
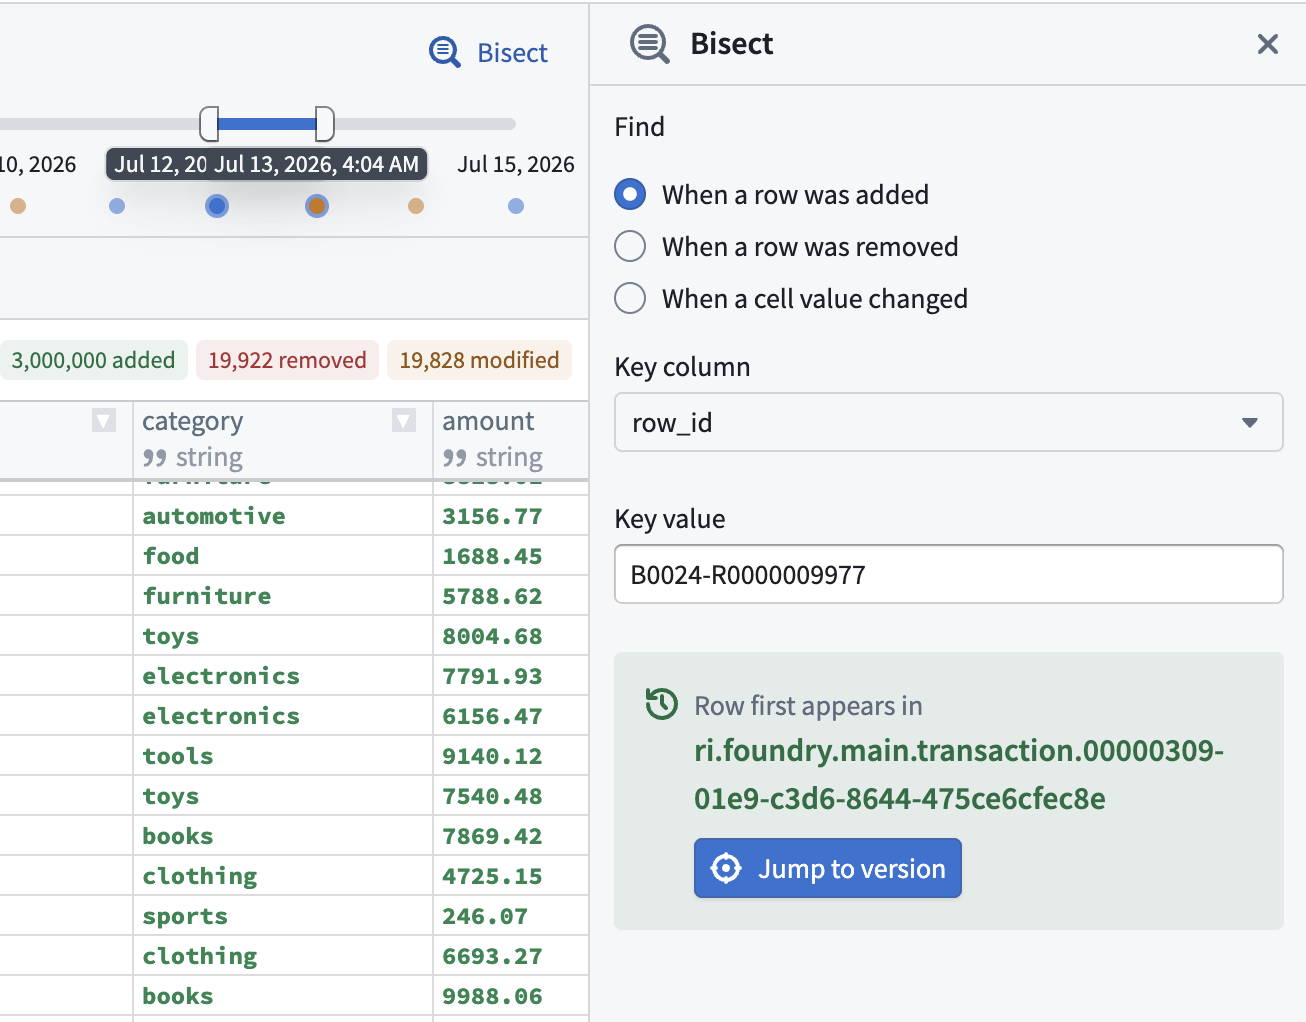
Use the Bisect tool to search dataset version history and find when specific changes occurred.
Tell us what you think
We welcome your feedback on the Time Travel feature. Share your thoughts with Palantir Support channels or our Developer Community ↗ .
AI FDE now supports Workflow Lineage
Date published: 2026-07-23
AI FDE now creates Workflow Lineage graphs. A Workflow Lineage graph shows every relationship between your resources in a single graph, so you can see dependencies without piecing them together manually. Use it to manage, debug, and reason about how your workflows connect.
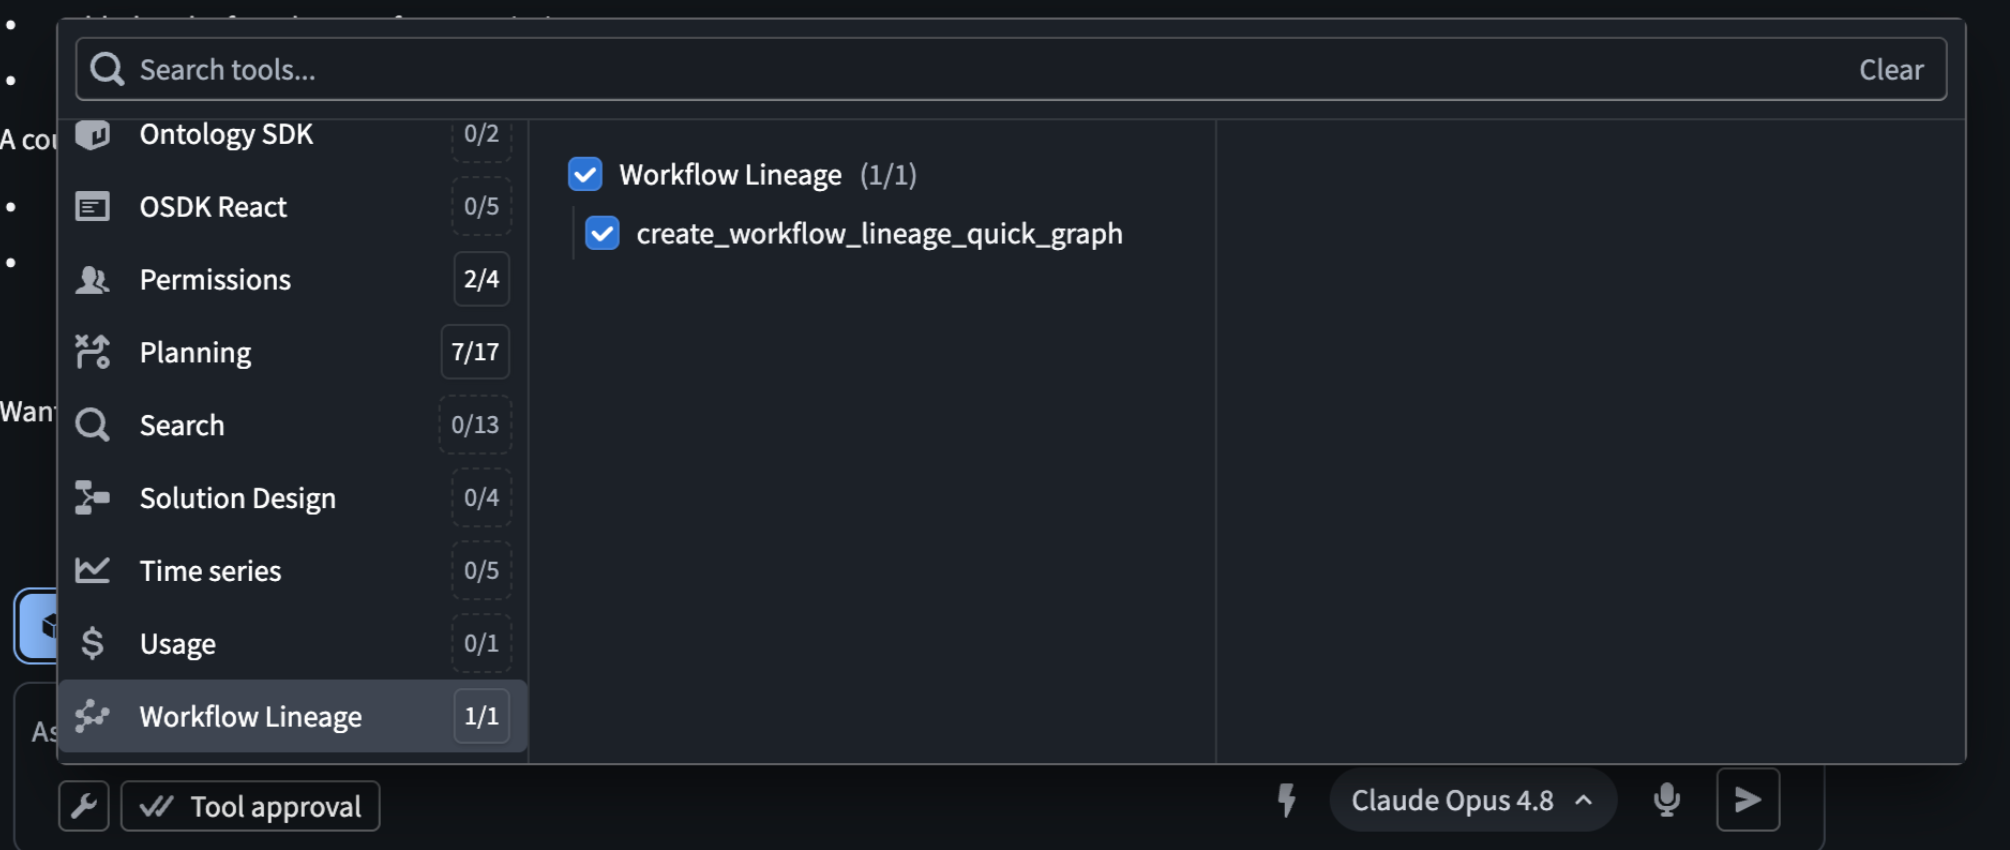
Workflow Lineage tool selected in AI FDE tool window.
How to use it
You can generate a lineage graph in two ways:
- Quick view: Press
CMD + i(MacOS) orCTRL + i(Windows) in the AI FDE window to generate a graph of all resources in your current chat context. - Custom graph: Ask AI FDE what you want to see—specific resources, downstream dependencies, or a slice of your workflow—and it builds a lineage graph for that request. It can also annotate the graph with text nodes that describe how your workflow maps together and what it does.
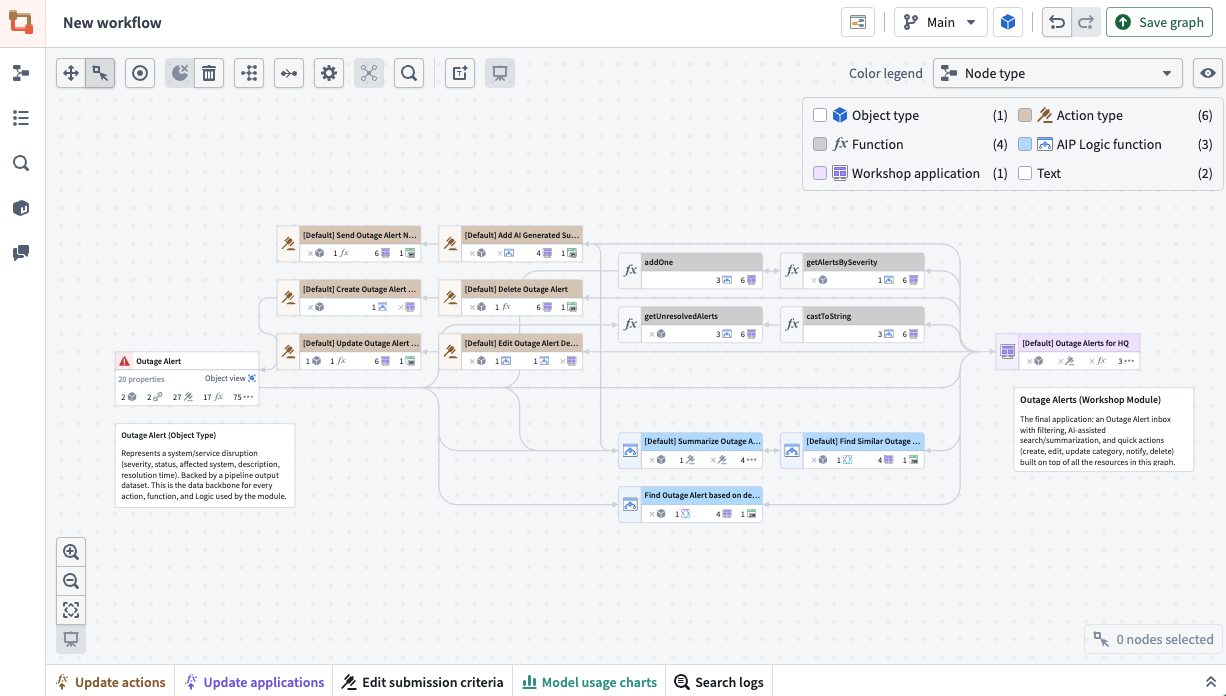
Workflow Lineage graph generated by an AI FDE session.
Why it matters
As workflows grow, tracking how resources relate gets harder to hold in your head or in scattered notes. A Workflow Lineage graph puts those relationships in one place, so you can spot dependencies, catch issues, and annotate your workflows in a single graph.
Your feedback matters
We want to hear about your experiences using language models in the Palantir platform and welcome your feedback. Share your thoughts with Palantir Support channels or on our Developer Community ↗ using the ai-fde tag and the workflow-lineage tag .
Widget display optimization in Workshop
Date published: 2026-07-23
Workshop now lets builders control when individual widgets mount and unmount as users navigate within a module. This is an advanced feature that can improve application performance and the user's navigation experience when applied properly.
By default, Workshop widgets mount when they become visible and unmount when they are no longer rendered by their layout, which keeps browser resource usage bounded as users navigate a module. This default works for most modules, but it can be disruptive for widgets that perform expensive initial loads or hold local state that you do not want reset on every visit. This is particularly common with custom widgets, whose internal state is discarded when the widget's iframe unmounts off-screen.
Learn more about widget display optimization in the documentation.
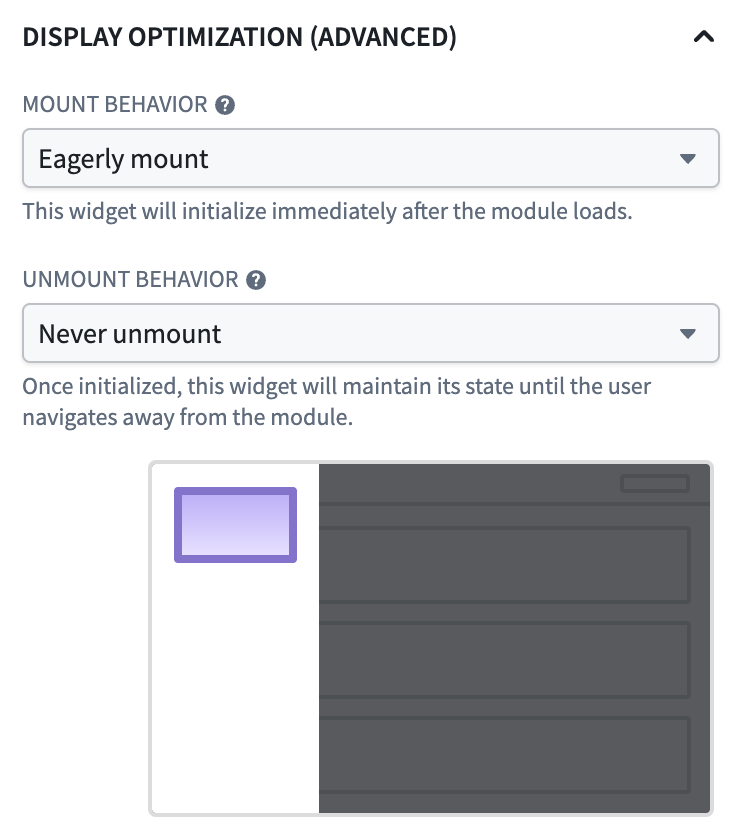
Widget display optimization configuration panel showing "eagerly mount" and "never unmount" rendering behaviors configured.
Available modes
Display optimization is controlled by two independent settings on each widget:
- Mount behavior: Mount with the layout (default), Delay until on-screen, or Eagerly mount at module load.
- Unmount behavior: Unmount with the layout (default), Unmount when off-screen, or Never unmount for the rest of the session.
When to use display optimization
Widget display optimization is an advanced setting. Keeping widgets mounted that are not currently in view consumes browser memory and can degrade module performance if applied broadly, so the default values remain the right choice for most widgets. The new settings are most useful when:
- A custom widget holds local state that should be preserved across navigation.
- A widget runs an expensive query or renders a large dataset, and users frequently navigate away and back.
- A widget on a frequently visited destination page should be ready before the user navigates to it, at the cost of a longer initial module load.
- A heavy widget in a long scrollable layout should release memory whenever it is scrolled out of view.
You can use the Performance Profiler to measure the impact of display optimization changes before applying them broadly across a module.
Restricted Views now support Global Branching
Date published: 2026-07-21
Restricted views now integrate with Global Branching. You can build and test changes to a restricted view's policy and markings on a branch before merging into main.
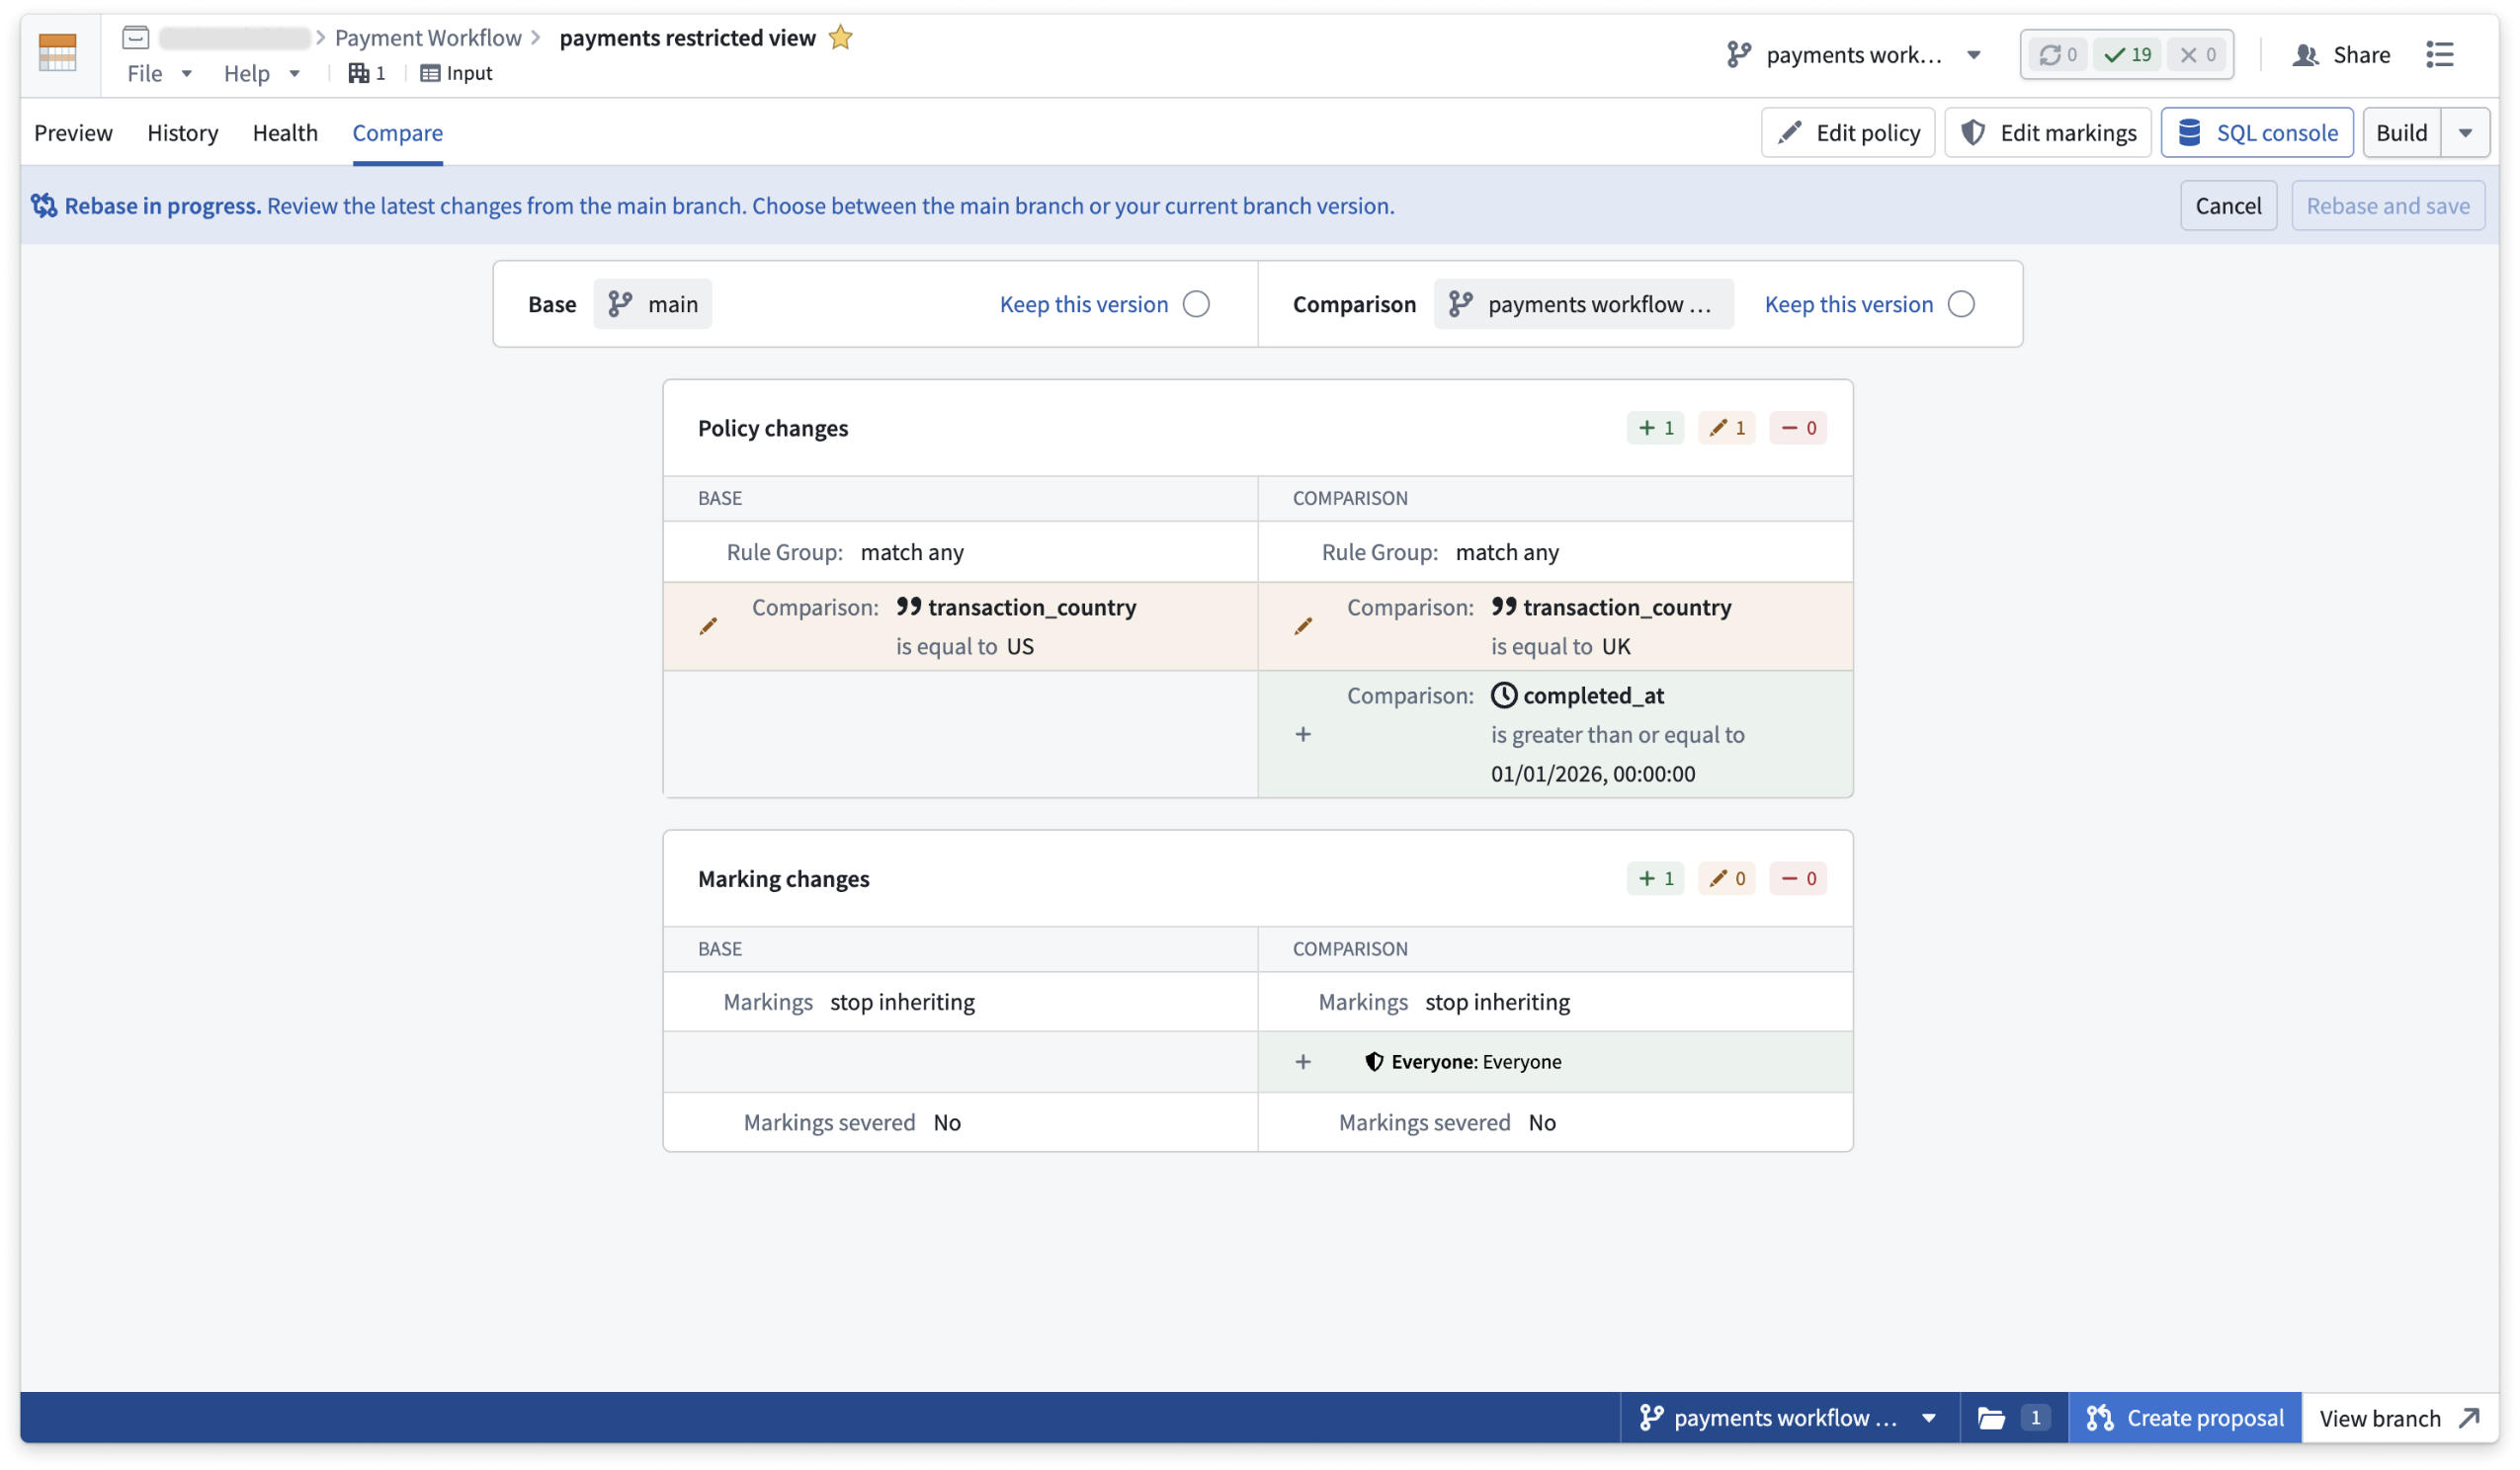
Compare a restricted view's policy and marking changes against main during a rebase.
Highlights
- Build on a branch: Build a restricted view on a branch to propagate upstream changes to its backing dataset on that branch.
- Test policy and markings changes: Restricted view owners can edit policies and modify markings on a branch.
- Rebase: When main has moved on, rebase your restricted views to bring in new changes from main or keep the changes on your branch.
- Protect: Use project policies to require that all edits to main go through a branch and review.
Considerations
- Differing markings between a branch and main on a backing dataset can expose previously restricted data. Review markings before you share a branch.
- Some datasets do not support branching. Restricted views downstream of those datasets don't build on a branch.
Your feedback matters
Share your thoughts through Palantir Support or our Developer Community ↗ using the global-branching tag ↗.
View and debug permission issues in Workflow Lineage
Date published: 2026-07-21
Understanding which users can access what resources and why is critical for builders and platform administrators. You can now view and debug permission issues in Workflow Lineage directly from the graph, making it easier to manage security policies and resolve issues with action submission criteria. Learn more about managing security in Workflow Lineage.
Debug action submission issues in one place
The new Debug permissions feature helps you quickly view and understand user issues with submitting actions.
You can access this feature from the Ontology permissions color mode by selecting Debug permissions to open the left side panel; you can also select an action and open Selection details to access this panel.
Under Check action submission, choose the user in question to see exactly what's required, and what's missing, for them to submit the selected action.
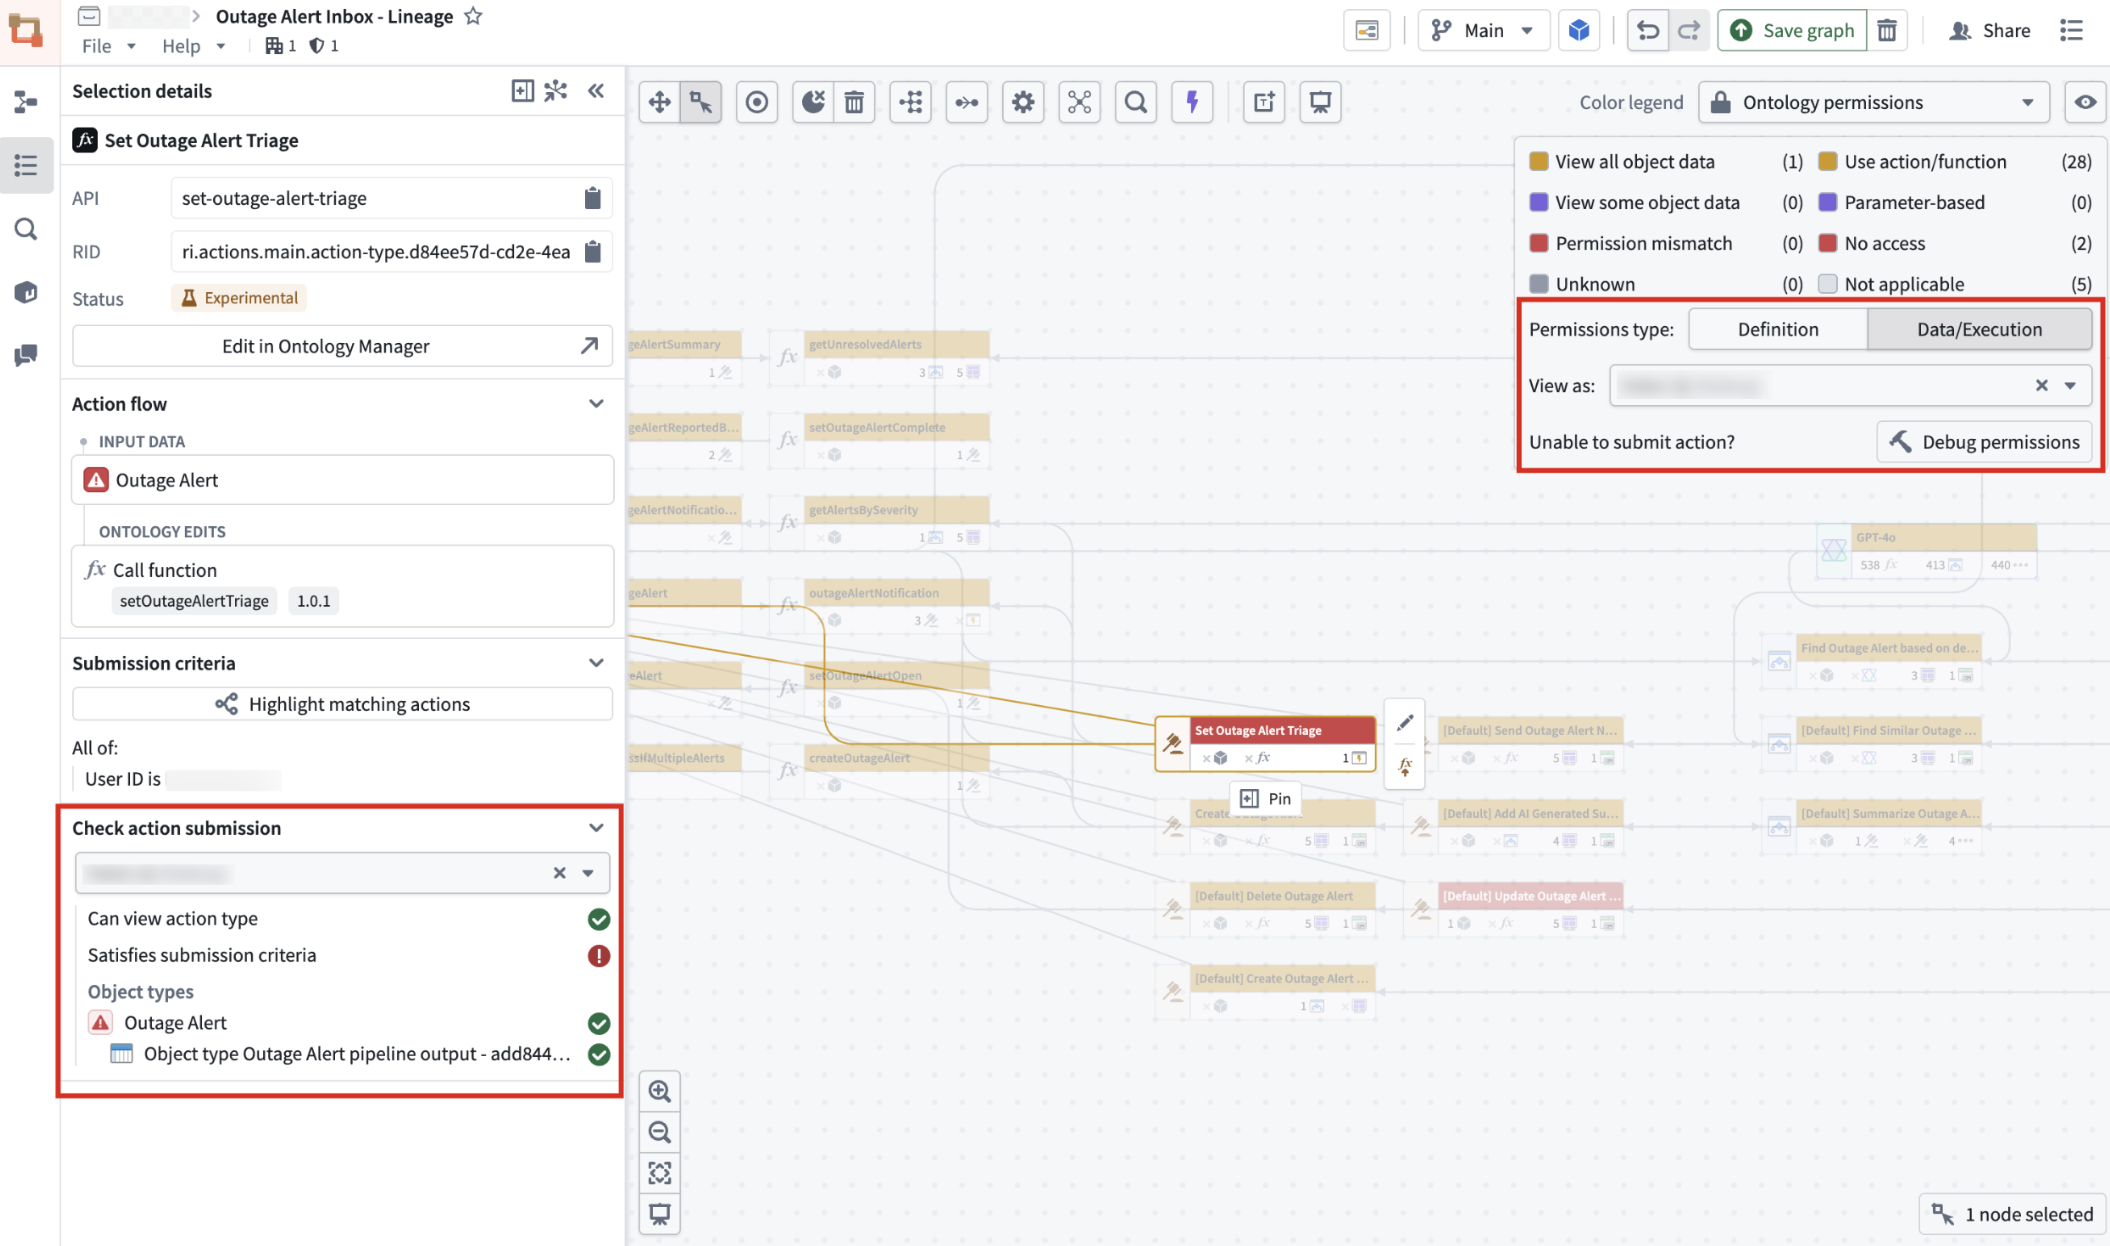
Selecting a user under Check action submission shows whether they can view the action type and whether they satisfy its submission criteria.
Find matching object security policies
You can now see which objects on your graph share, or partially share, the security policies of any object you select.
To do this, select an object, open Selection details, and go to the Security policy section to view its granular policy.
From there, select Highlight matching actions to highlight every object on the graph with a matching or partial-matching policy.
Select Exit highlight mode when you're done.
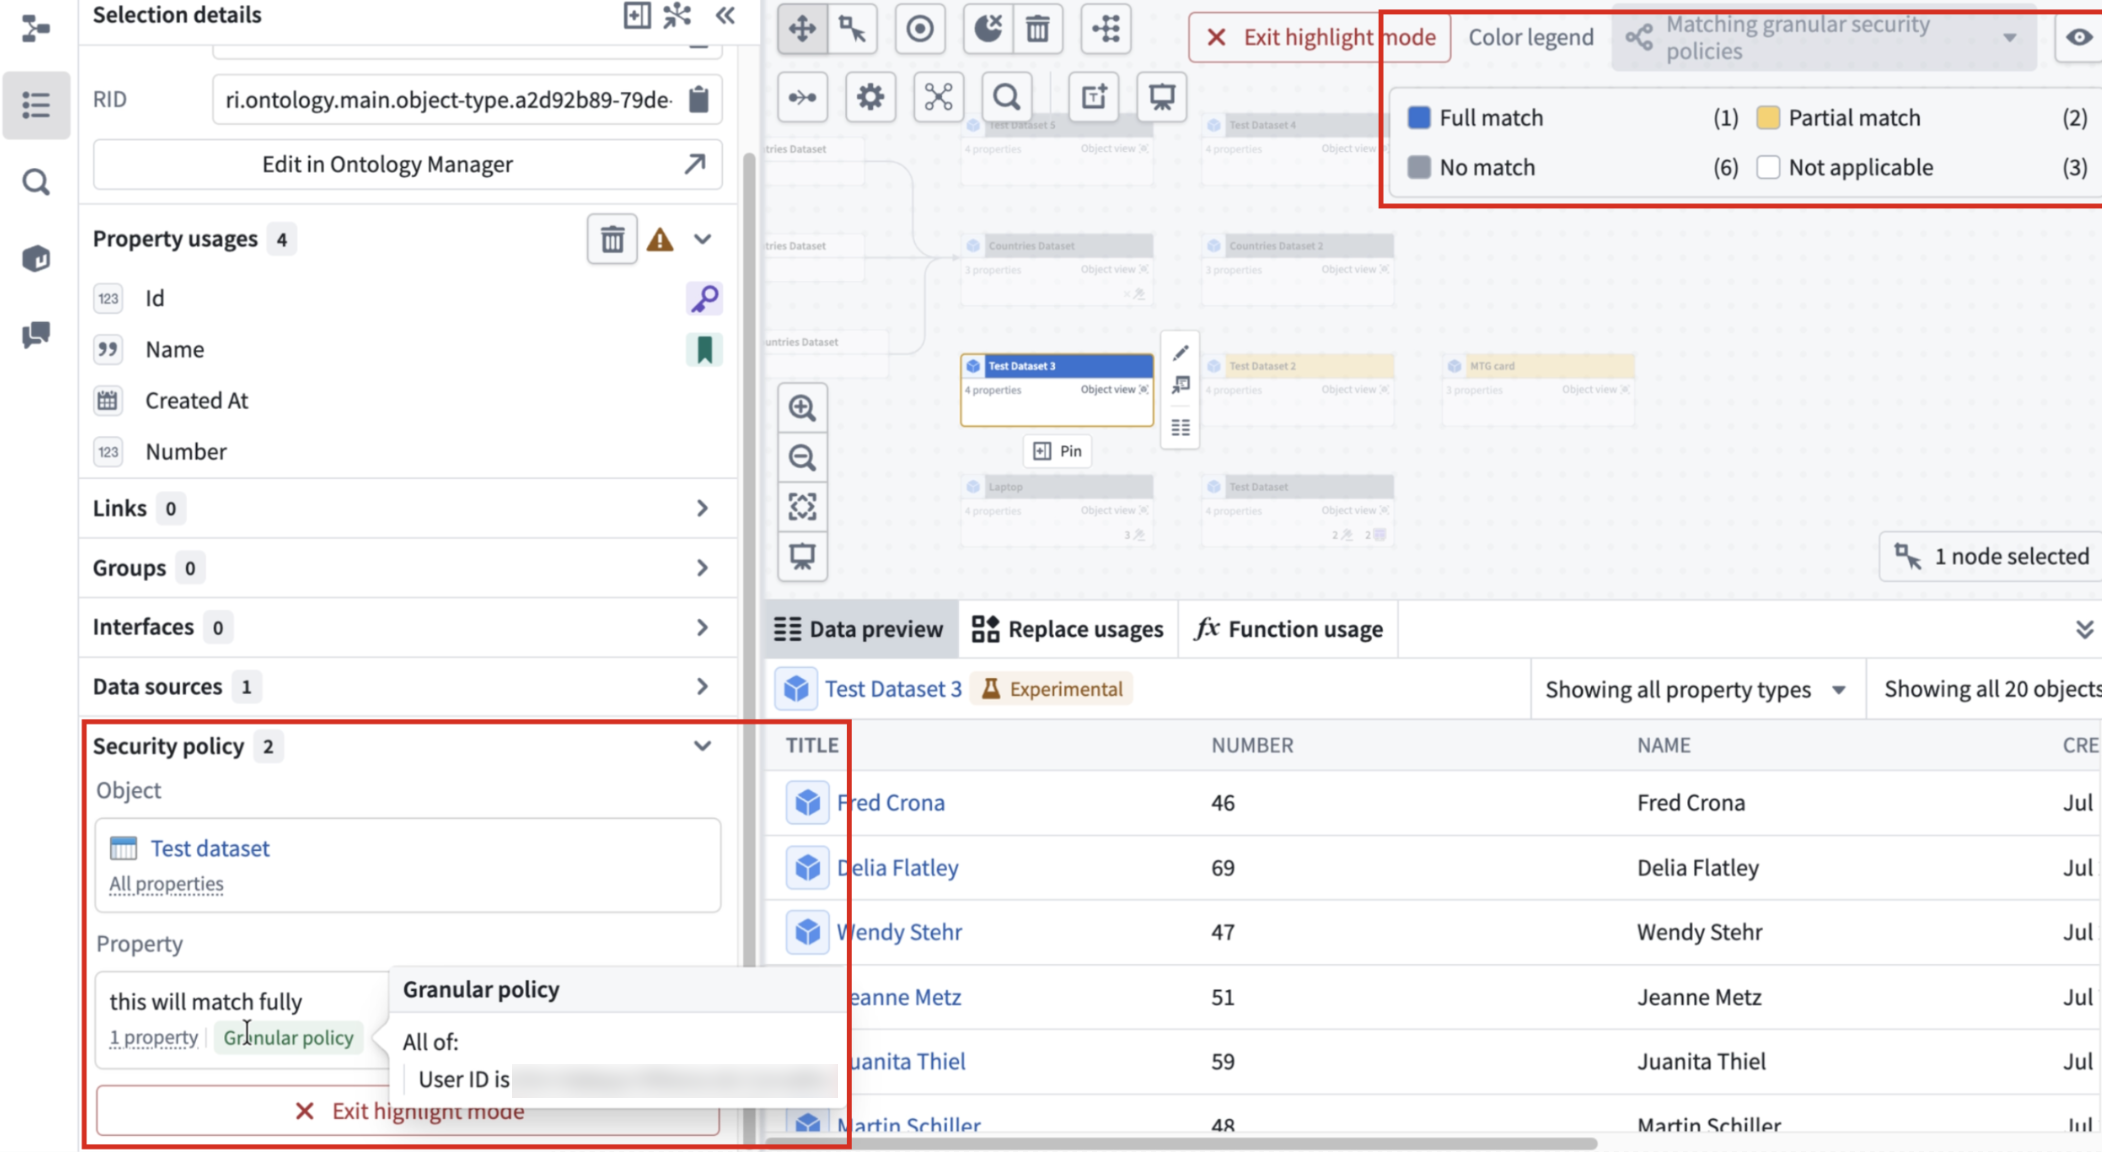
The Security policy section shows the granular policy for a selected object, with an option to highlight objects with matching granular policies across the graph.
Your feedback matters
We want to hear about your experiences with debugging permissions in the Palantir platform and welcome your feedback. Share your thoughts with Palantir Support channels or on our Developer Community ↗ using the workflow-lineage tag ↗.
Monitor workflow health with the Observability Chart widget in Workshop
Date published: 2026-07-21
Assessing the health of a workflow used to mean opening each resource in turn to check its metrics. The Observability Chart widget, now generally available in Workshop, lets you plot metrics for the resources in your workflow over time so you can spot trends, anomalies, and performance shifts from a single page. This feature is now live across all enrollments.
As a standard Workshop widget, the Observability Chart can be combined with others in one module. Arrange the charts with Workshop's layout tools to build a custom observability dashboard that mirrors the structure of your workflow.
For a single workflow in Workshop, consider laying out several Observability Chart widgets as an observability dashboard for your operations.
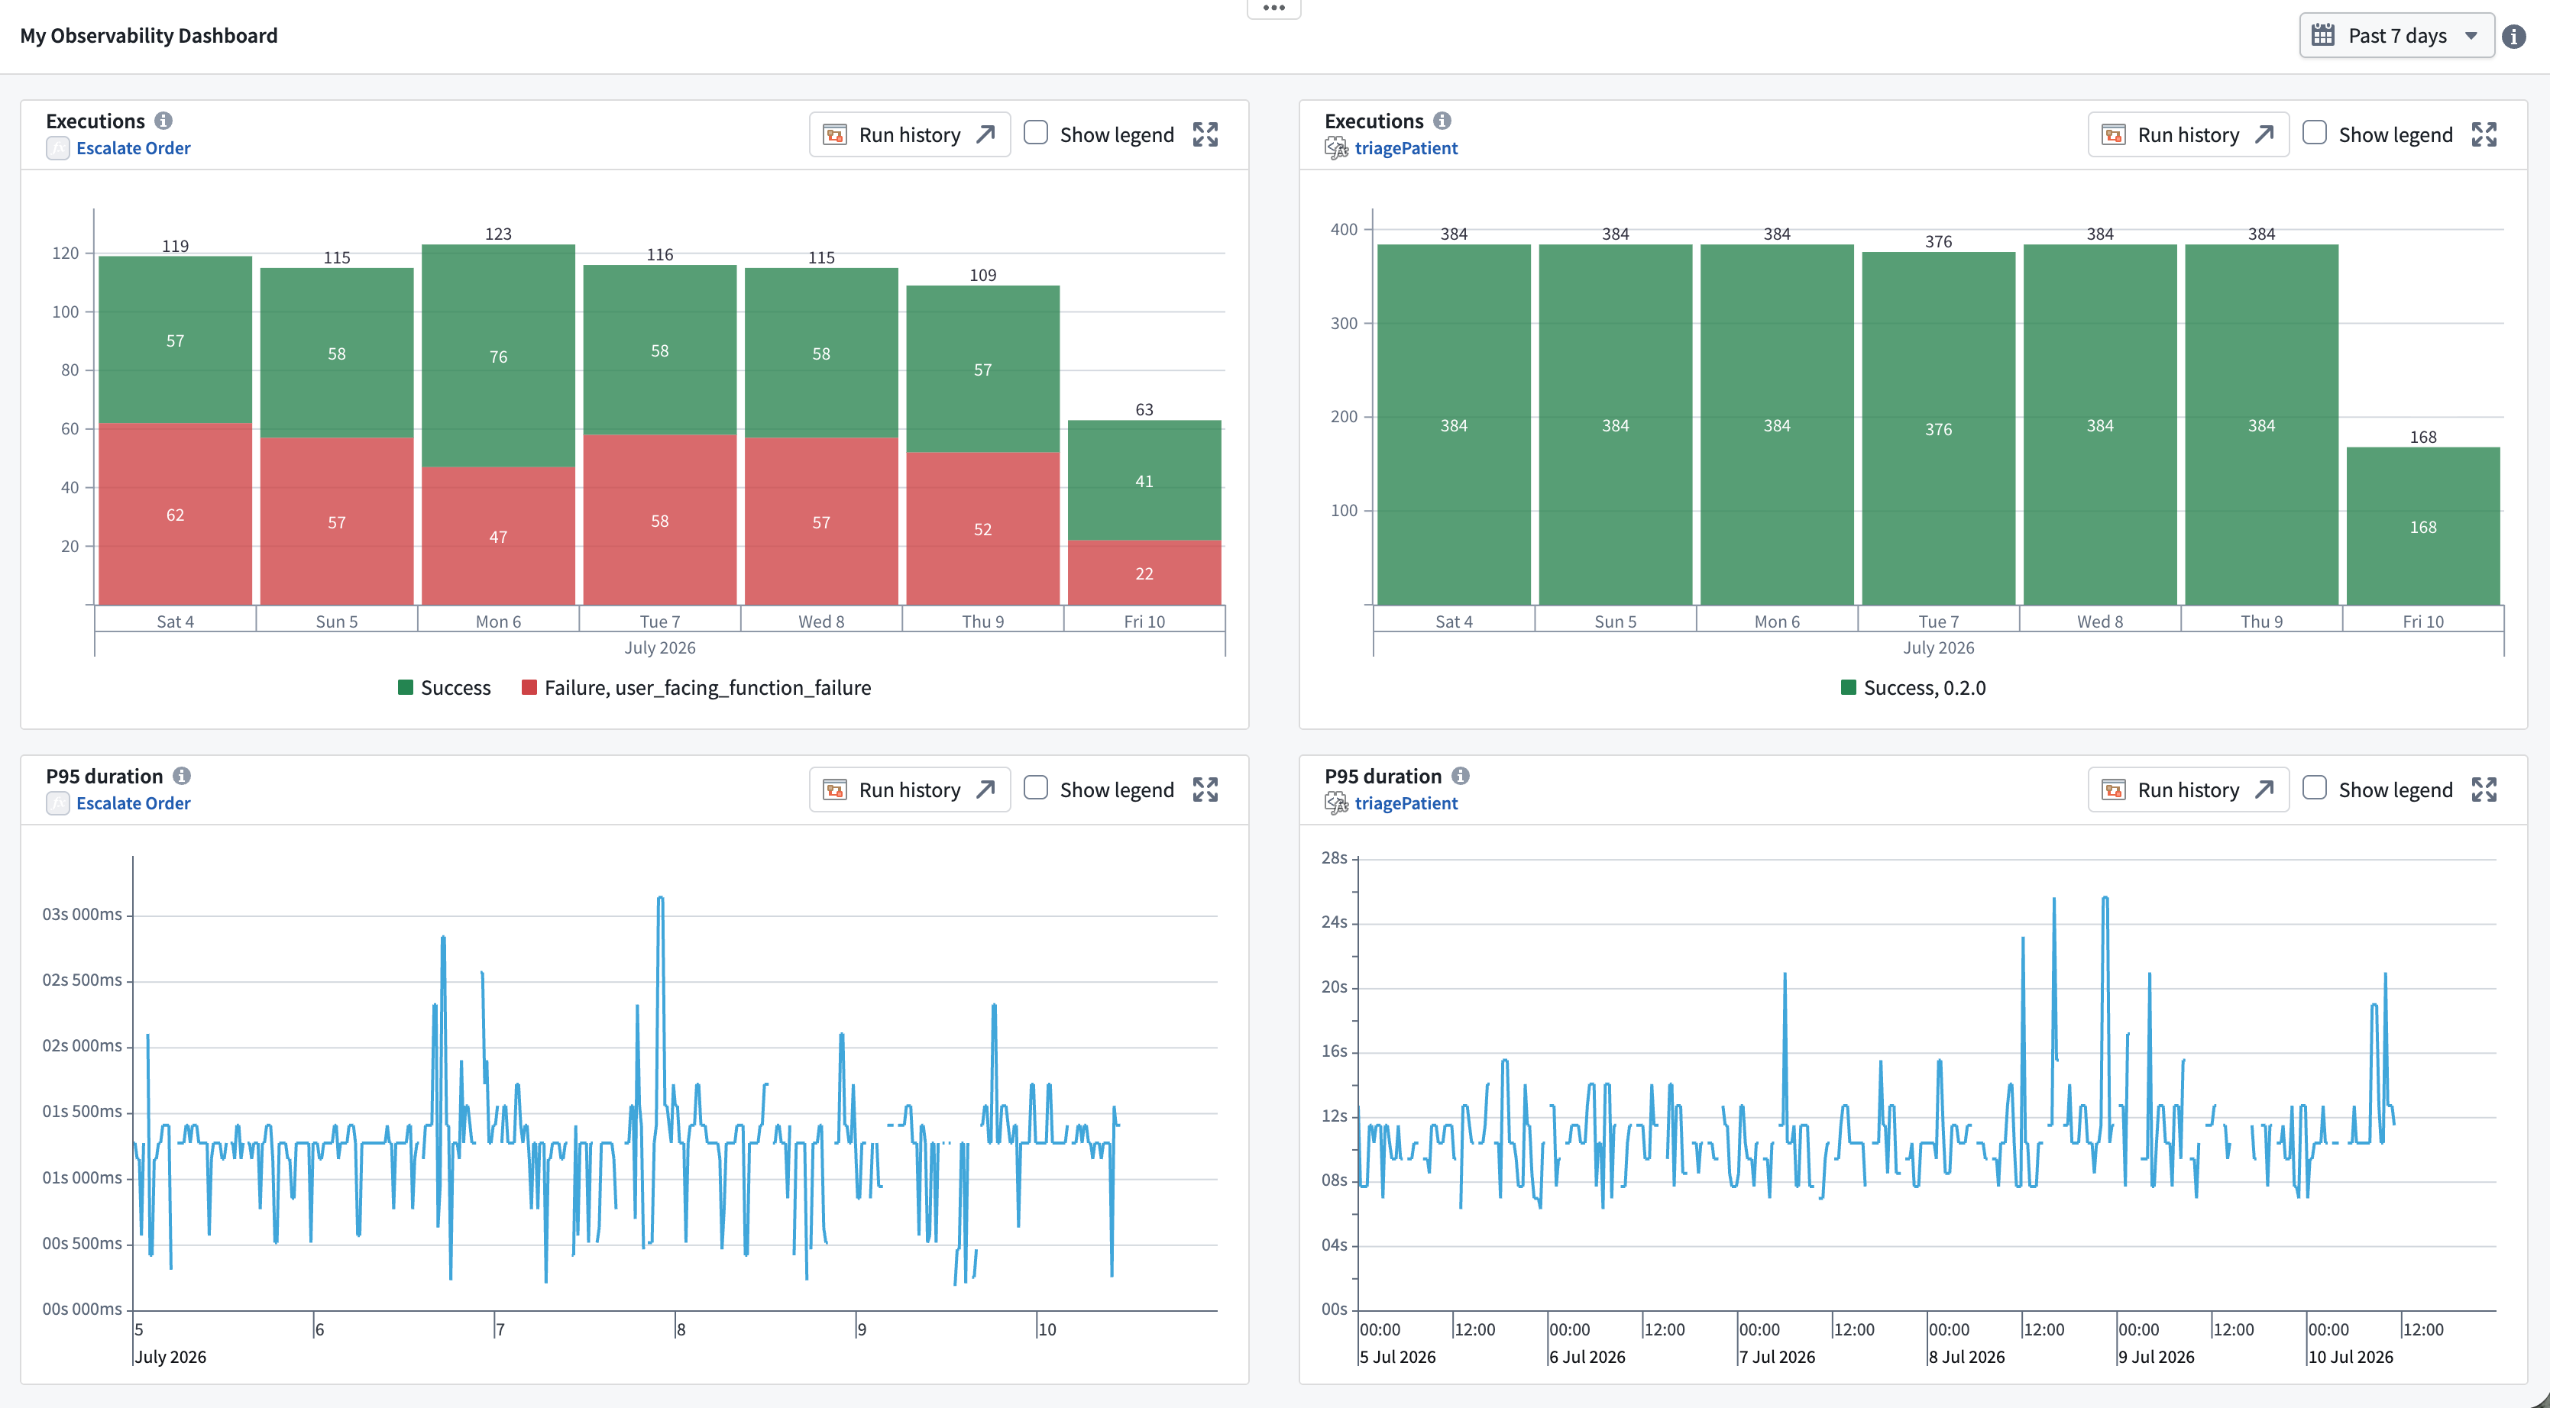
An observability dashboard built in Workshop from multiple Observability Chart widgets.
Note that charts require an active run; without one, they show an empty state. Metrics are retained for up to 30 days, with a shaded overlay marking the edge of available data.
Learn more about observability widgets in Workshop in the documentation.
What's included
The Observability Chart widget can visualize metrics for the following resource types:
- Actions and functions: Execution counts (success and failure) over time, and P95 execution duration
- Compute modules: CPU and memory usage per replica (a subset of compute module metrics)
Configure a widget by choosing a resource type, browsing for the resource with the resource picker, and selecting the metric to plot. Bind the widget's Start time and End time to timestamp variables to control the window it displays.
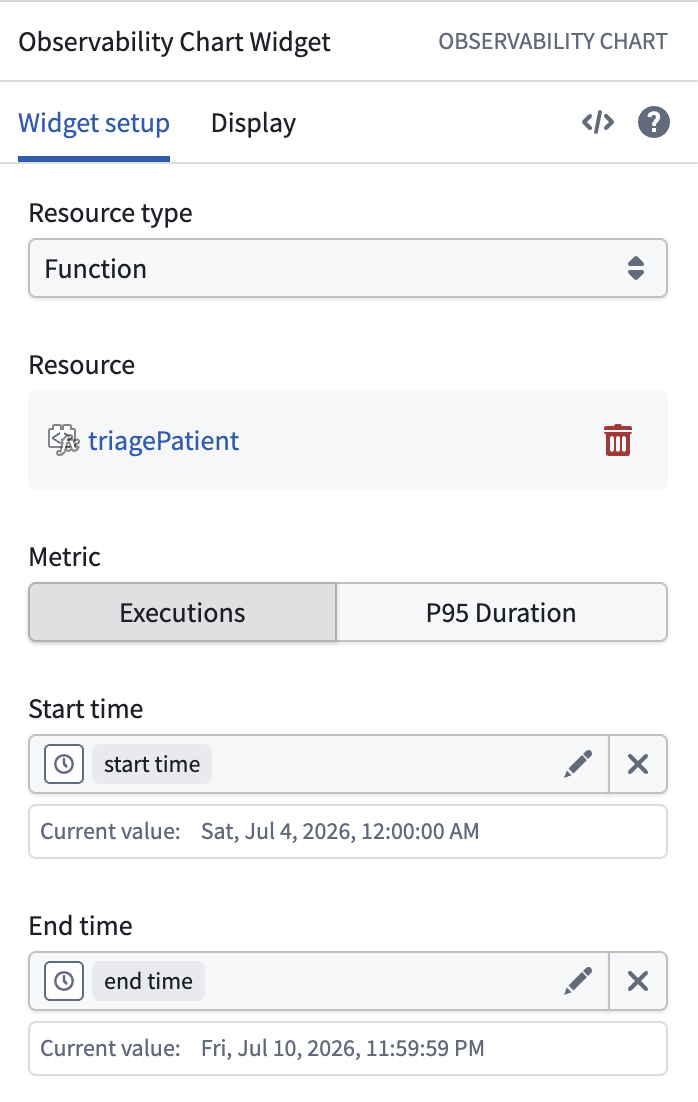
Configuring an Observability Chart widget with a resource and metric.
Explore across resources from one time range
Selecting a range directly on a chart updates its bound Start time and End time variables, and any other chart or widget bound to those same variables updates in step. When you build a dashboard around shared time variables, selecting a window on one chart re-scopes every chart bound to them—so you can trace an incident across multiple actions, functions, and compute modules without reconfiguring each widget.
When to use it
Ontology Manager and Workflow Lineage remain the place to inspect metrics for an individual resource. The Observability Chart widget is suited to composing those metrics into a durable, custom view of a workflow that you and your team can return to. It complements, rather than replaces, Data Health monitoring and alerting, which remain the tools for defining thresholds and receiving notifications when issues occur.
Your feedback matters
We want to hear about your experiences using Workshop and its widgets in the Palantir platform and welcome your feedback. Share your thoughts with Palantir Support channels or on our Developer Community ↗ using the workshop tag ↗.
Grok-4.5 from xAI is now available in AIP
Date published: 2026-07-14
Grok-4.5 is xAI's newest model, the first of which is trained using Cursor developer data. Grok-4.5 runs on V9, xAI’s new 1.5 trillion parameter foundation, roughly three times the size of the v8-small architecture behind Grok 4.3.
Metadata
- Context Window: 500k tokens
- Modalities: Text/Image input; text output
- Capabilities: Function calling, reasoning, structured outputs
For more information, review xAI's model documentation ↗.
Getting started
To use this model:
- Confirm your enrollment administrator has enabled the xAI model family.
- Review token costs and pricing.
- See the complete list of models available in AIP.
Your feedback matters
We want to hear about your experience using language models in the Palantir platform. Share your thoughts through Palantir Support channels or on our Developer Community ↗ using the language-model-service tag ↗.
GPT-5.6 series available in AIP
Date published: 2026-07-14
GPT-5.6 Sol, GPT-5.6 Terra, and GPT-5.6 Luna are now available in AIP on US georestricted or non-georestricted enrollments with Direct OpenAI enabled and for non-georestricted enrollments with Azure OpenAI enabled.
Model overviews
The GPT-5.6 series is OpenAI’s newest family of models. It includes a frontier model for advanced workloads, a balanced model for intelligence and cost, and a cost-effective model for high-volume use cases.
The GPT-5.6 series includes the following models:
- GPT-5.6 Sol: Frontier model in the GPT-5.6 family.
- GPT-5.6 Terra: Designed for workloads that balance intelligence and cost.
- GPT-5.6 Luna: Designed for cost-sensitive, high-volume workloads.
For more information, review OpenAI’s model documentation↗ and OpenAI’s GPT-5.6 announcement↗.
Model metadata
- Context window: 1,050,000 tokens
- Max output tokens: 128,000 tokens
- Knowledge cutoff: February 16, 2026
- Modalities: Text and image input; text output
- Capabilities: Function calling, streaming, structured outputs
Getting started
To use these models:
- Confirm that your enrollment administrator has enabled the relevant model family.
- Review token costs and pricing.
- See the complete list of models available in AIP.
Your feedback matters
We want to hear about your experiences using language models in the Palantir platform and welcome your feedback. Share your thoughts with Palantir Support channels or on our Developer Community ↗ using the language-model-service tag ↗.
Install and upgrade multiple products simultaneously in Marketplace
Date published: 2026-07-14
Marketplace now supports installing and upgrading multiple products in the same installation draft. Previously, you had to configure each product individually and manually choose linked product inputs between them. Marketplace now fulfills those inputs automatically from linked products in the same job.
Bulk installations
To create new product installations in bulk, navigate to a Marketplace store and select Create new installations in the top right corner. Check the boxes on the product cards you want to install, then select + Create new installations at the bottom of the page.
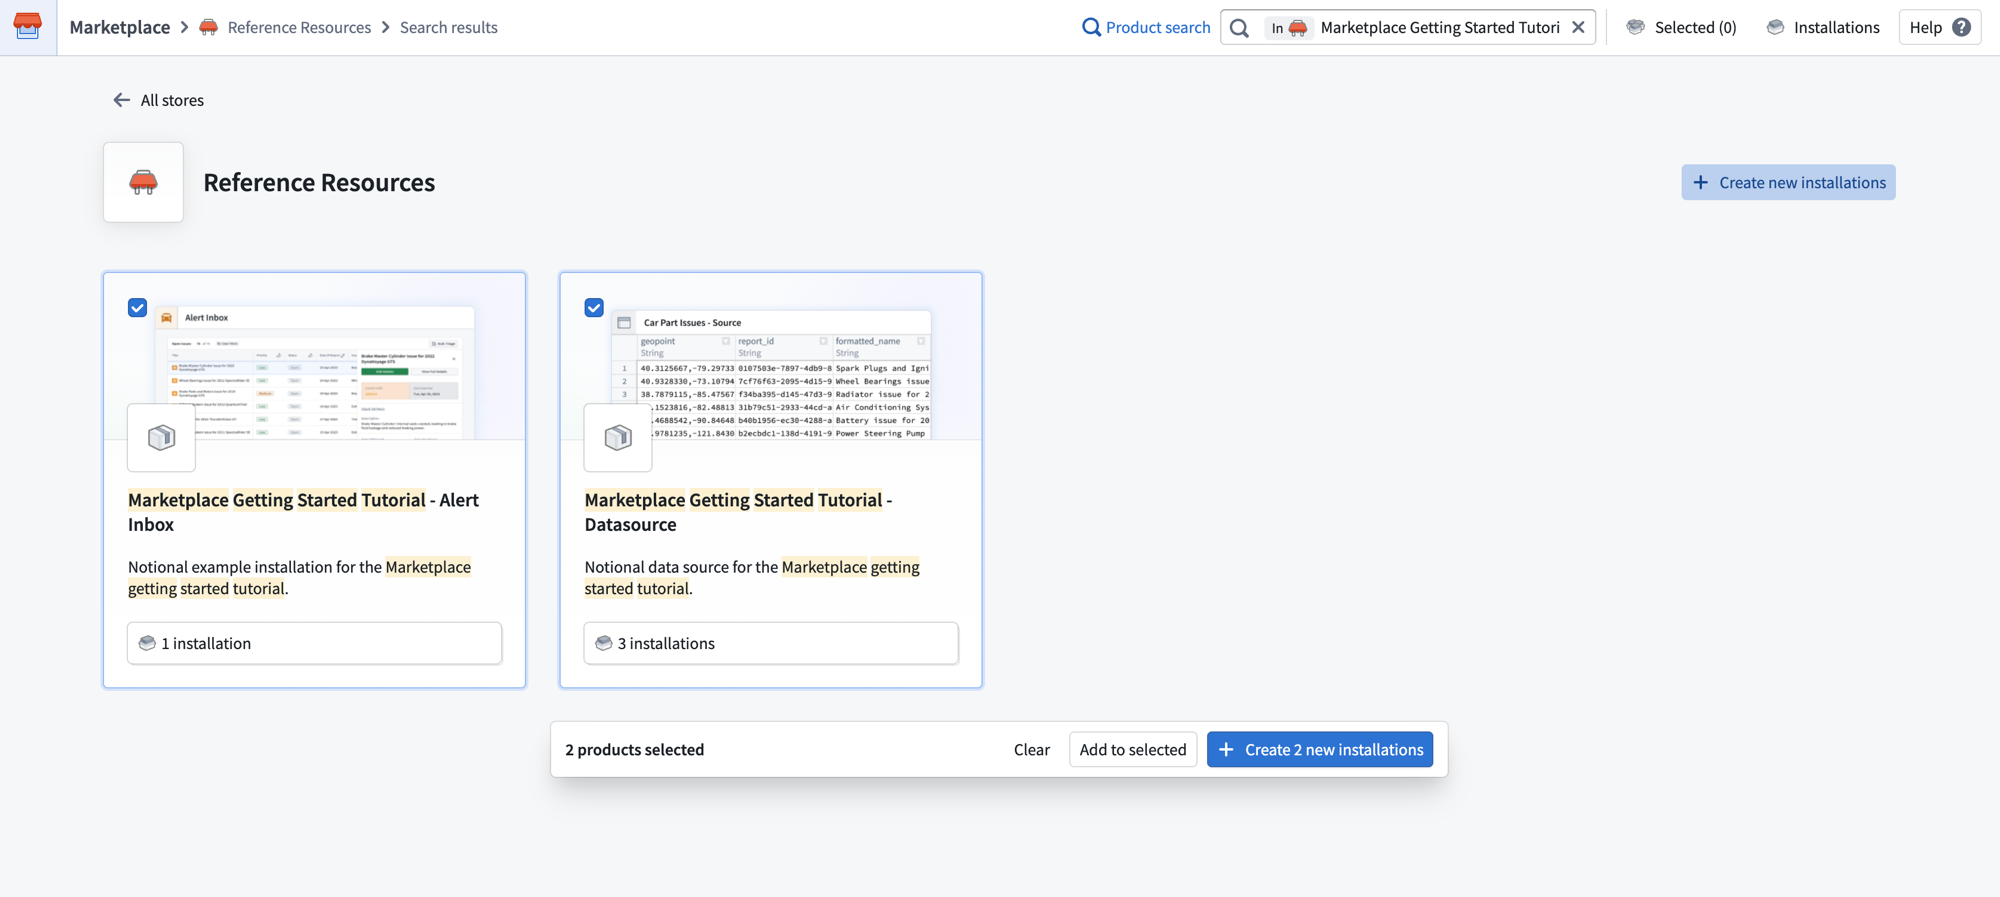
Use Create new installations to select and configure multiple product installations together.
In the Create installation job dialog, configure your installation location, project, and ontology for all selected products at once. The New Installations section lists each product and its version.
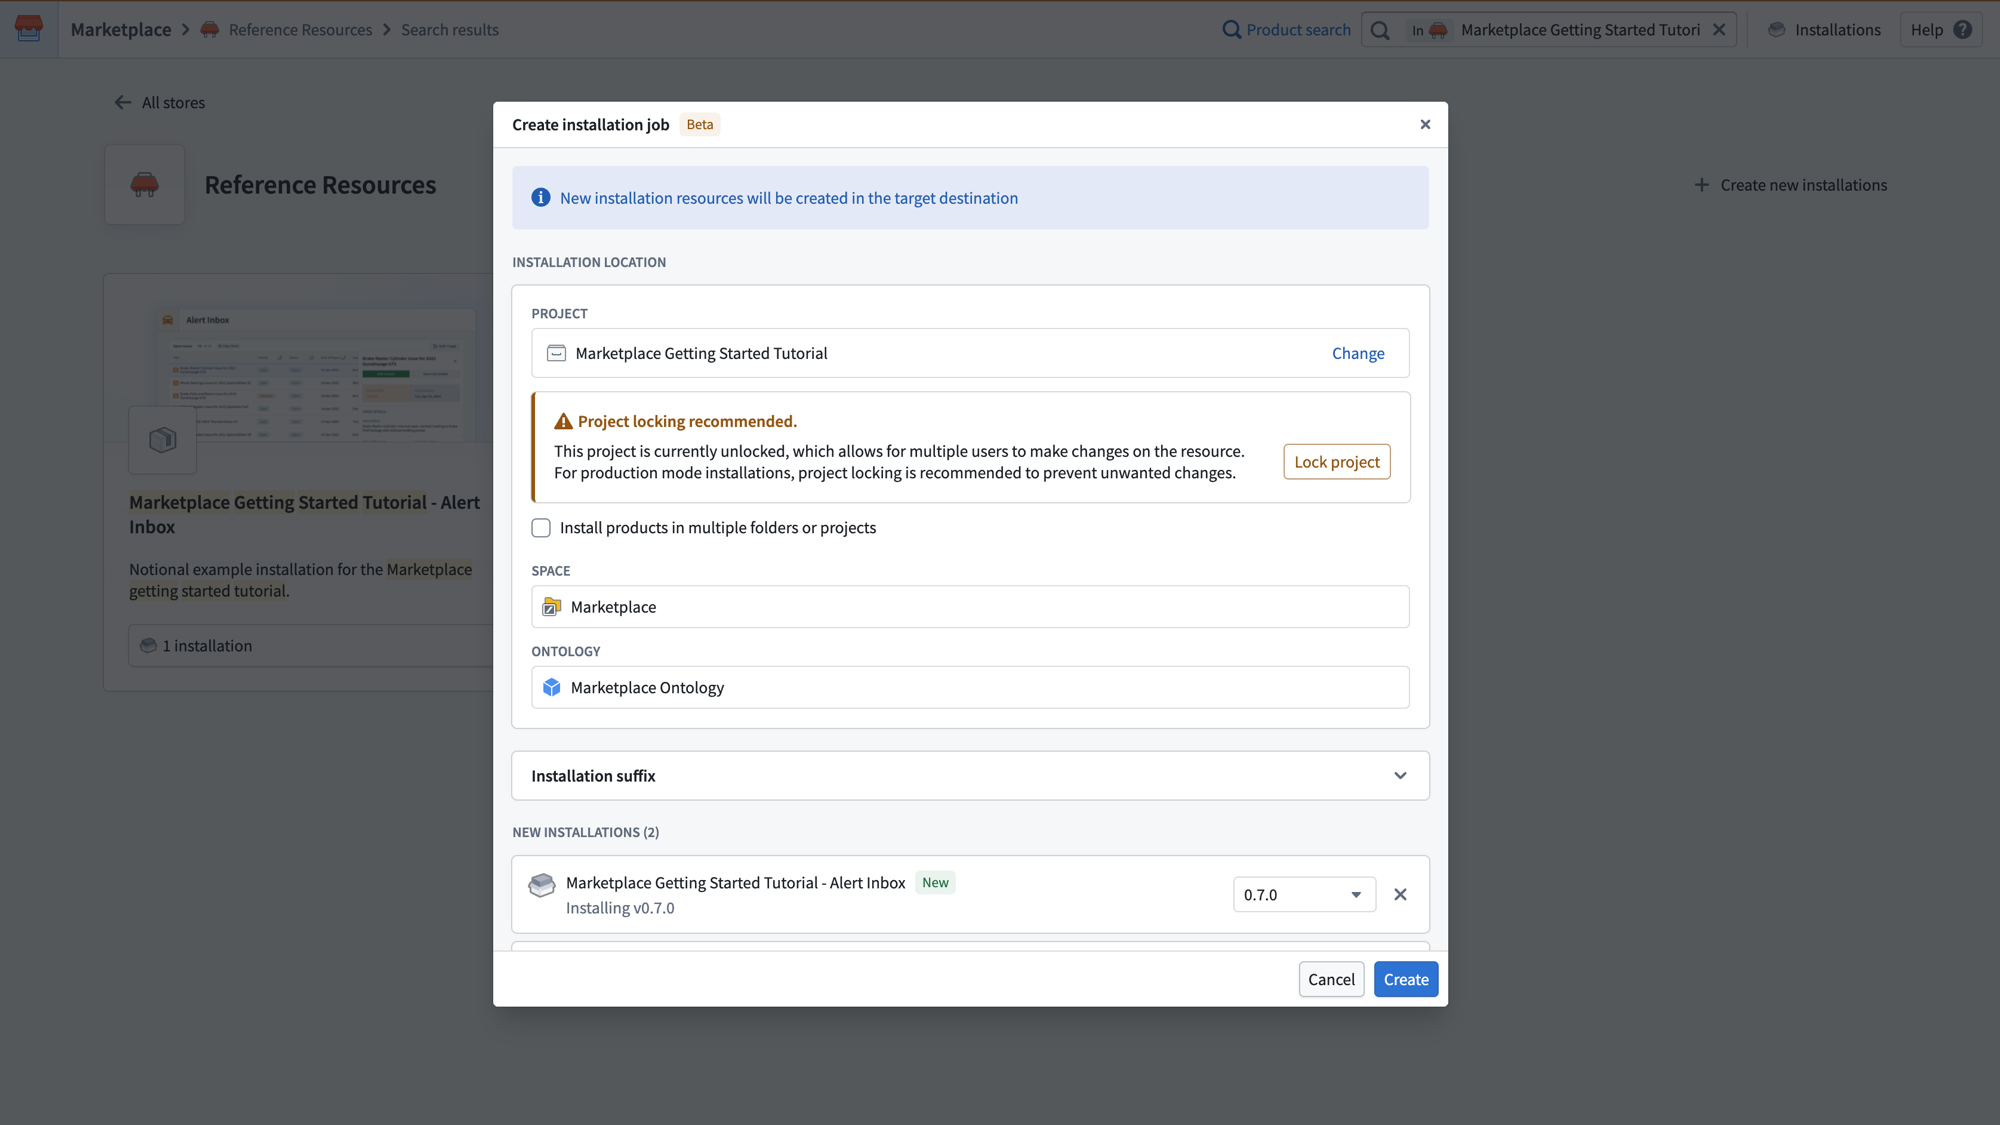
Configure the installation location, project locking, and ontology for all selected products in the Create installation job dialog.
After creating the job, the General page displays a dependency graph showing how your selected products relate to each other. The Add available linked products panel surfaces additional products that can fulfill inputs in your draft. You can add them as external references or include them as new installations in the same job.
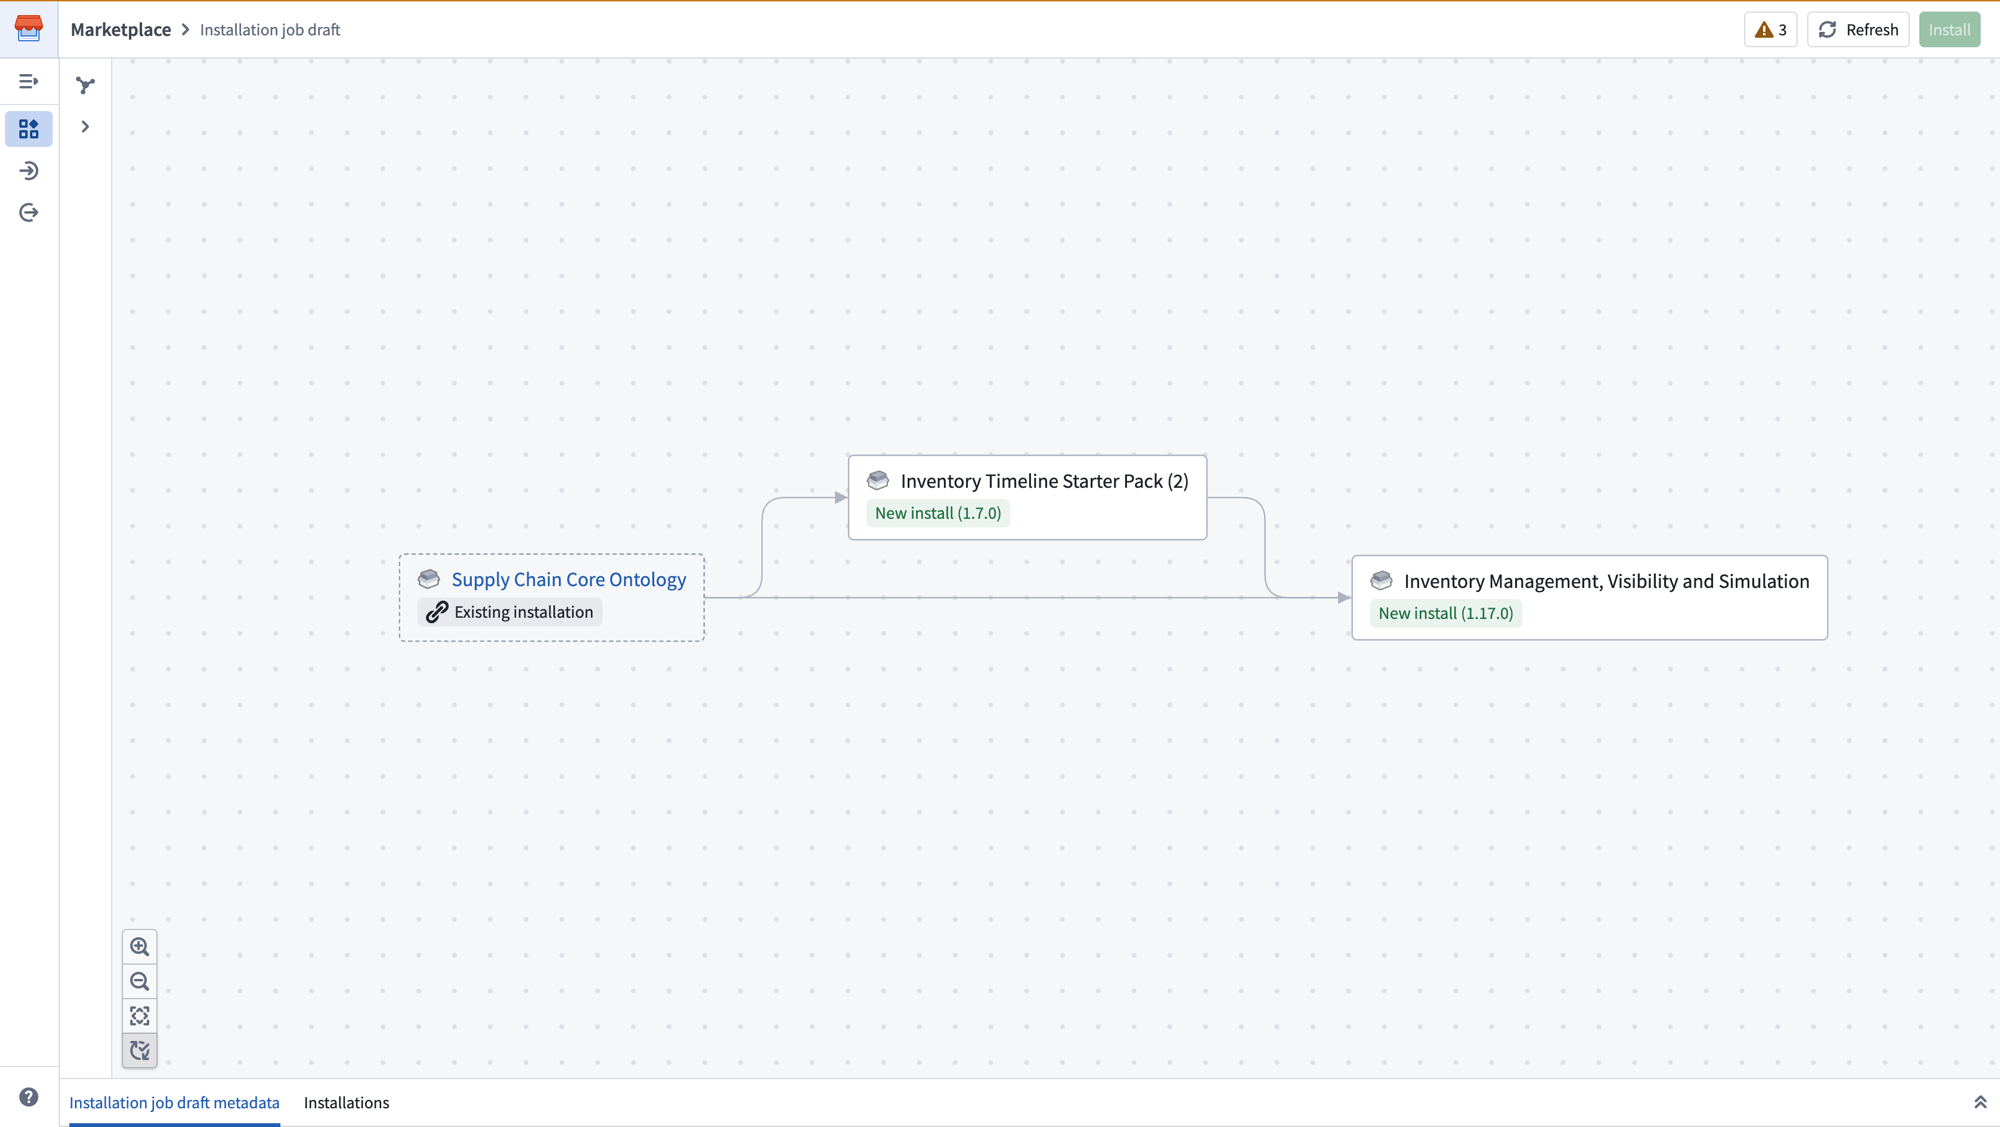
The dependency graph shows linked products and their relationships, with inputs automatically fulfilled between products in the same job.
As linked products are included in the same job, their outputs automatically fulfill inputs of downstream products, no manual mapping required. Select Install to run all installations together in a single job.
Bulk upgrades
You can now stage multiple installations for upgrade in a single job. Navigate to each installation page and add it to the Selected panel. Once all desired installations are selected, select Create installation job to begin the upgrade.
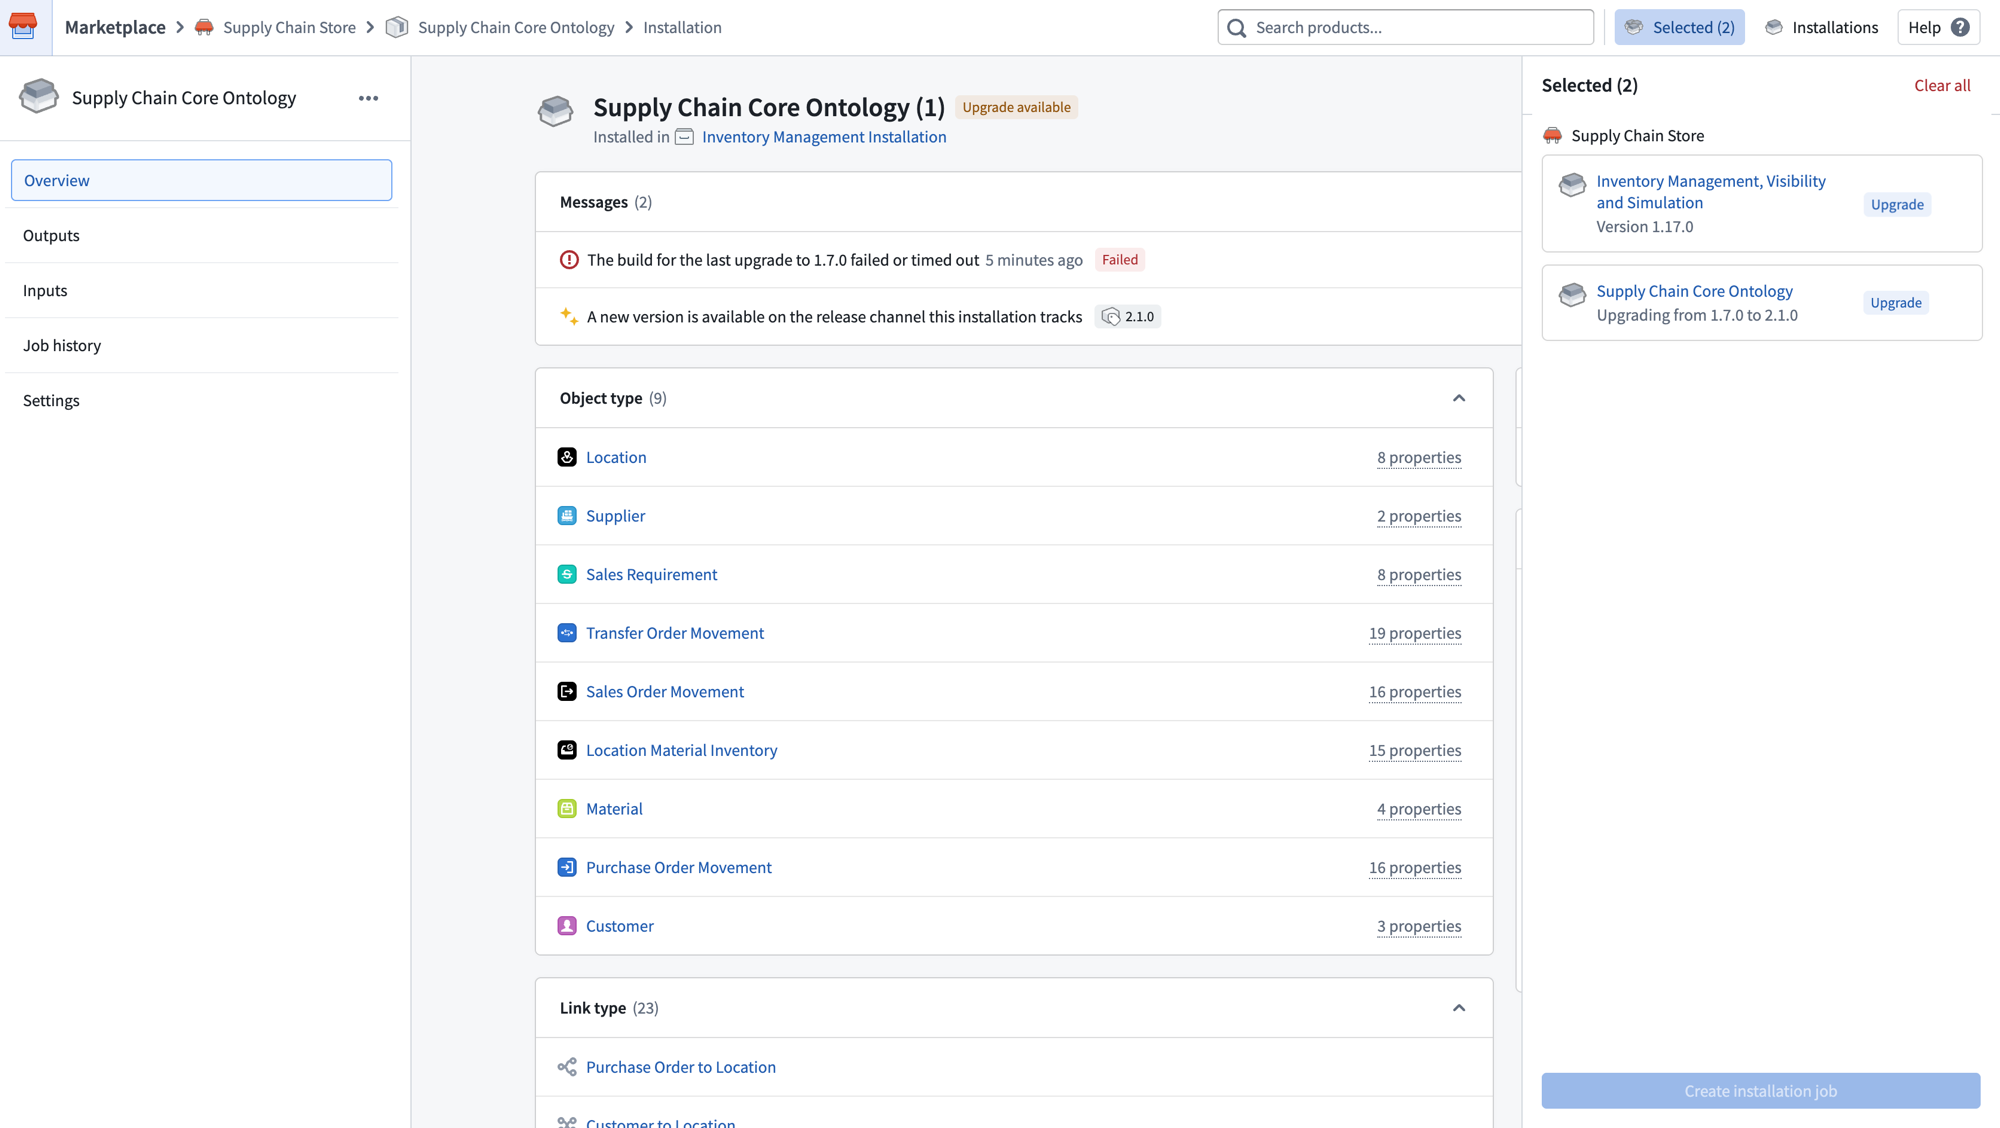
Stage multiple installations for upgrade in a single job using the Selected panel.
Improved input mapping
The installation draft now supports a more powerful input mapping page with filters and features like bulk mapping inputs. Select the checkboxes next to multiple inputs of the same type to configure them together.
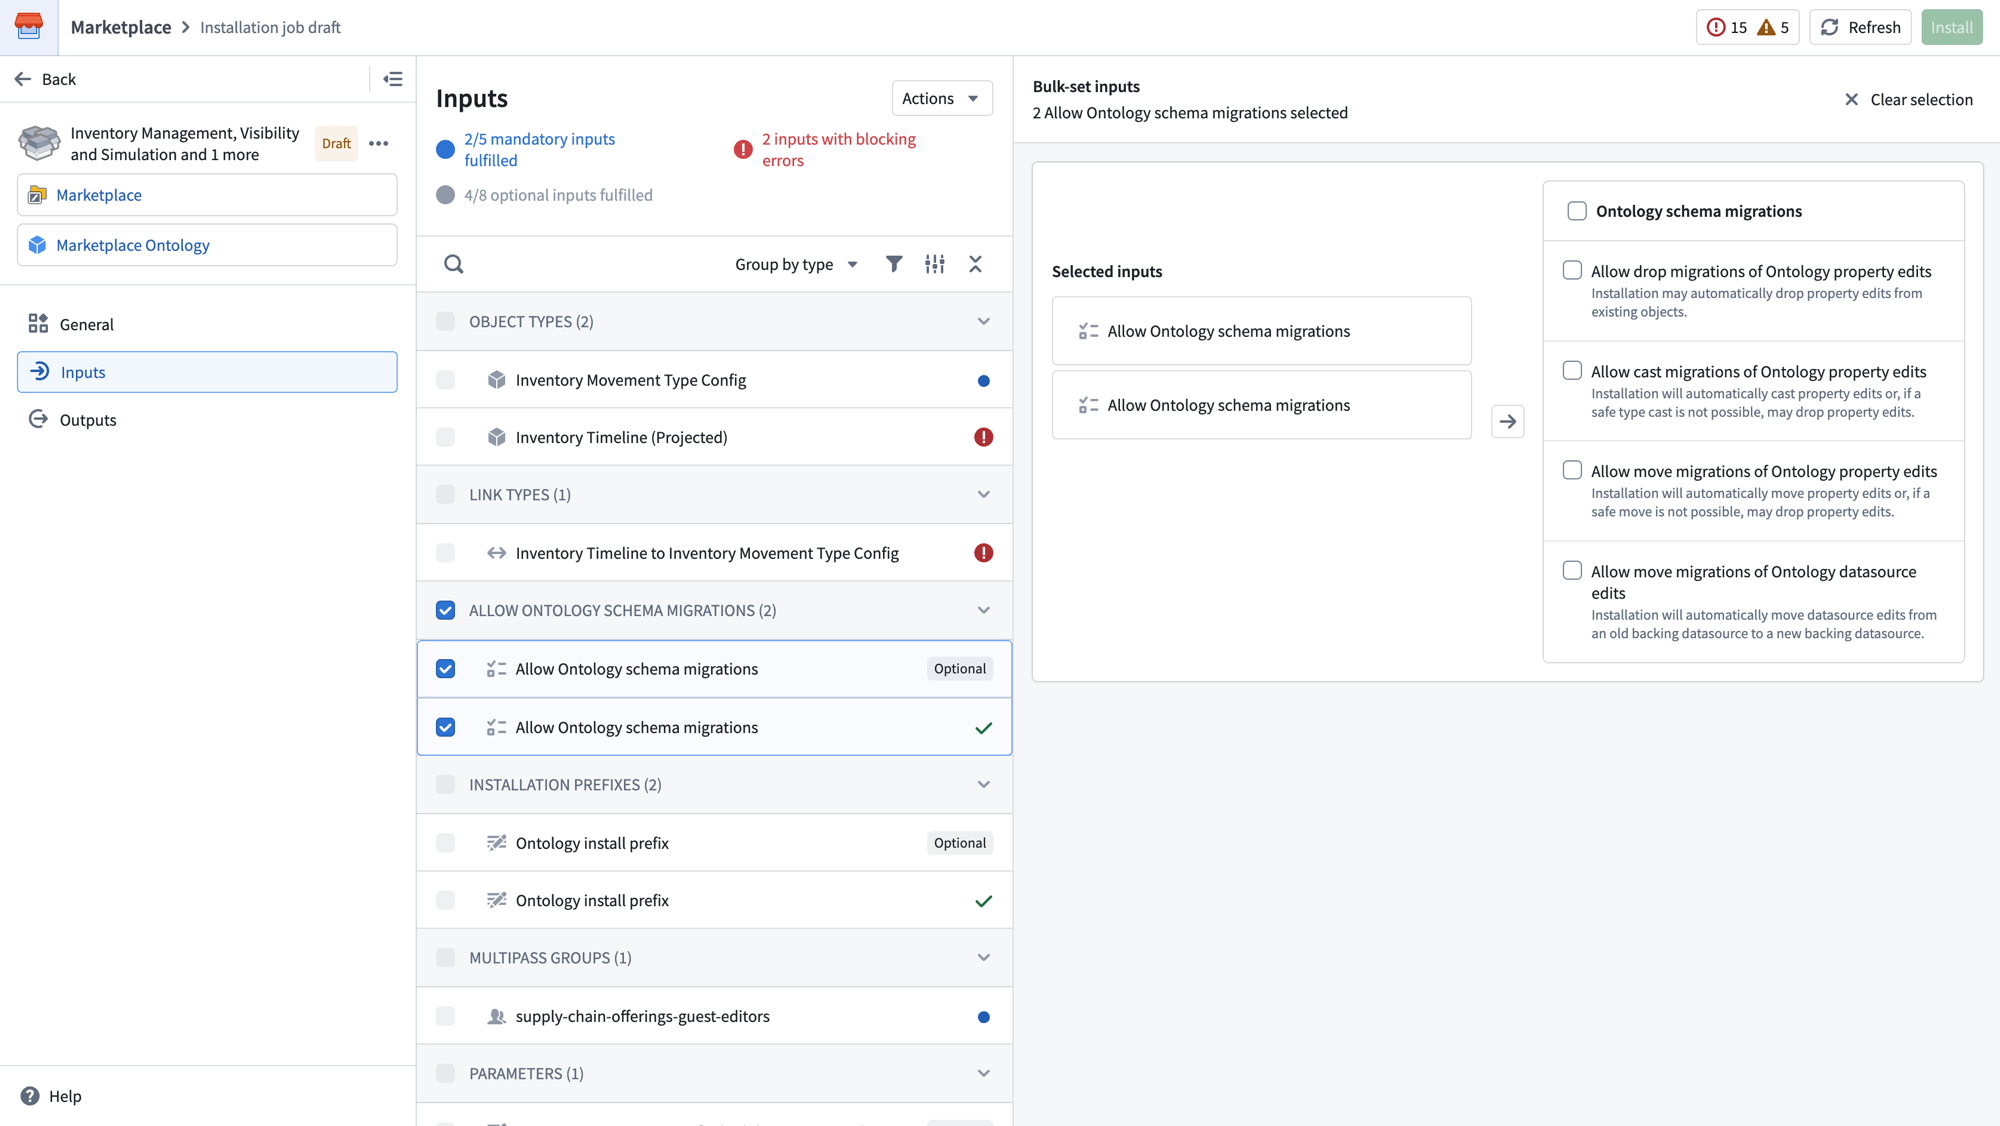
Select multiple inputs of the same type to bulk configure them together.
Share your feedback
We want to hear about your experiences with Marketplace. Share your thoughts with Palantir Support channels or on our Developer Community ↗ using the marketplace ↗ tag.
Build, configure, and ship pro-code agents
Date published: 2026-07-09
Foundry now makes it easier to build, configure, and ship pro-code agents. Agents combine a large language model with your Foundry data and tools. They can read and write Ontology data, fix failing builds, or migrate legacy systems into Foundry. Agents now authenticate against the Ontology SDK (OSDK), Ontology MCP (OMCP), and Palantir MCP with scoped permissions out of the box, so you no longer pass a client ID and secret to call tools. After you publish an agent, you can call it from Workshop or OSDK with no additional configuration.
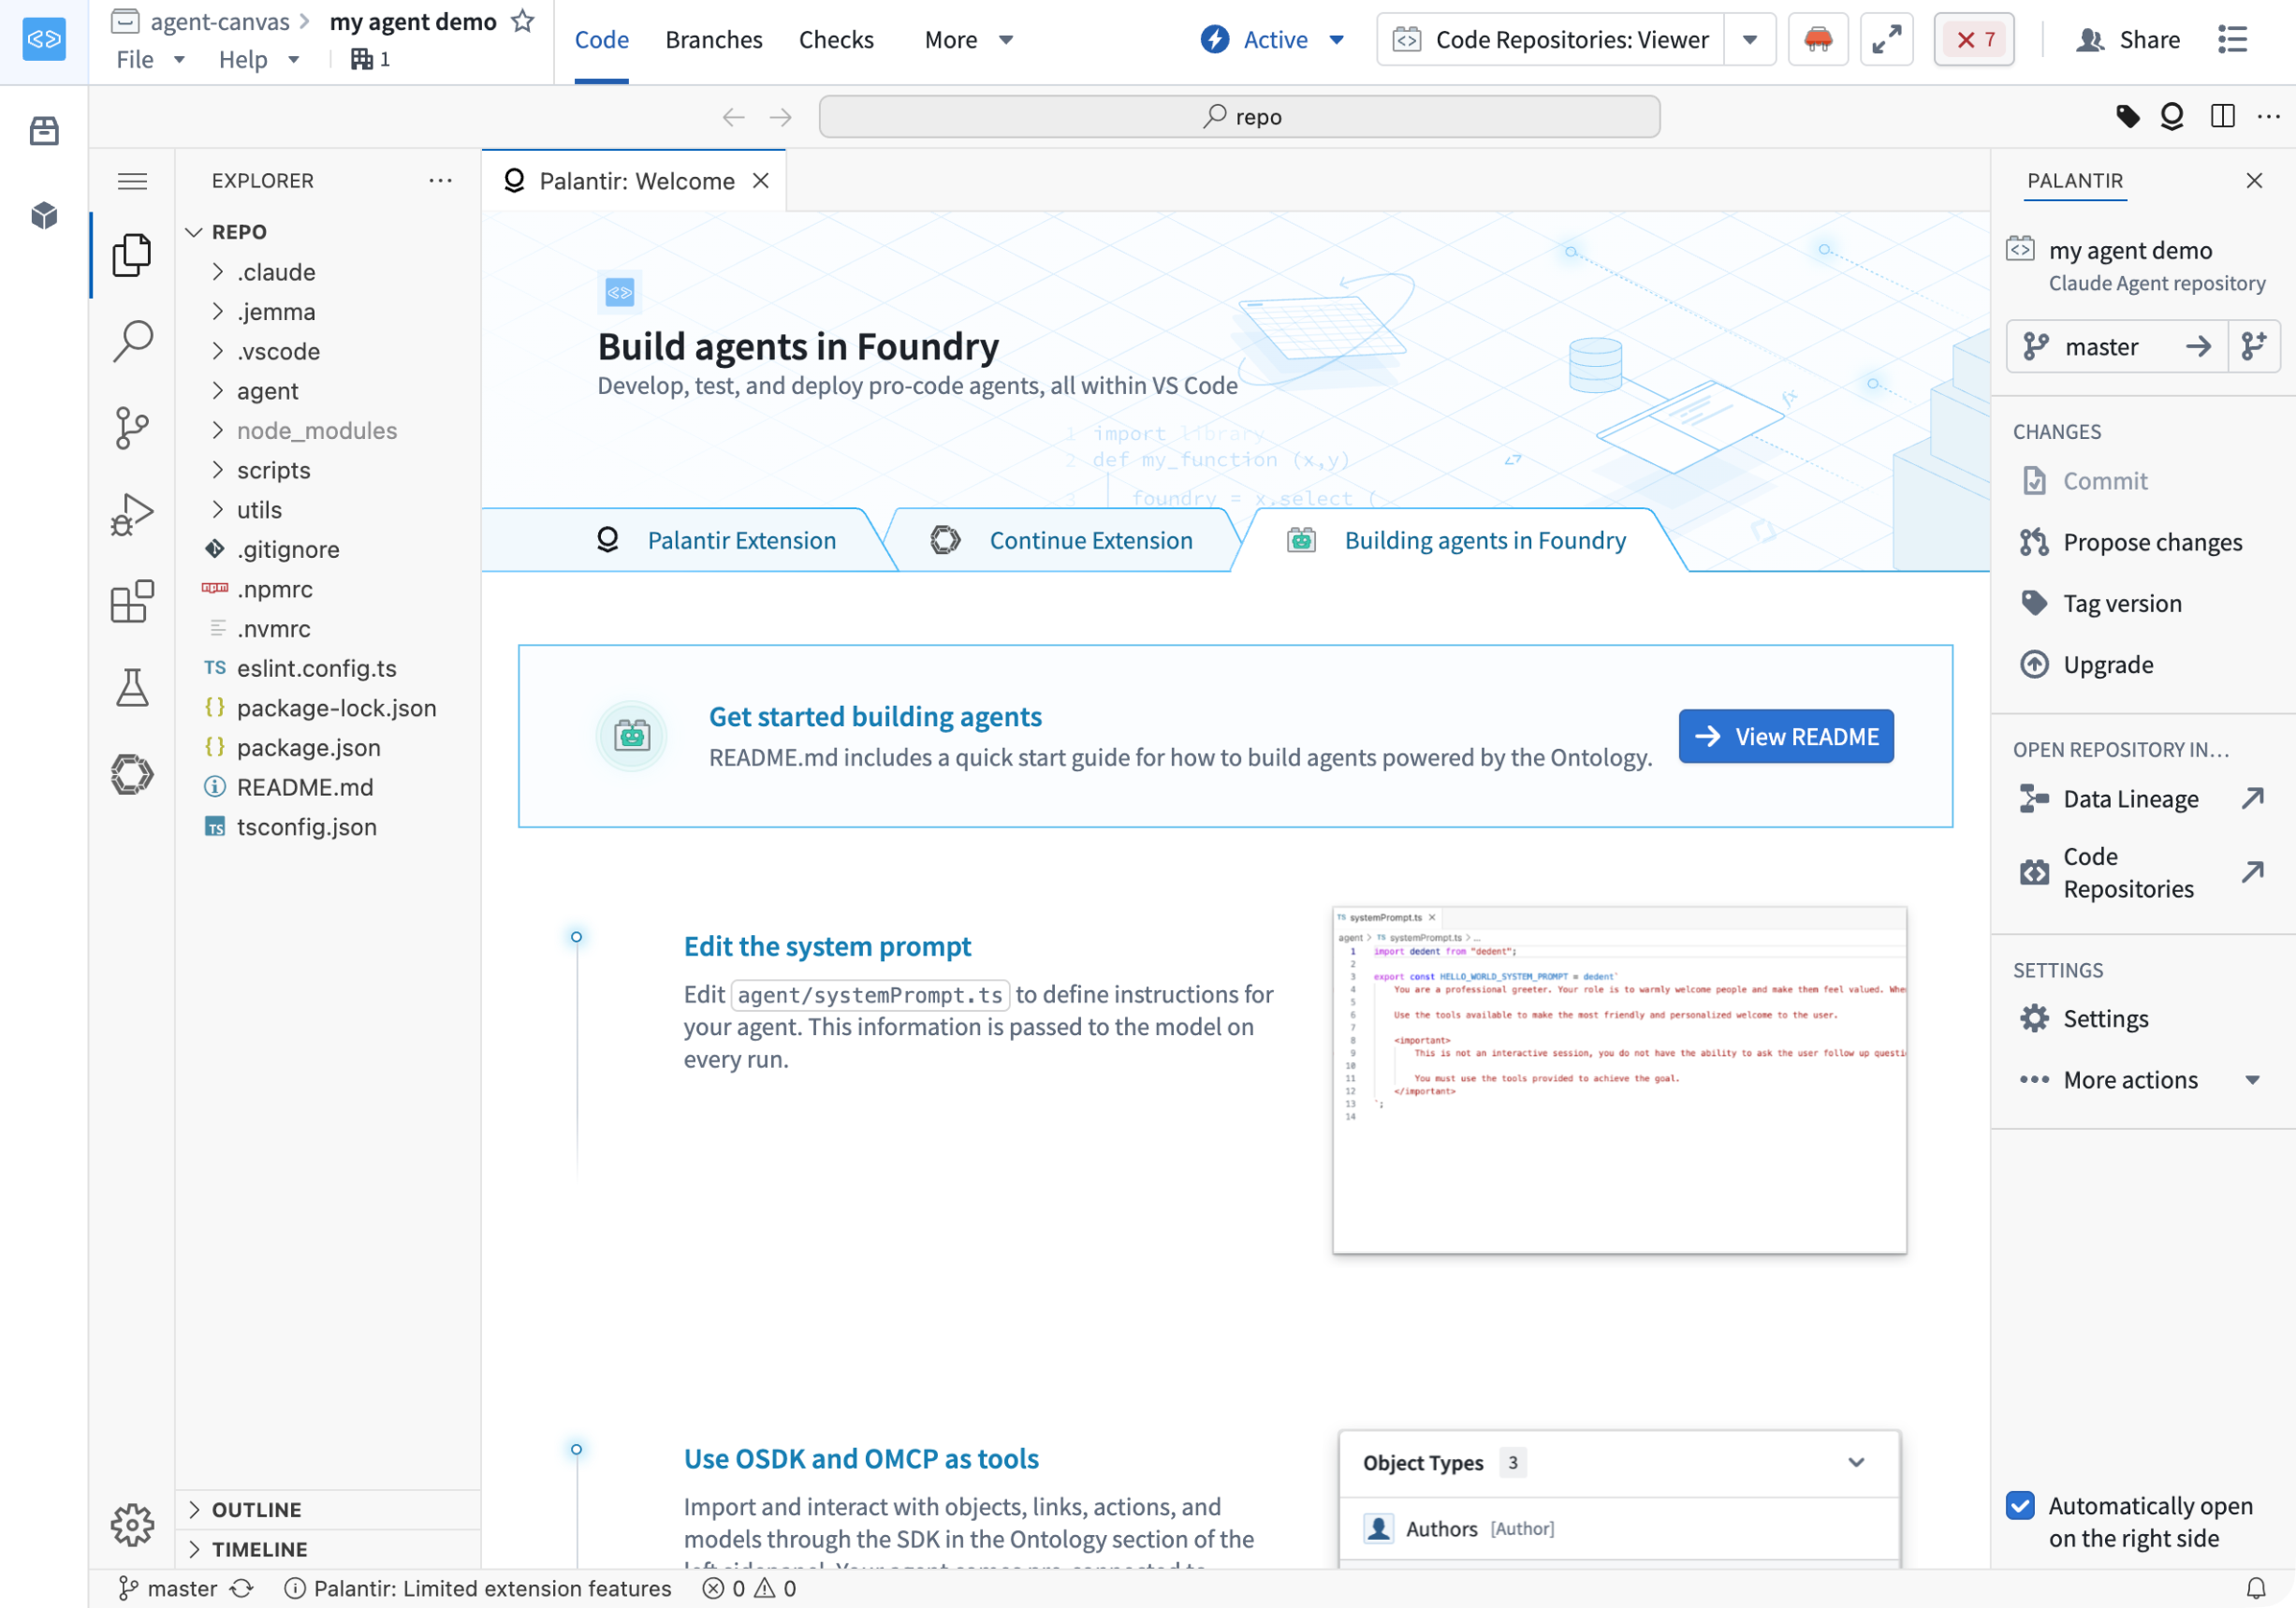
An agent template repository with a landing page to guide you through building your agent.
What's new
Scoped permissions out of the box
Agents authenticate against OSDK, OMCP, and Palantir MCP with scoped permissions automatically. You no longer wire up client credentials manually, or provide a client ID, secret, or Foundry token, to use tools.
Templates for Claude Agent SDK, OpenAI Agents SDK, and Google ADK
Create your agent from an agent template for the Claude Agent SDK, OpenAI Agents SDK, or Google Agent Development Kit (ADK). Each template ships with simplified configuration for Ontology MCP, Palantir MCP, and the Ontology SDK client, with common setup moved into the library. After creating your agent, a guided walkthrough leads you through the next steps.
Ontology binding and agent API names
Every agent is published with an Ontology binding and an agent API name, making its function callable from both Workshop and Ontology SDK with no additional configuration.
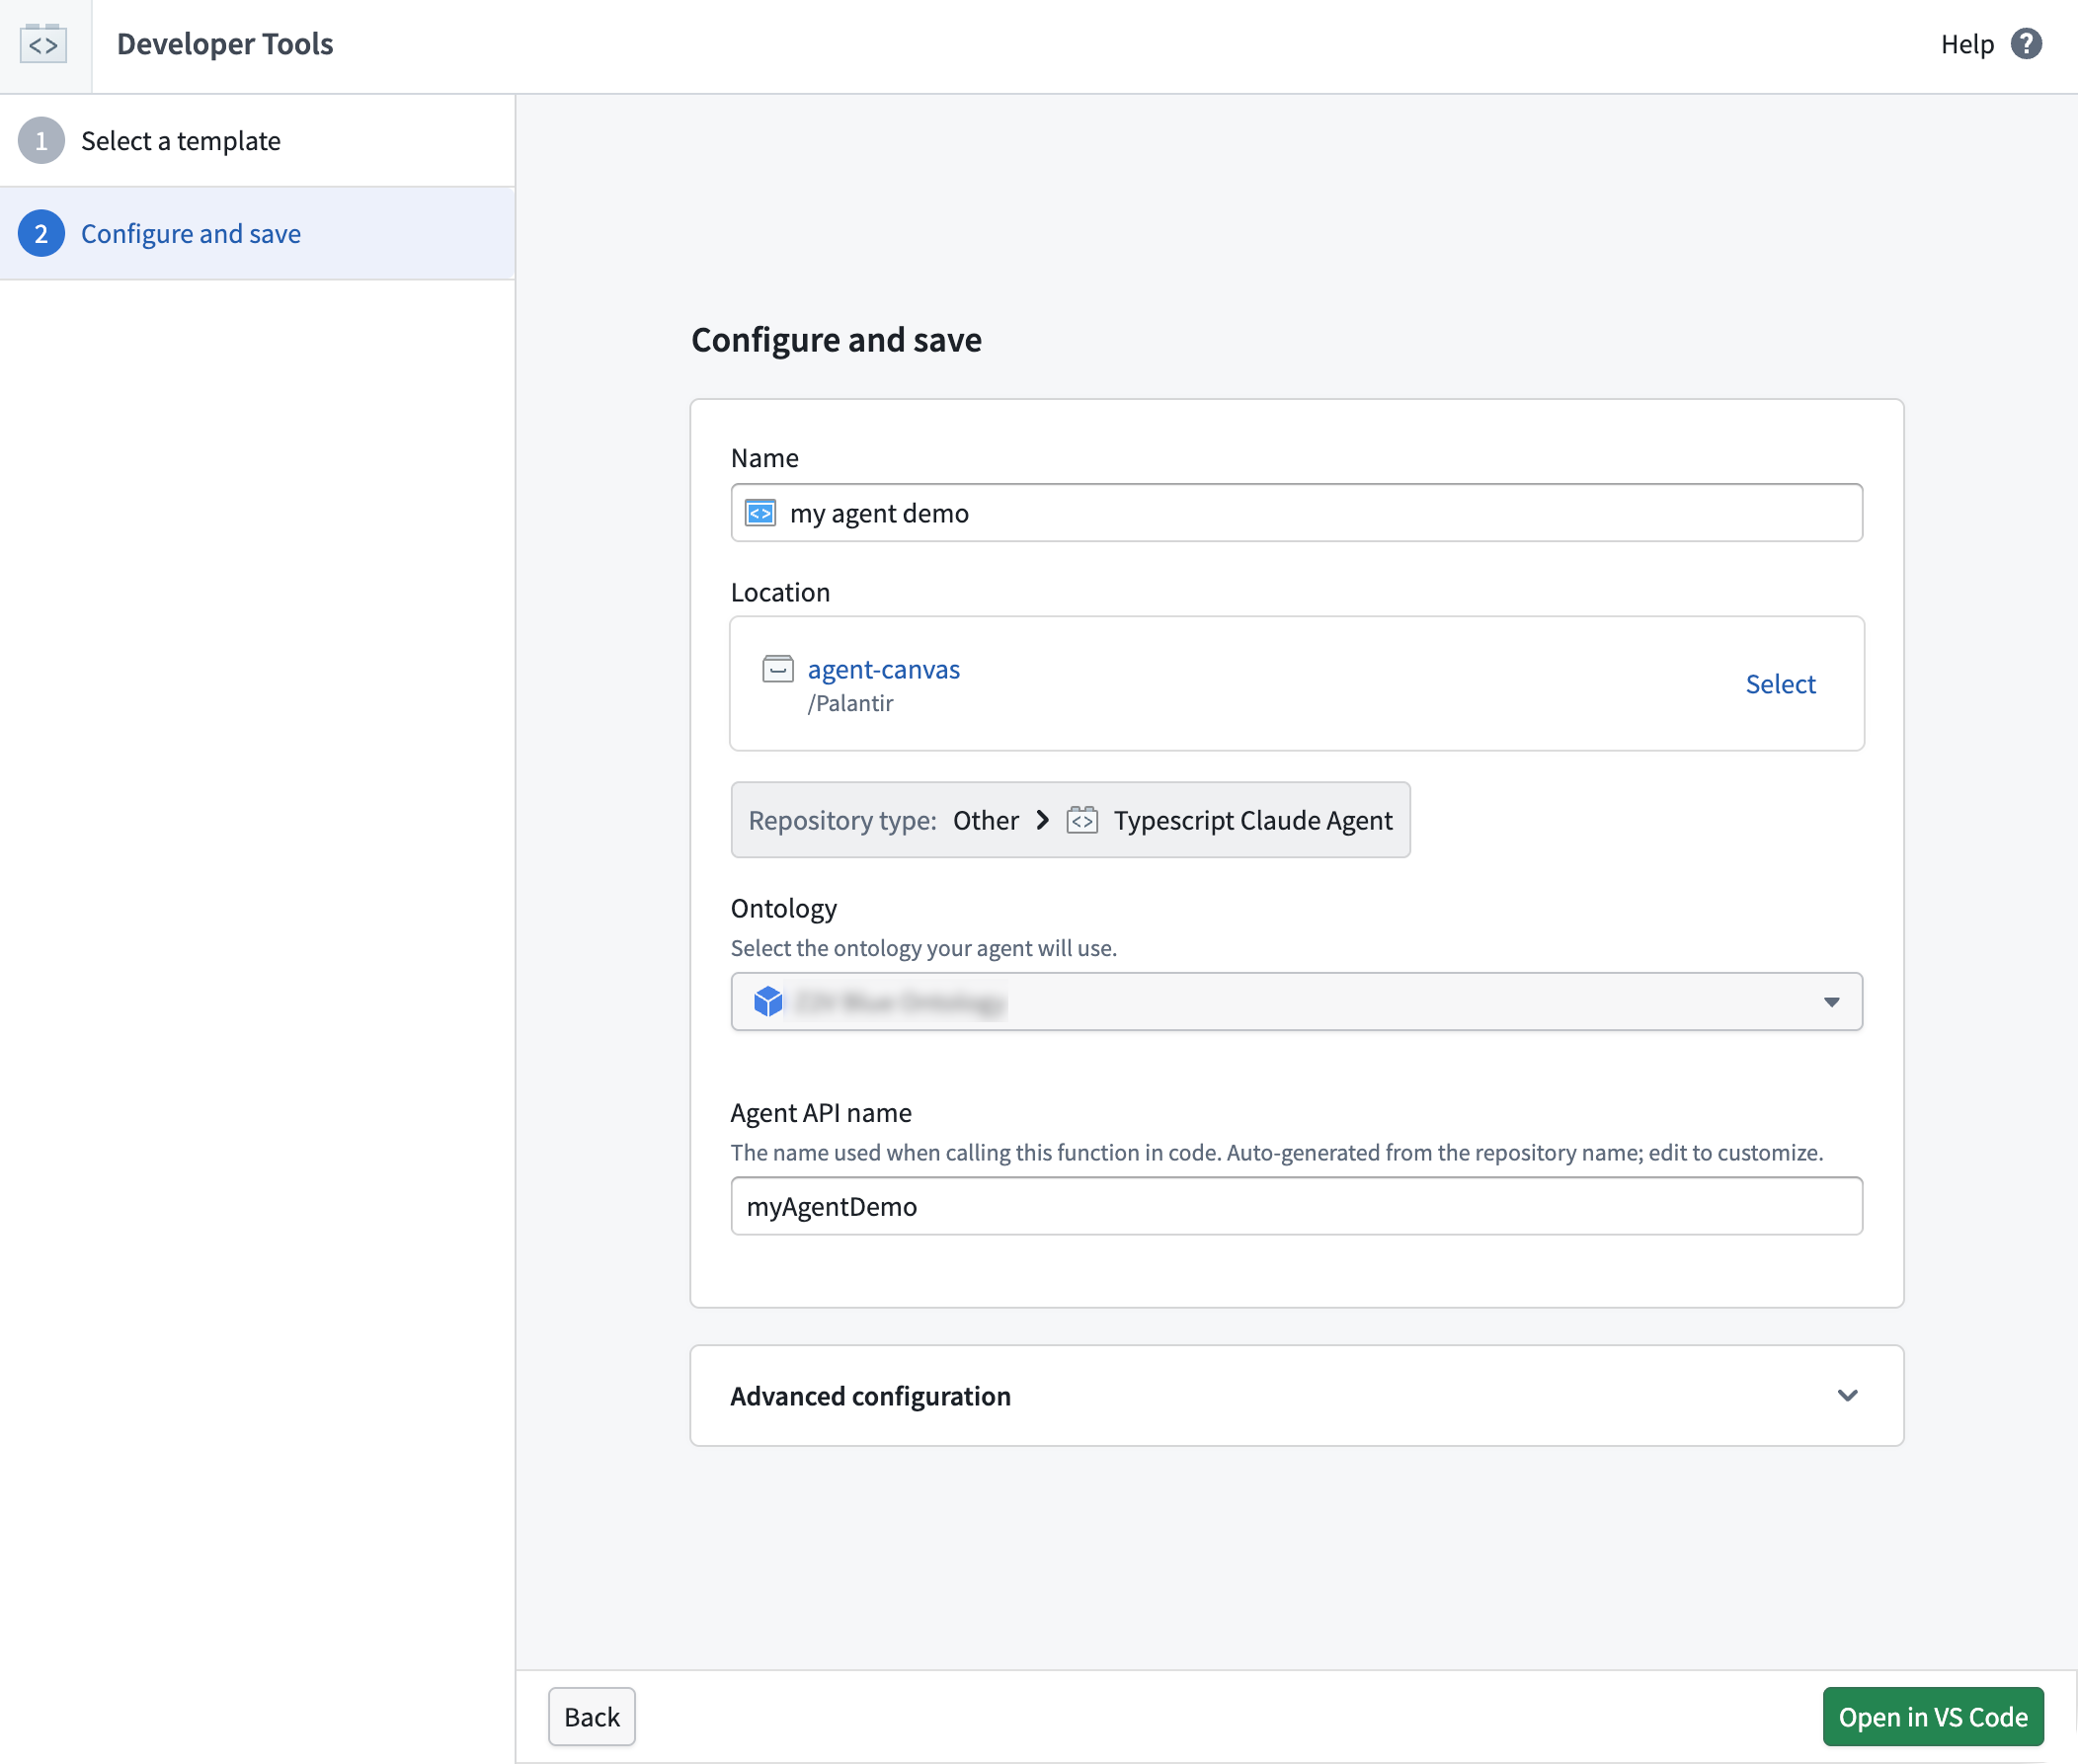
The agent configuration page, where you can bind your agent to an Ontology and assign it an API name.
Build an agent with Continue
Use Palantir MCP with Continue to manage both the SDK and MCP scope attached to the agent, directly from your editor.
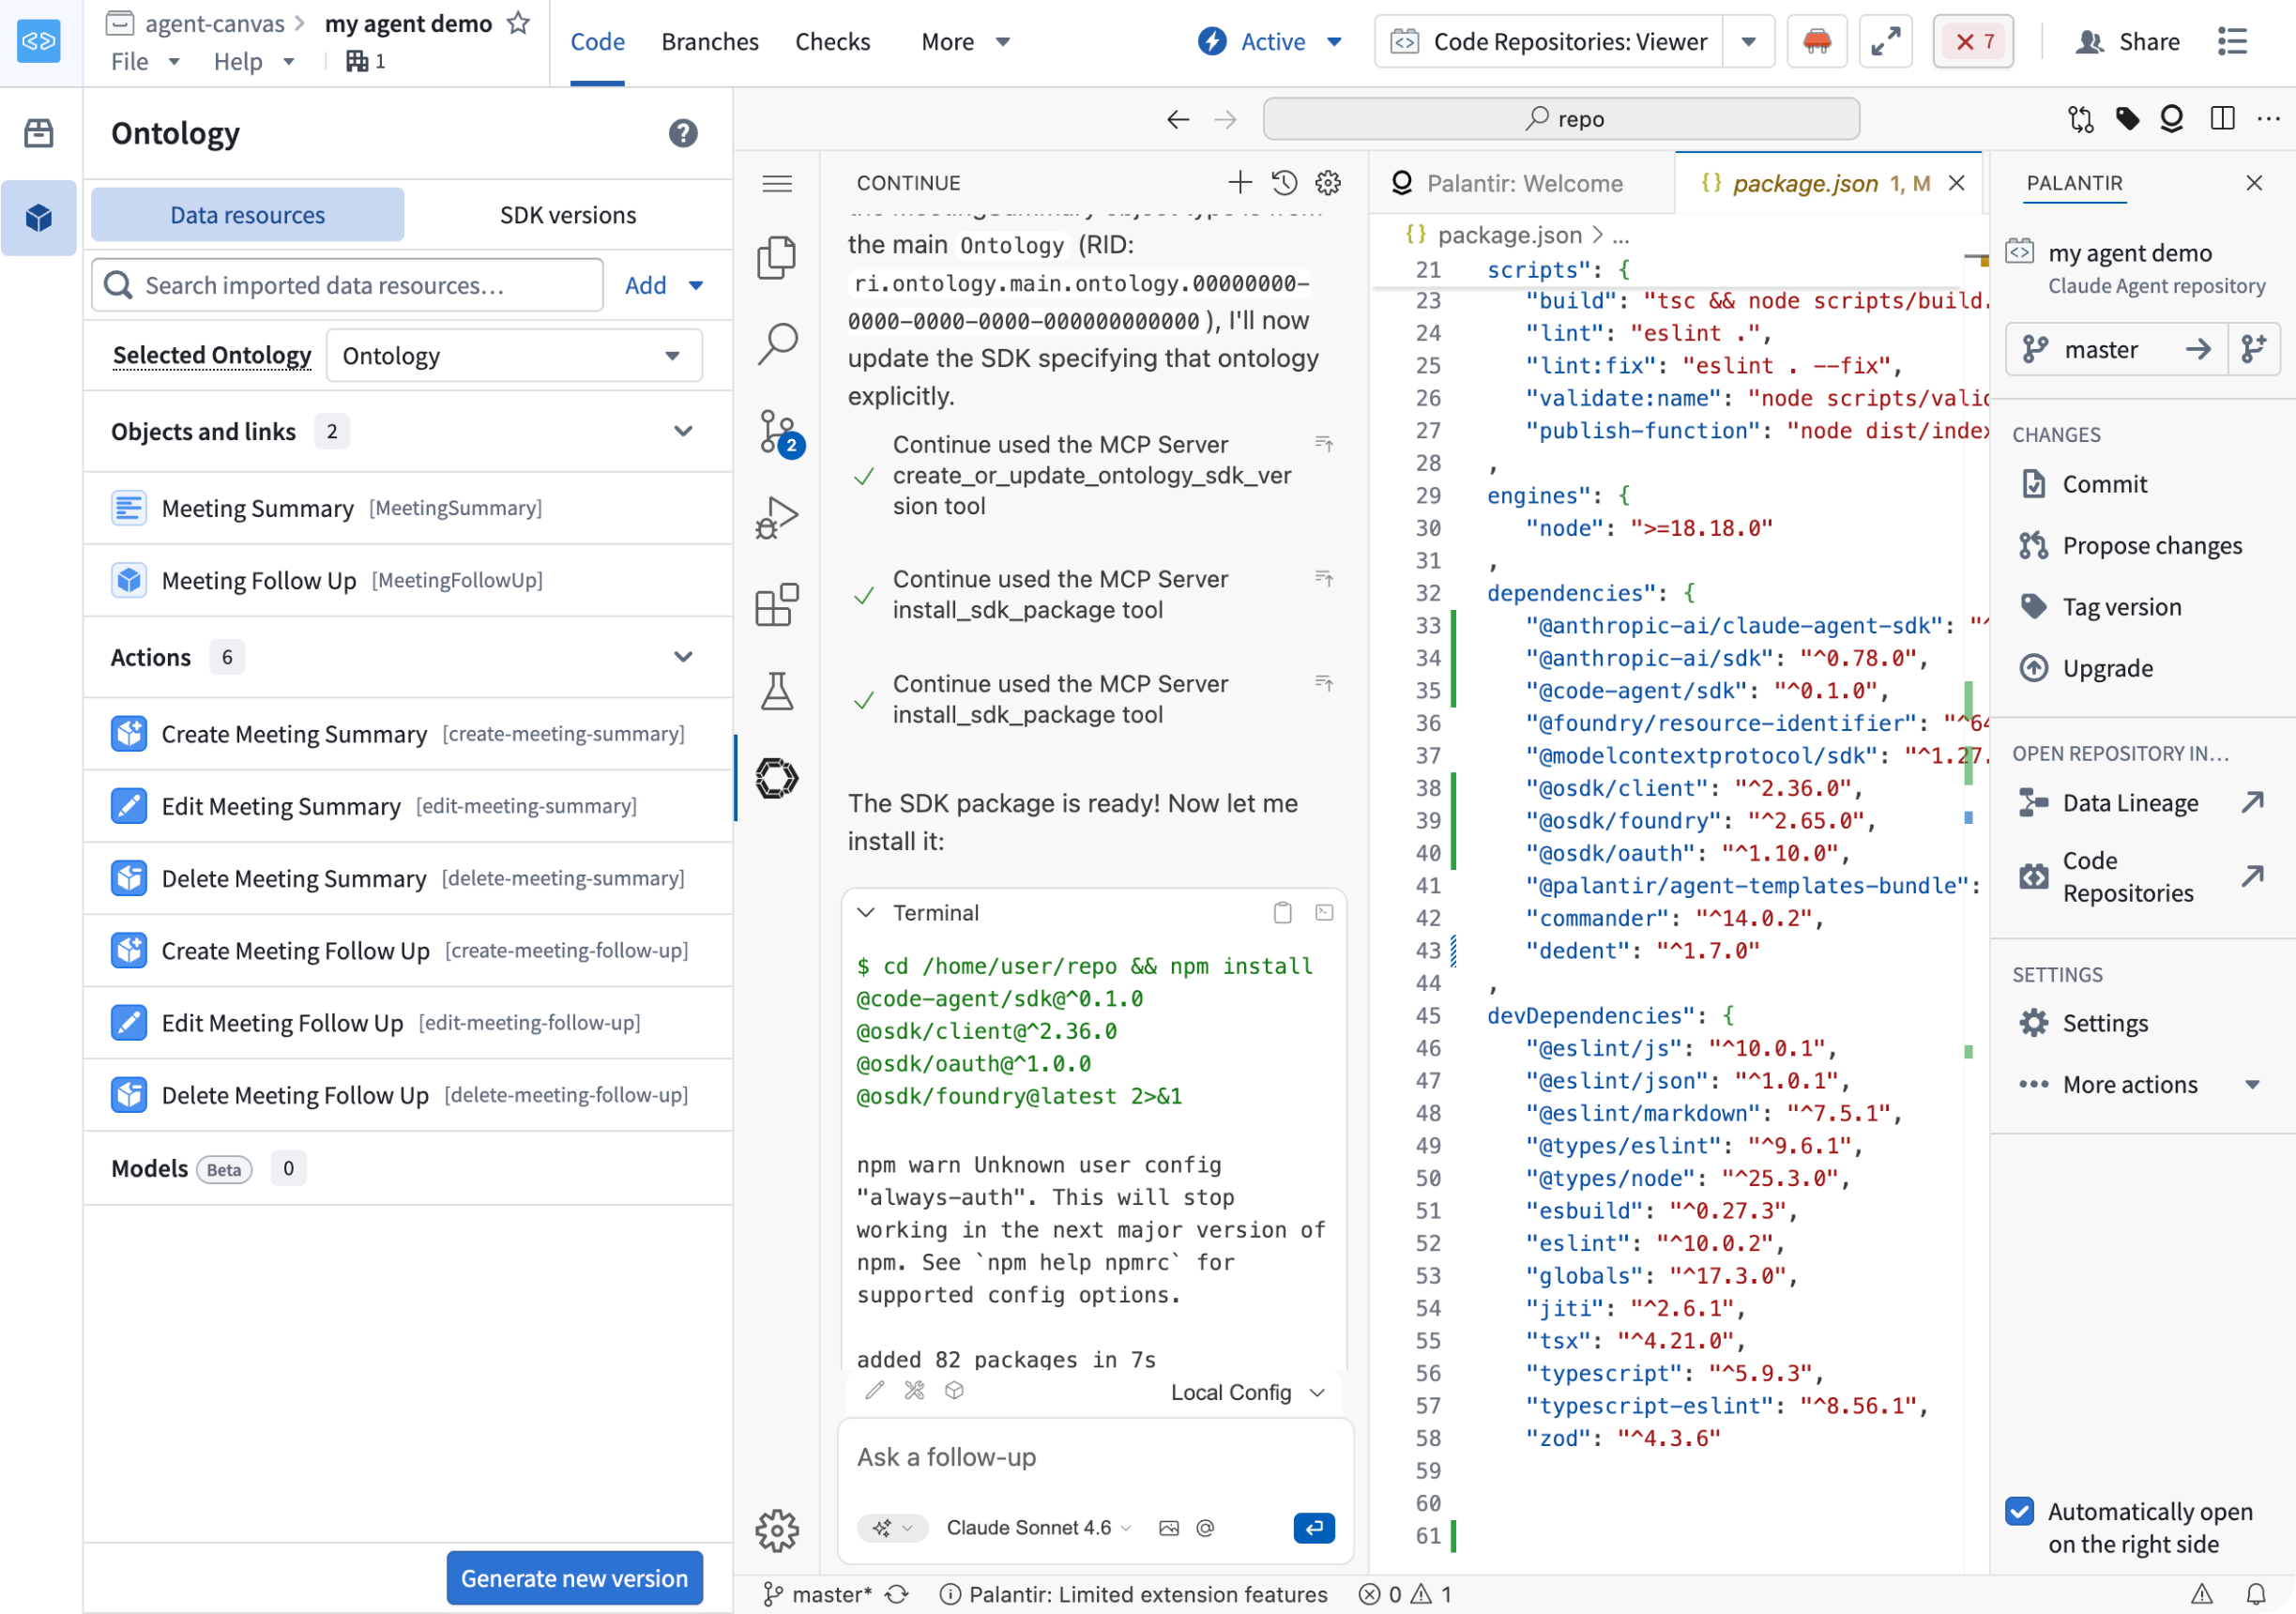
The Continue extension in the agent template repository, allowing you to build agents with natural-language prompts.
Tell us what you think
We welcome your feedback on building agents in the platform. Share your thoughts with Palantir Support channels or our Developer Community ↗.
Automate now supports Global Branching
Date published: 2026-07-09
Automate now supports Global Branching. You can modify automations on a branch and test them end-to-end before merging your changes into the main branch. Branching lets you iterate on automation logic without disrupting live workflows or the people who depend on them. Automate supports the full set of branching features:
- Modifications: Add, modify, remove, and merge changes on branches.
- Environment isolation: Changes and executions of your automations run in the context of the branch.
- Protection: Restrict edits to an automation’s main branch and require users to make all modifications through branches.
- Rebasing: If an automation has changed on main since you originally branched, you can resolve differences by rebasing to unblock merging.
- Approvals: After you propose changes, you can configure reviewers. The automation inherits approval policies from the project automatically. Reviewers view changes in the Automate application before they approve or reject them.
To get started, open any automation and add it to a branch.
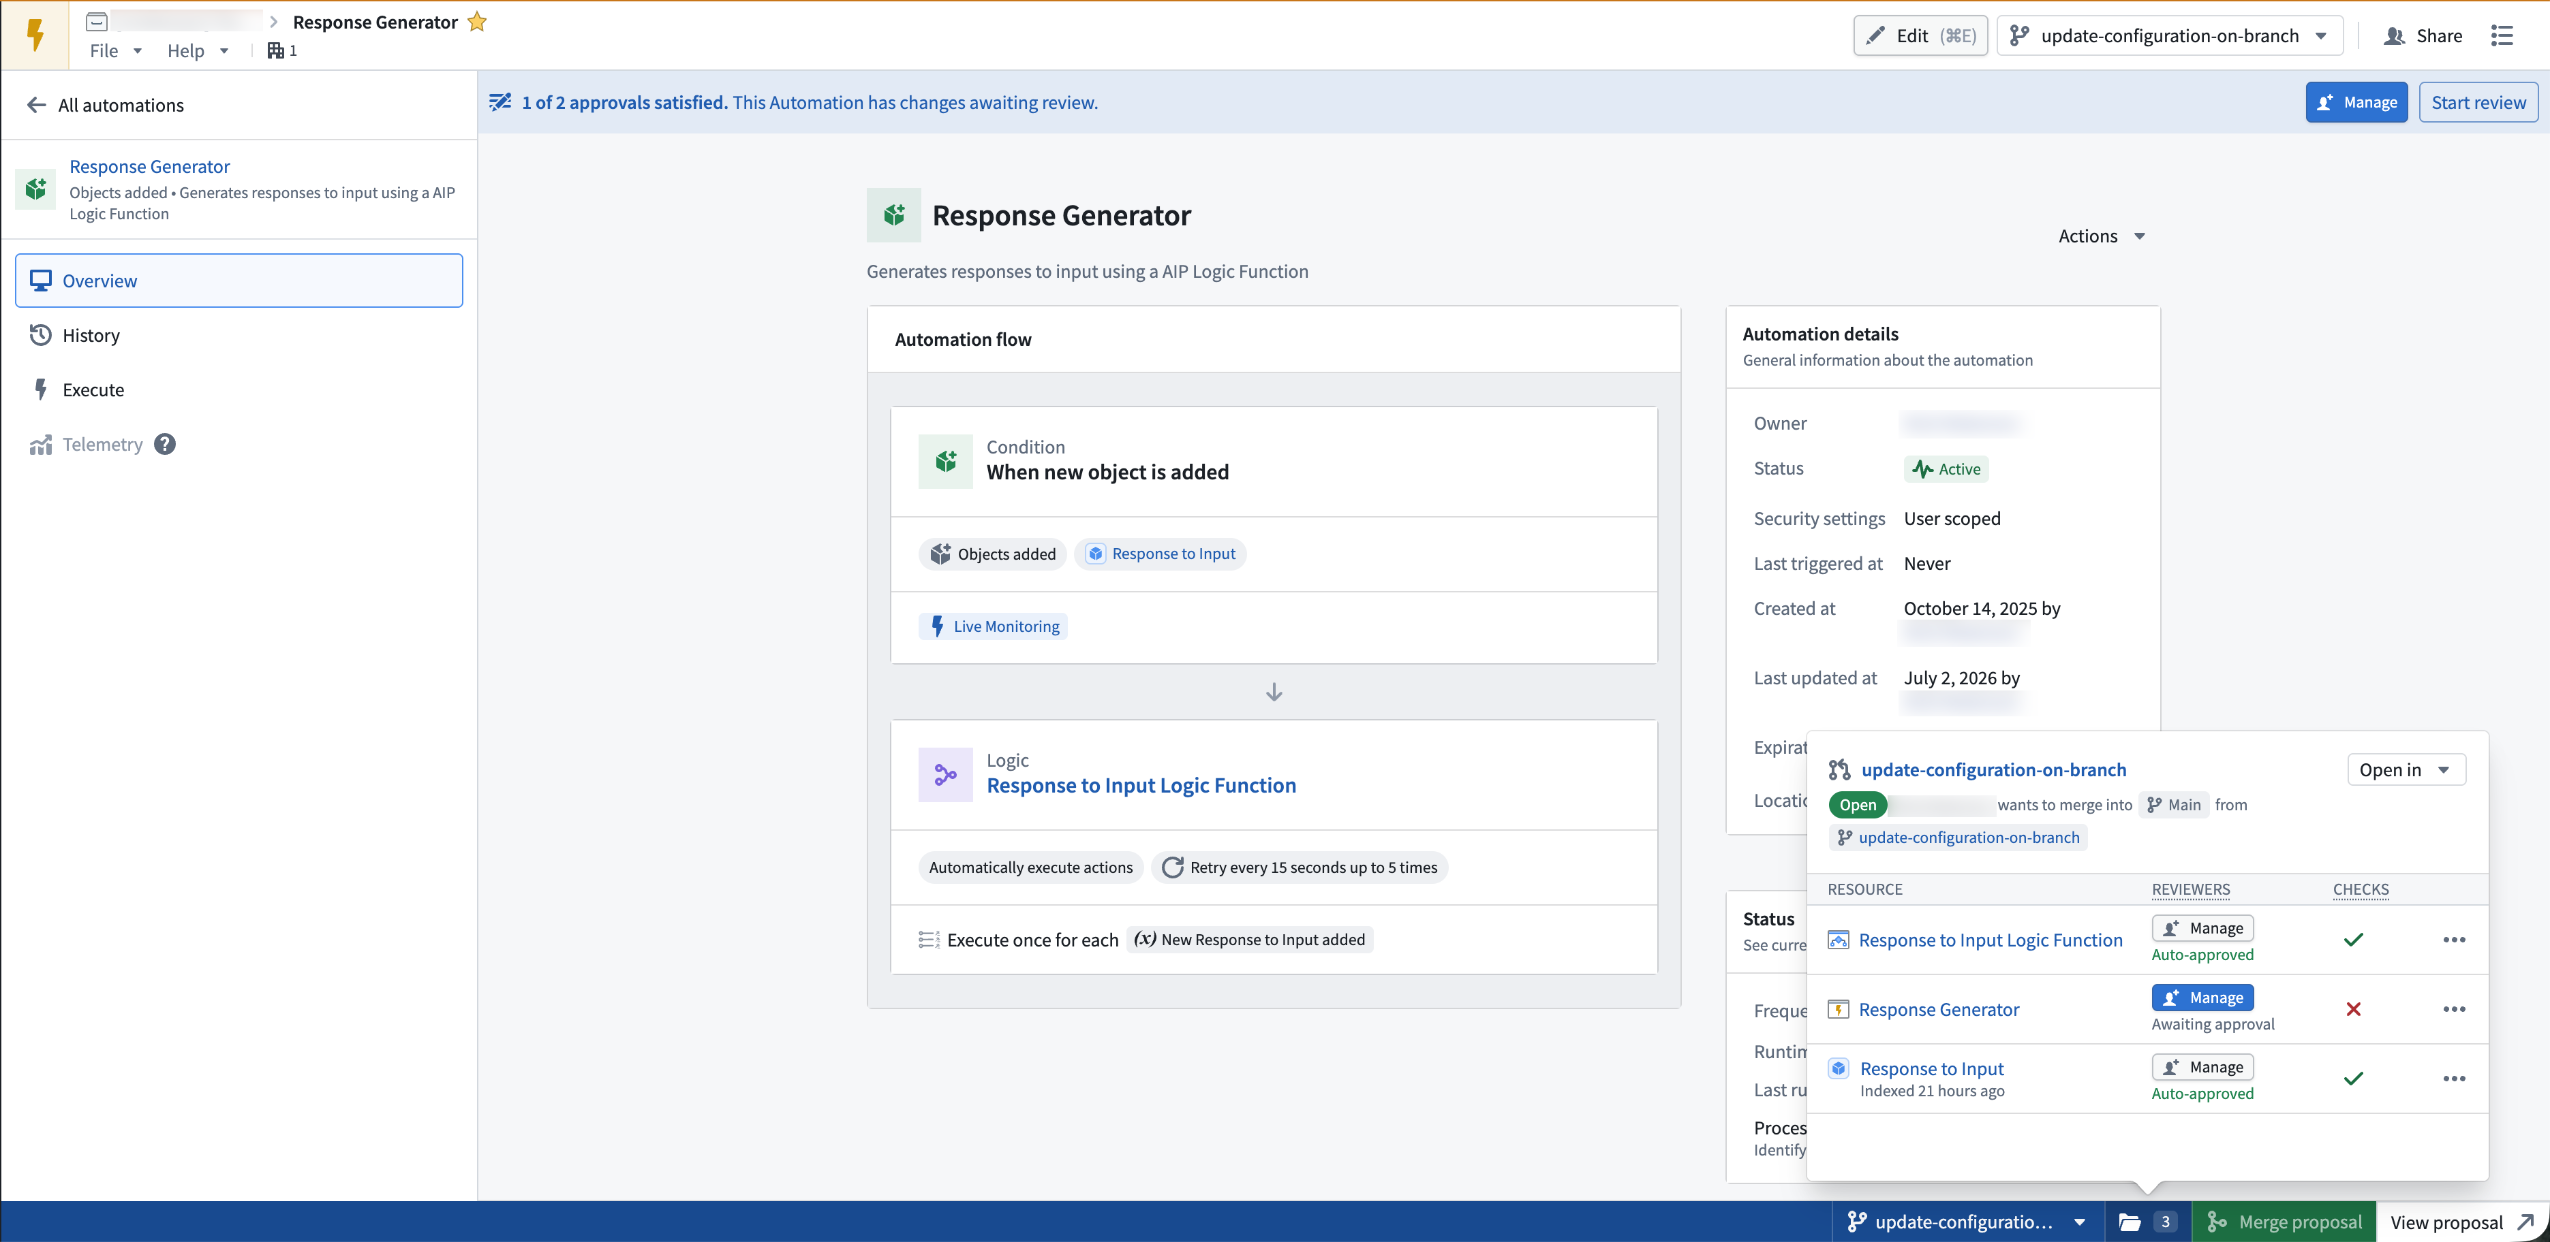
An automation open on a global branch, with the branch taskbar showing reviewer configuration and proposal checks.
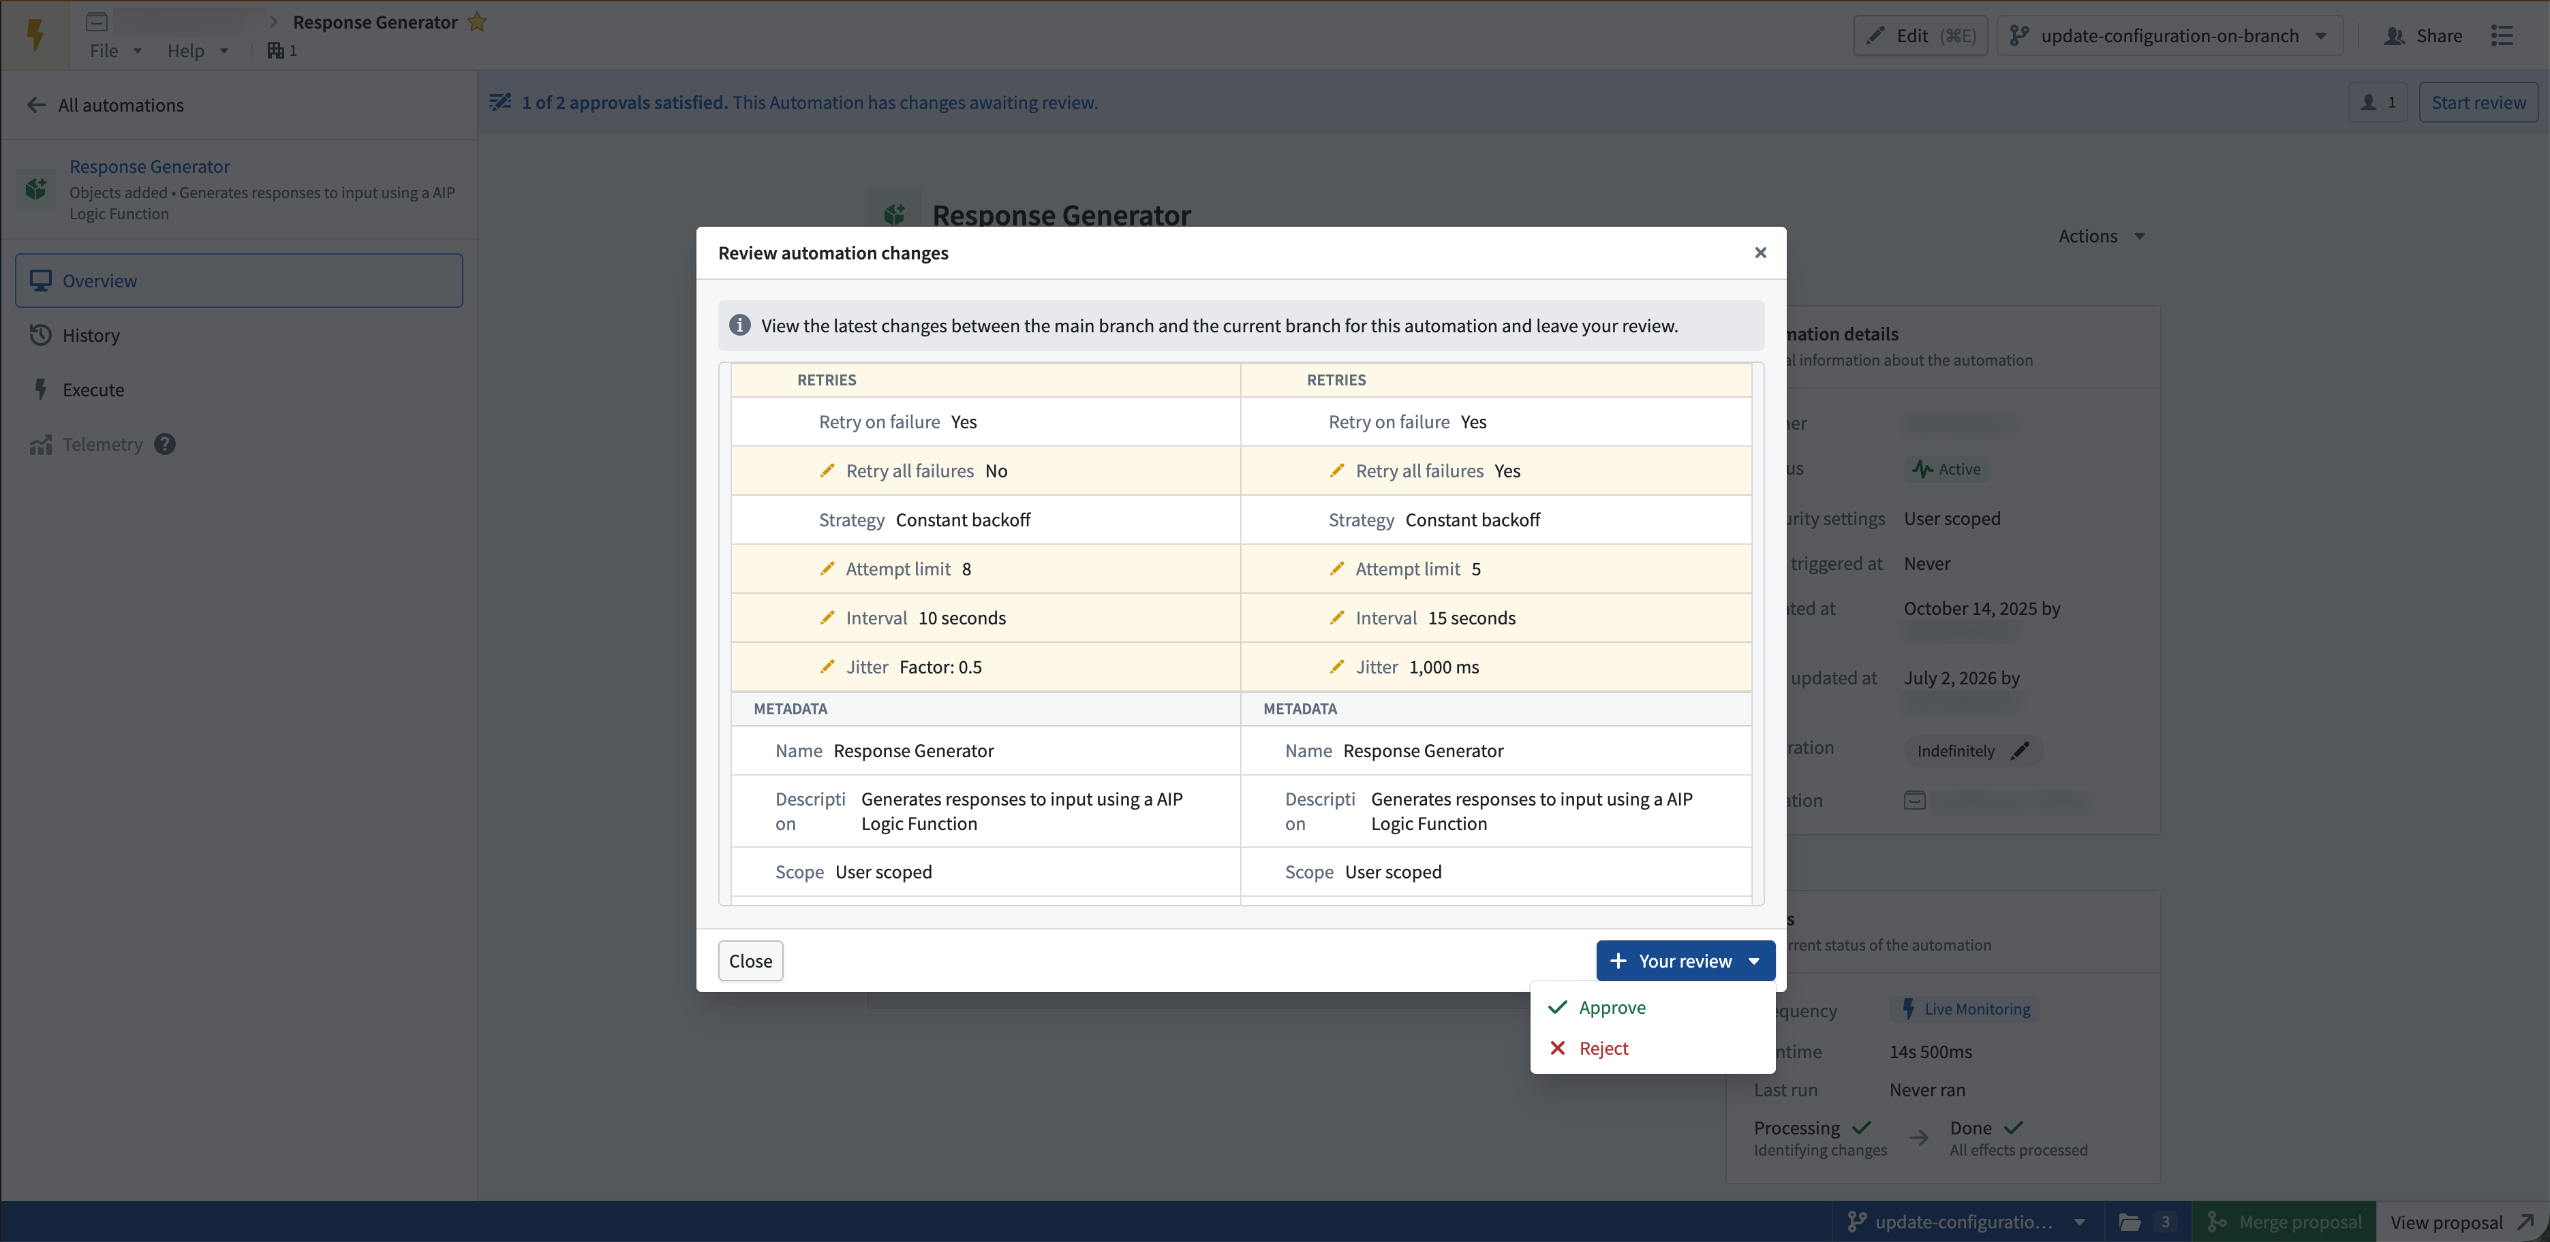
Reviewing proposed automation changes in a side-by-side diff before approving or rejecting.
To learn more, see Automate branching.
Your feedback matters
We want to understand how branching for Automate improves your workflow and where we should focus our improvement efforts. Share your thoughts through Palantir Support channels and our Developer Community ↗ using the automate tag ↗ and the global-branching tag ↗.
Claude Sonnet 5 now available in AIP
Date published: 2026-07-07
Claude Sonnet 5 is now available in AIP for eligible commercial and US government enrollments.
Model overview
As Anthropic’s most agentic Sonnet model yet, Sonnet 5 narrows the gap with Claude Opus 4.8 on reasoning, tool use, coding, and knowledge work, while remaining available at a lower price point. It provides a strong balance of intelligence, speed, and cost for production AIP use cases. For more information, review:
Availability
Claude Sonnet 5 is available for commercial enrollments that enable Anthropic through:
- Microsoft Azure on non-georestricted enrollments
- Amazon Bedrock on non-georestricted or US georestricted enrollments
- Anthropic Direct on non-georestricted or US georestricted enrollments
- Google Vertex on non-georestricted, US georestricted, or EU georestricted enrollments
Additionally, Claude Sonnet 5 is available for US government enrollments that enable Anthropic through Google Vertex on IL2 or IL4 enrollments.
Getting started
To use this model:
- Confirm that your enrollment administrator has enabled the relevant model family.
- Review token costs and pricing.
- See the complete list of models available in AIP.
Your feedback matters
We want to hear about your experiences using language models in the Palantir platform and welcome your feedback. Share your thoughts with Palantir Support channels or on our Developer Community ↗ using the language-model-service tag ↗.
Introducing Model Evaluations: Compare and evaluate models outside of Modeling Objectives
Date published: 2026-07-07
Model evaluations is a new Python API for capturing how a model version performs against test data and visualizing the results directly on the model page. An evaluation is a collection of metrics, images, plots, and tables that you define and log yourself, allowing you to compare model performance across versions and over time.
Previously, evaluating a model in a structured way meant working inside a modeling objective. Model evaluations remove that requirement: you can now author evaluation logic anywhere you build models and attach the results to any model version, no modeling objective required.
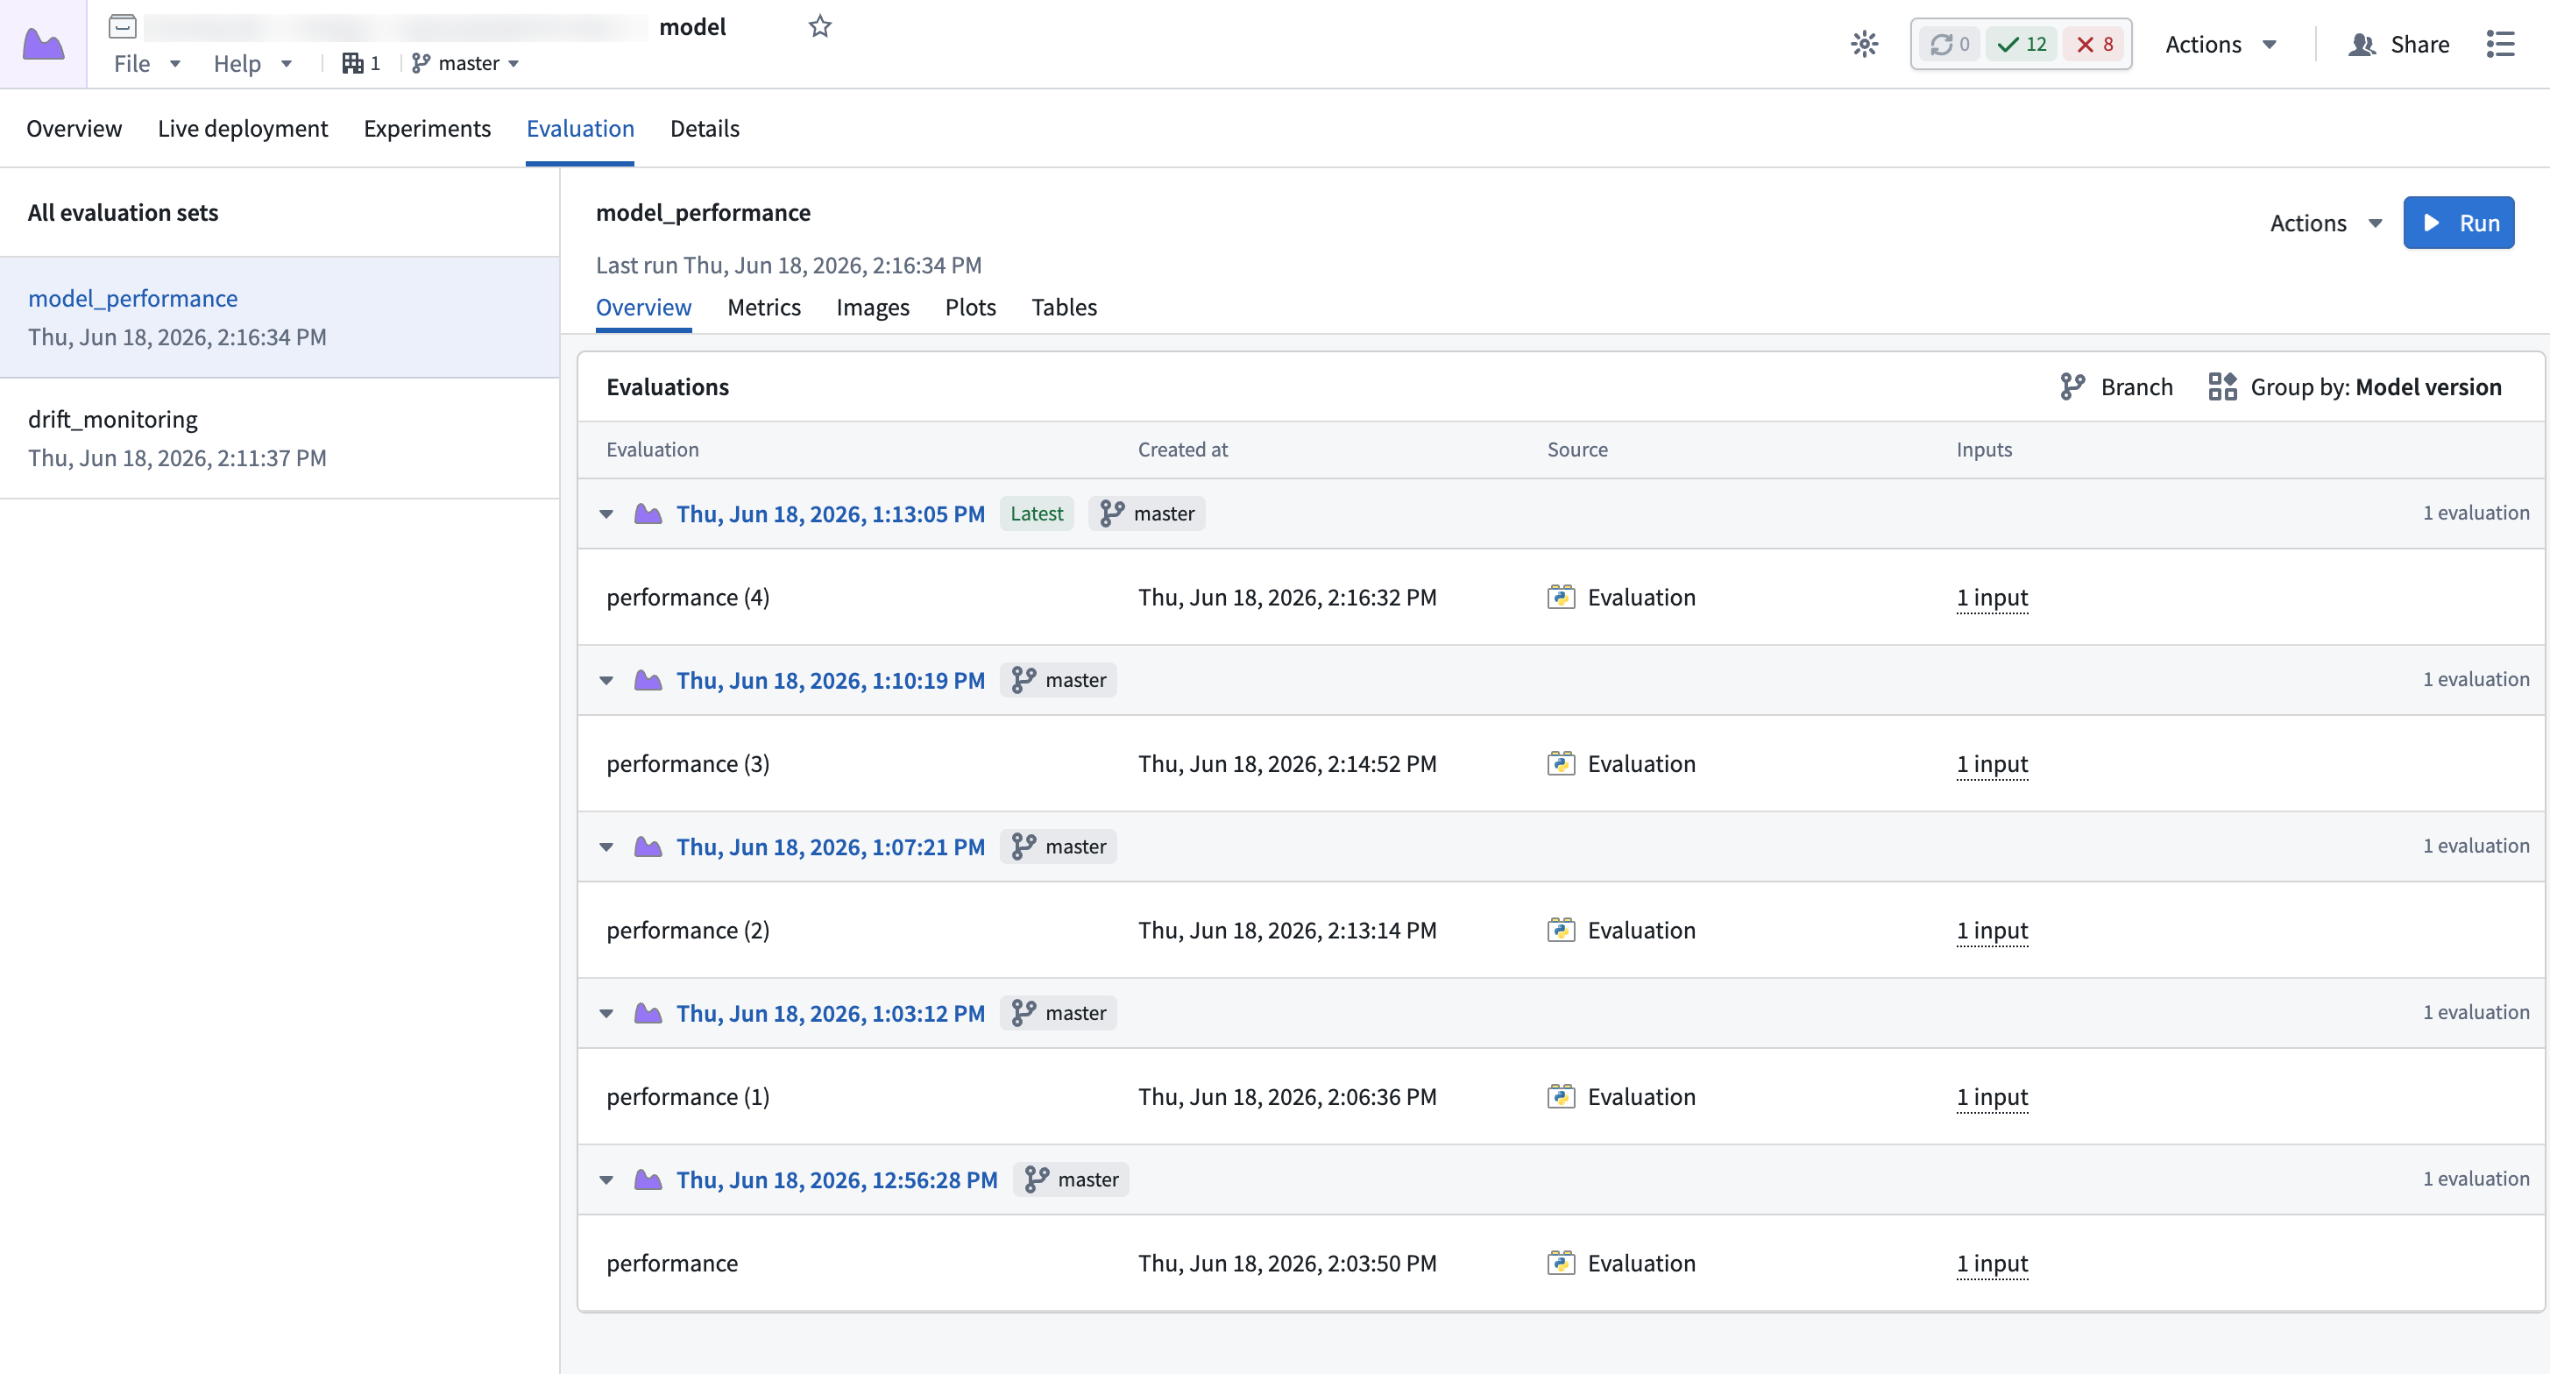
The Evaluation tab on a model page. The model_performance evaluation set shows results logged for each model version, grouped by version so you can compare performance across runs.
Evaluate any model version
Every evaluation is tied to a single model version - the version loaded into your transform using ModelInput. As the results are attached to that specific version, you point-in-time snapshot of how the model performed, and a foundation for comparing quality as the model is retrained.
Track performance across versions with evaluation sets
Evaluation sets are a logical grouping of evaluations that share the same methodology. Each run of an evaluation transform writes a new evaluation to the same set, so you can track how a metric evolves over version as your model changes. To analyze a model in more than one way - for example, aggregate error in one set and per-segment error in another - define a separate set for each methodology.
Getting started
To get started with model evaluations, just upgrade your repository to latest, upgrade the palantir_models library to >= 0.2384.0, and then explore the documentation to get started with model evaluations.
What's next?
Over the next few months, we will introduce the following improvements to evaluations:
- AI FDE support for the AI-assisted model development loop
- Monitors that send alerts based on evaluation performance for automated drift detection
- UI/UX enhancements for comparing evaluations
Explore the documentation to get started with model evaluations.
Let us know what you think
Send feedback through Palantir Support or the Developer Community ↗ using the modeling tag ↗.
Save AIP Analyst chats as analysis resources
Date published: 2026-07-02
AIP Analyst chats can now be saved as analysis resources in Compass, allowing you to return to prior analyses, share them with collaborators, and continue iterating over time in both standalone AIP Analyst and the Workshop widget. When you reopen an analysis, AIP Analyst re-runs the agent's tools and regenerates responses against the latest state of your Ontology, so the results always reflect the current state and respect each viewer's permissions.
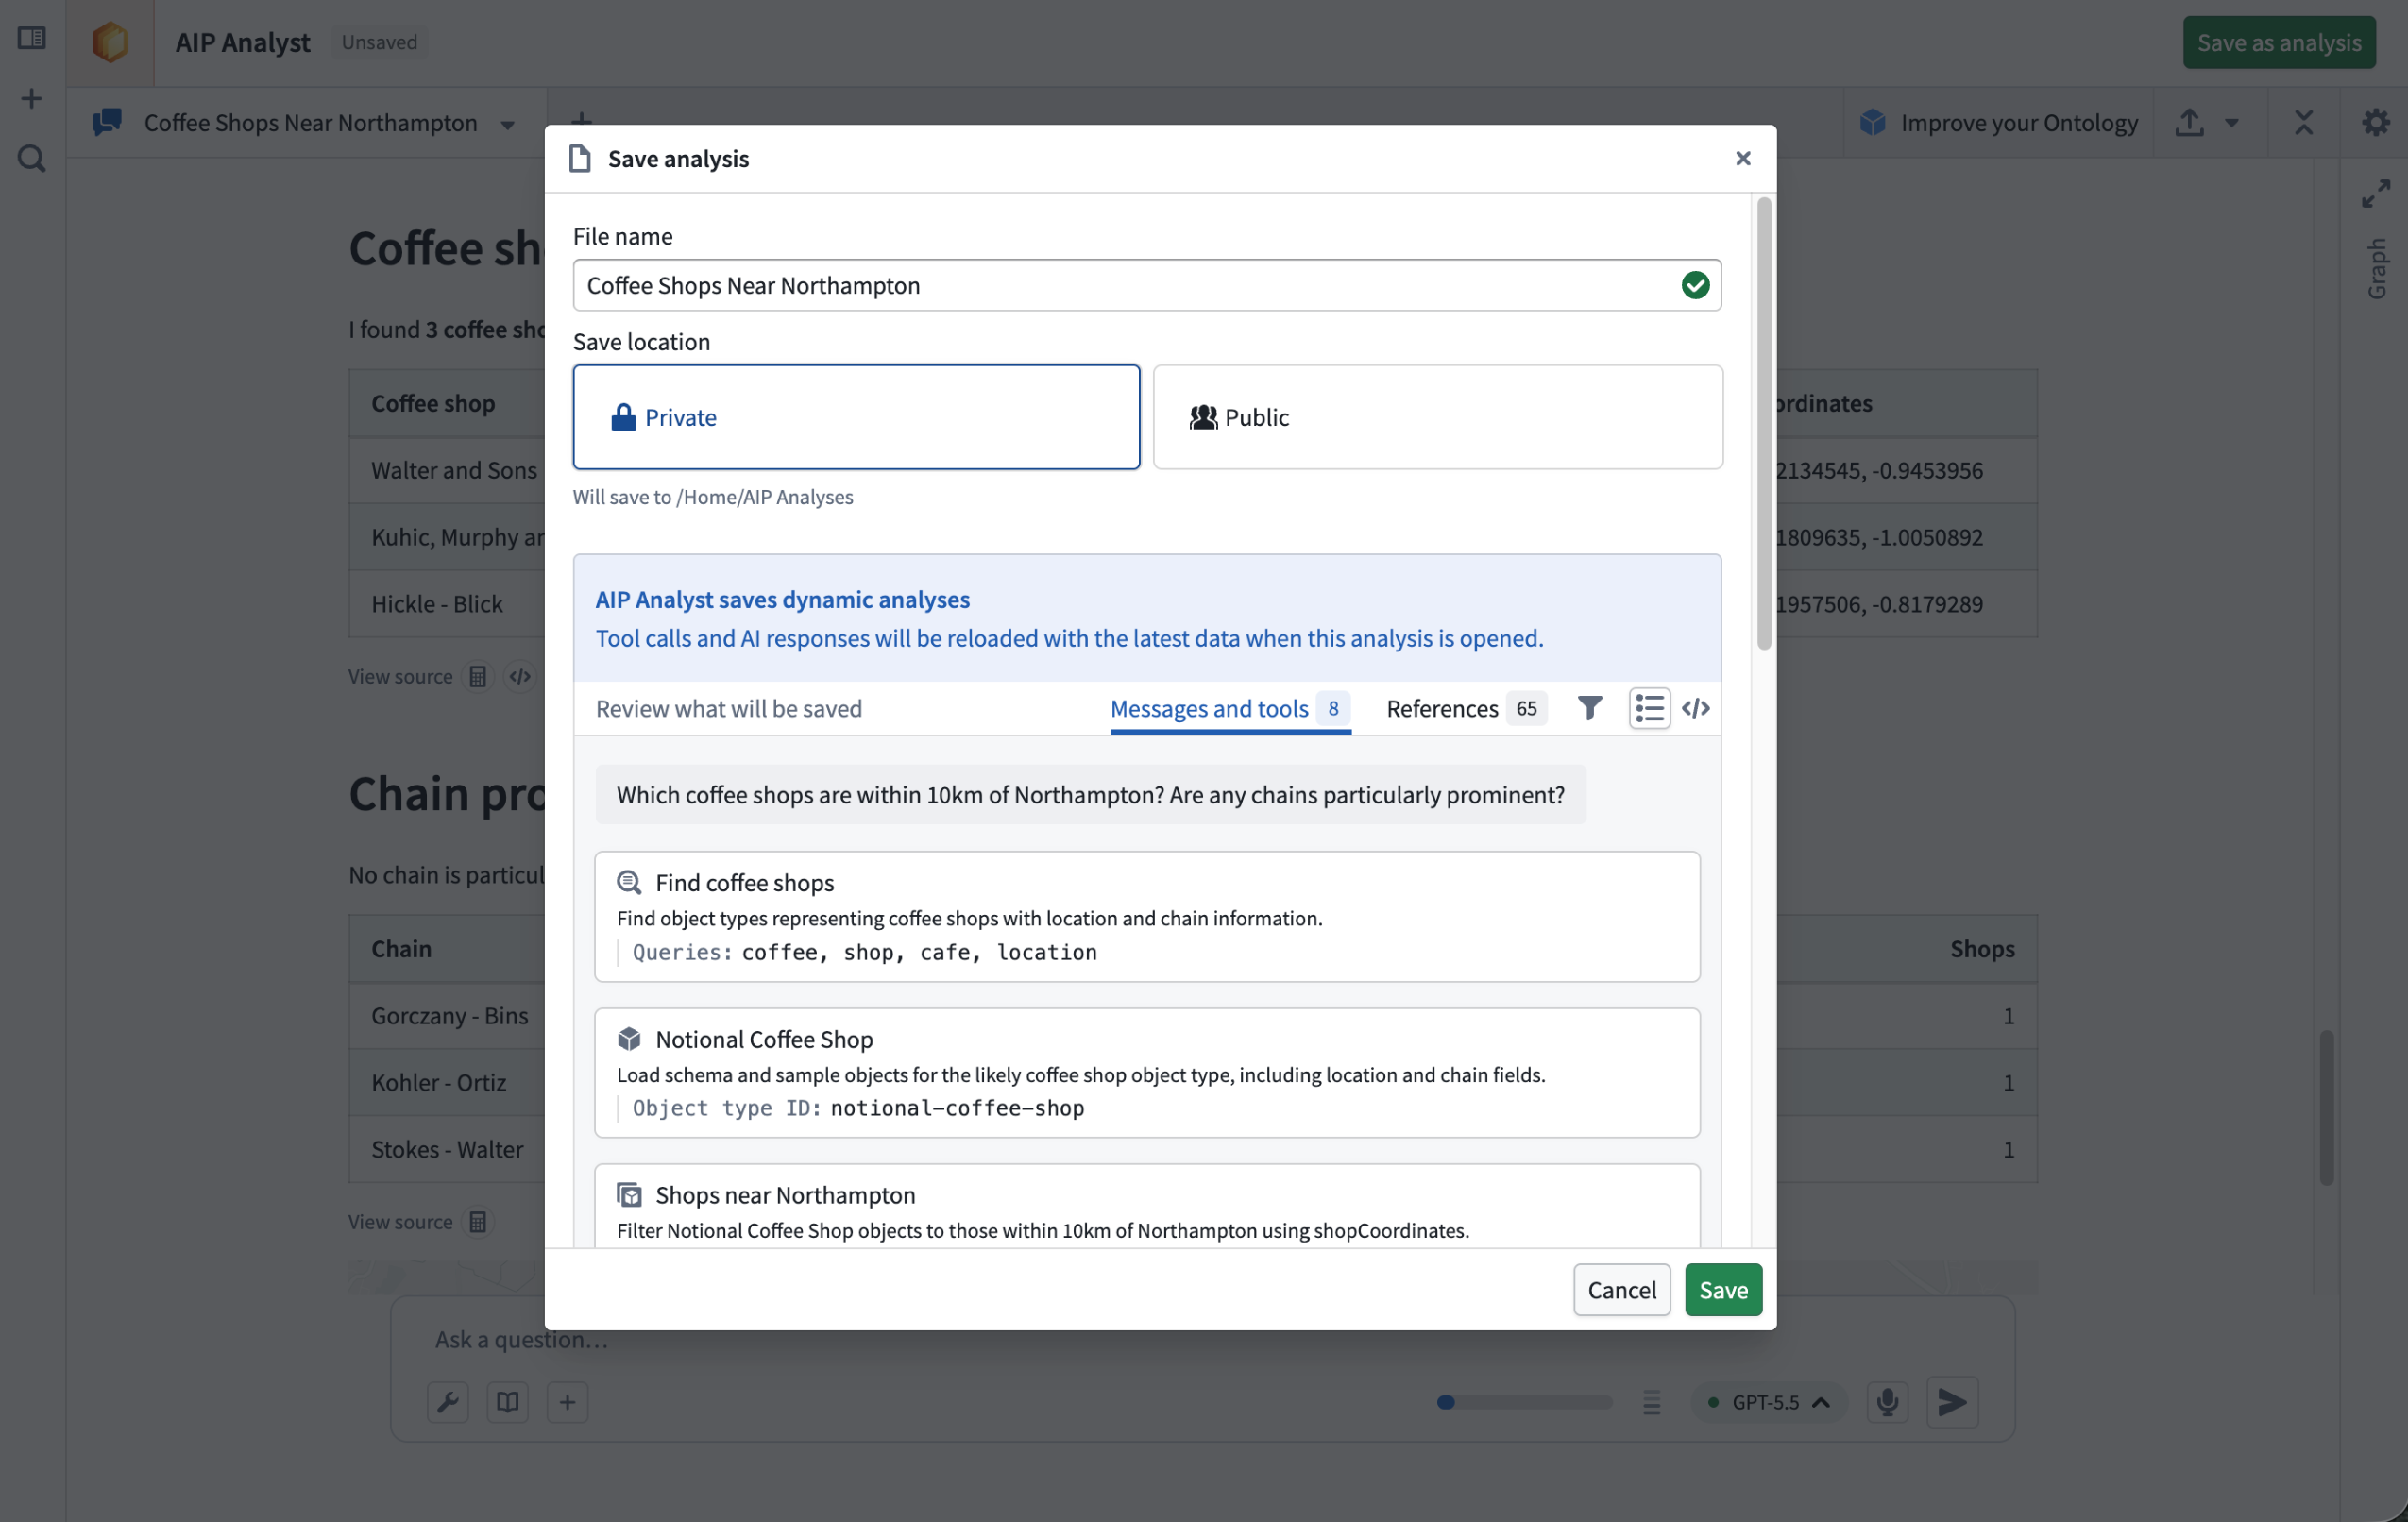
Choose where to save the analysis and review what will be stored.
Learn more in the AIP Analyst analysis resources documentation.
Admin controls
Platform administrators can disable analysis saving through the AIP Analyst Control Panel extension at the enrollment level. When disabled, users cannot create or open analysis resources from AIP Analyst.
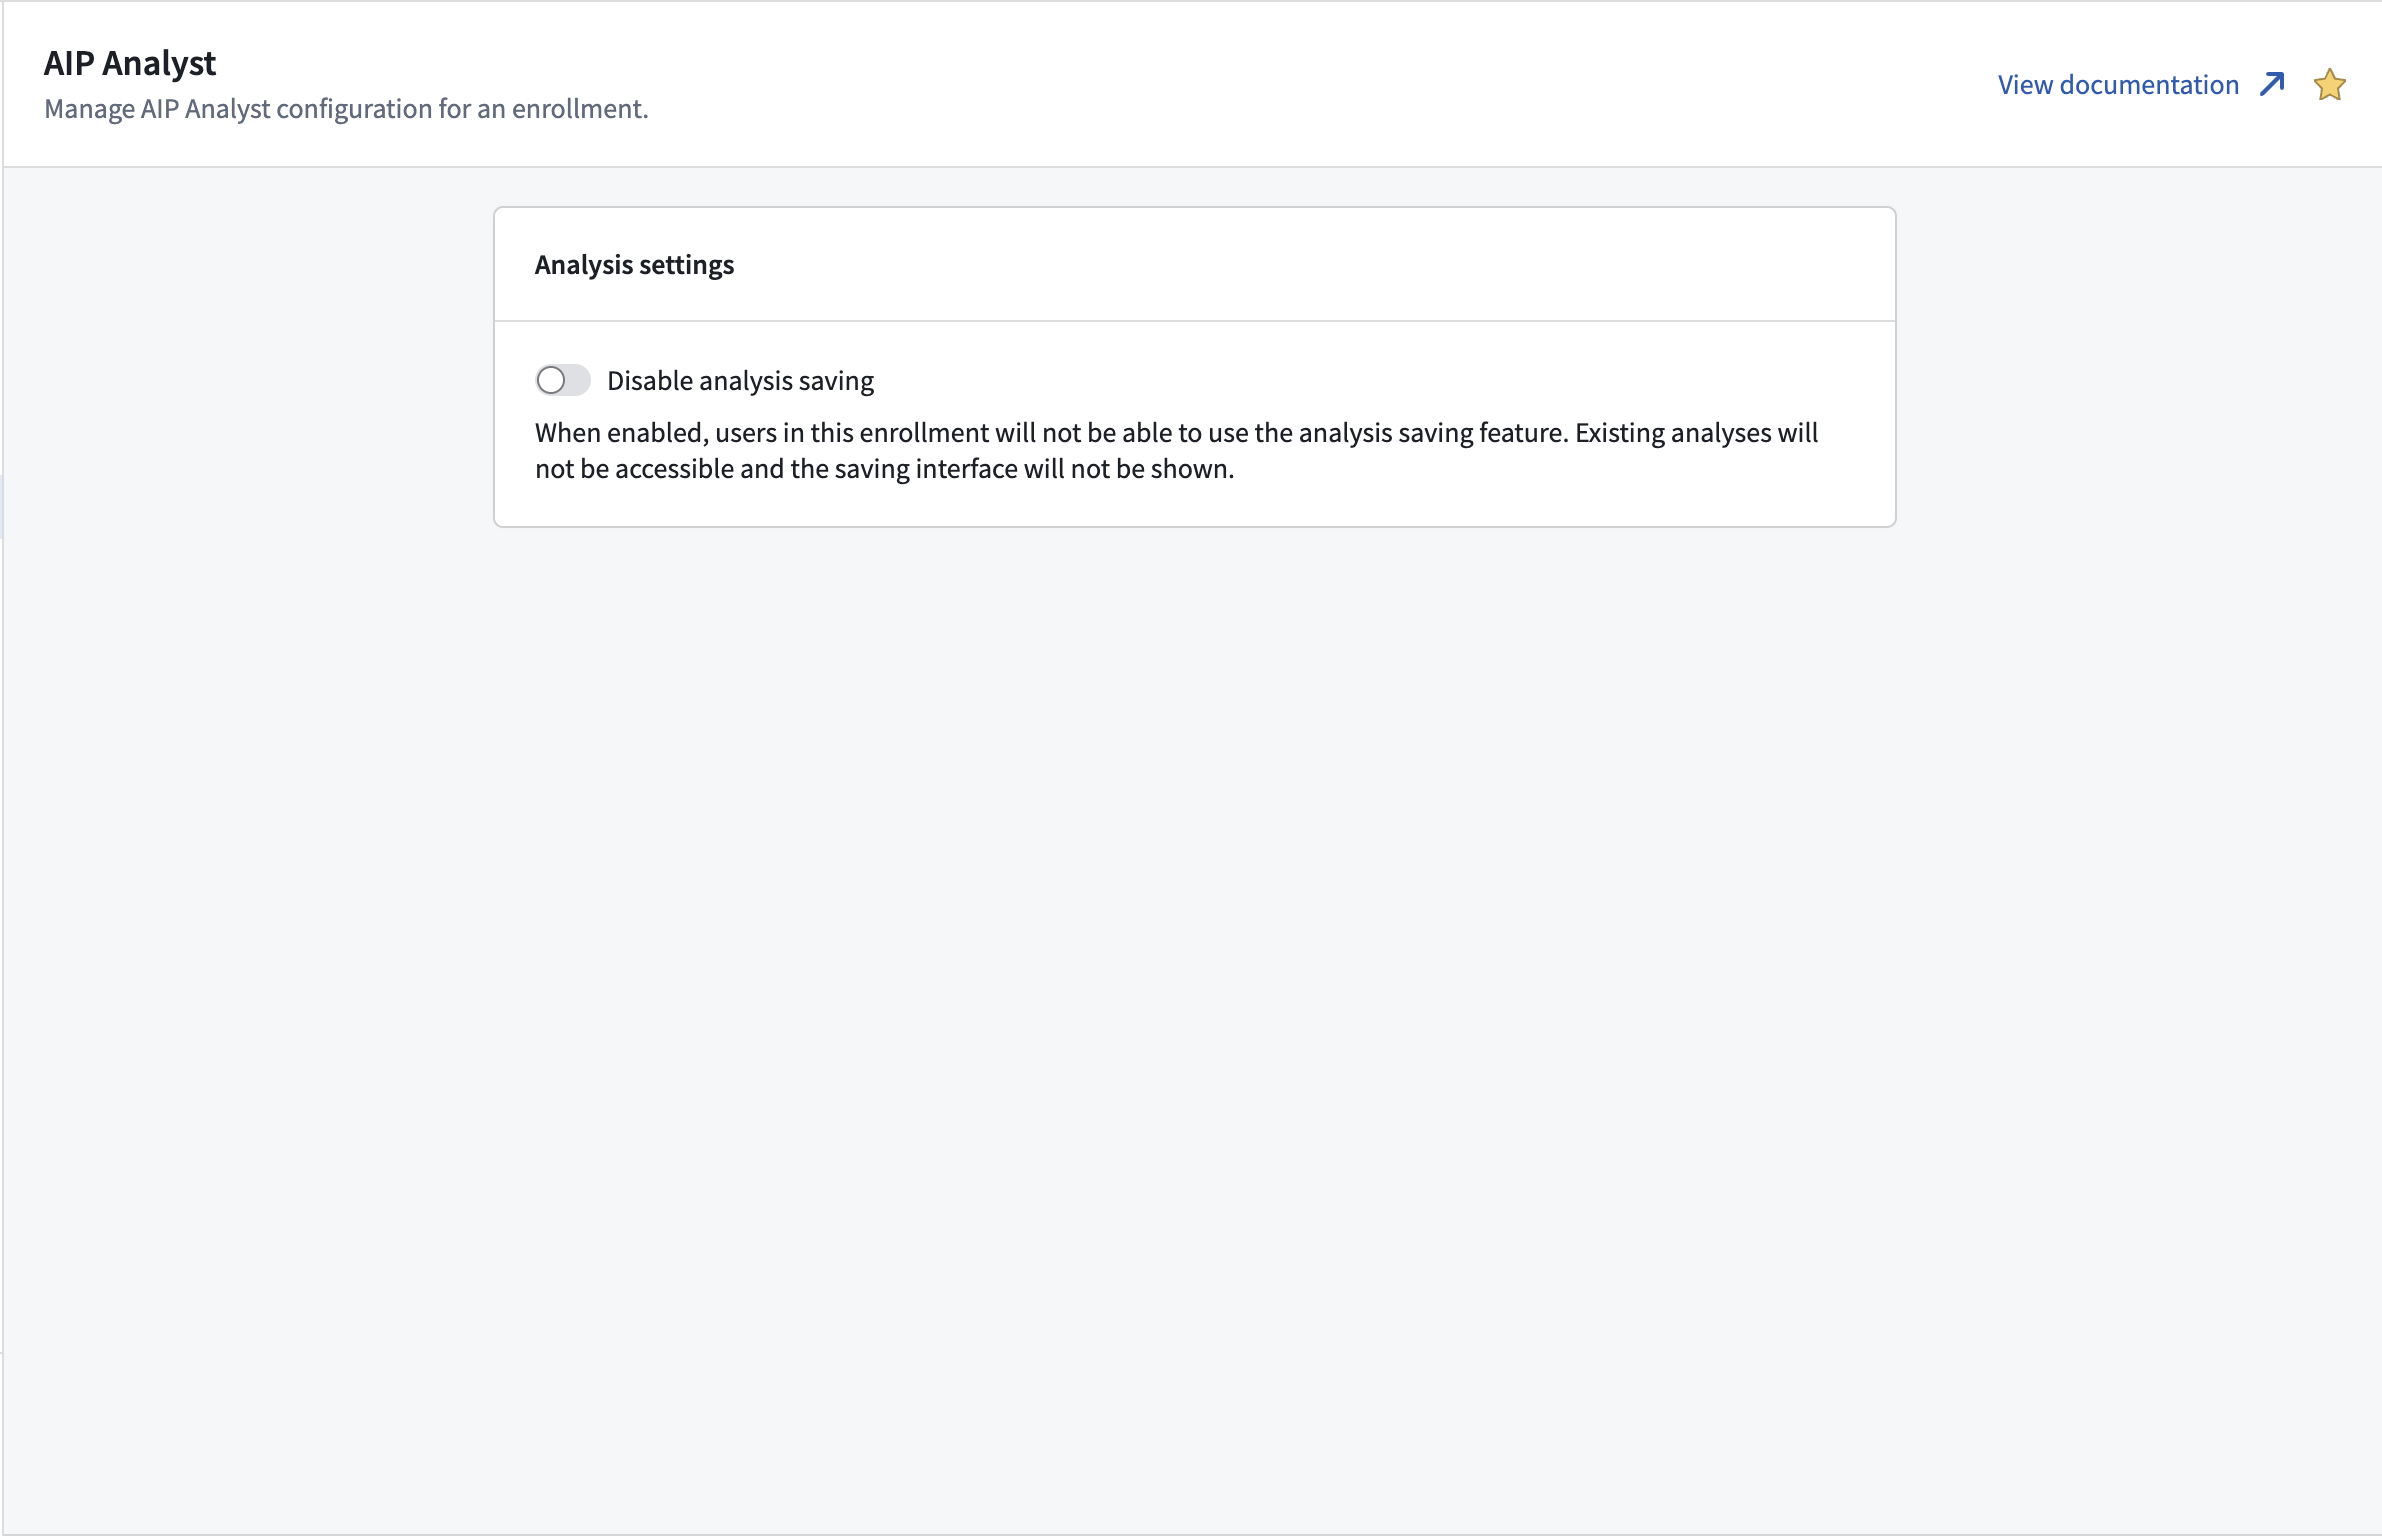
Configure analysis settings in Control Panel.
Learn more about admin configuration.
AIP Analyst capabilities
AIP Analyst helps users move from natural language questions to grounded analysis across Foundry. The agent can search the Ontology, build and transform object sets, run aggregations and SQL queries, analyze uploaded files and media, and generate summaries, charts, and maps. With analysis resources, these workflows can now be revisited, shared, and extended over time.
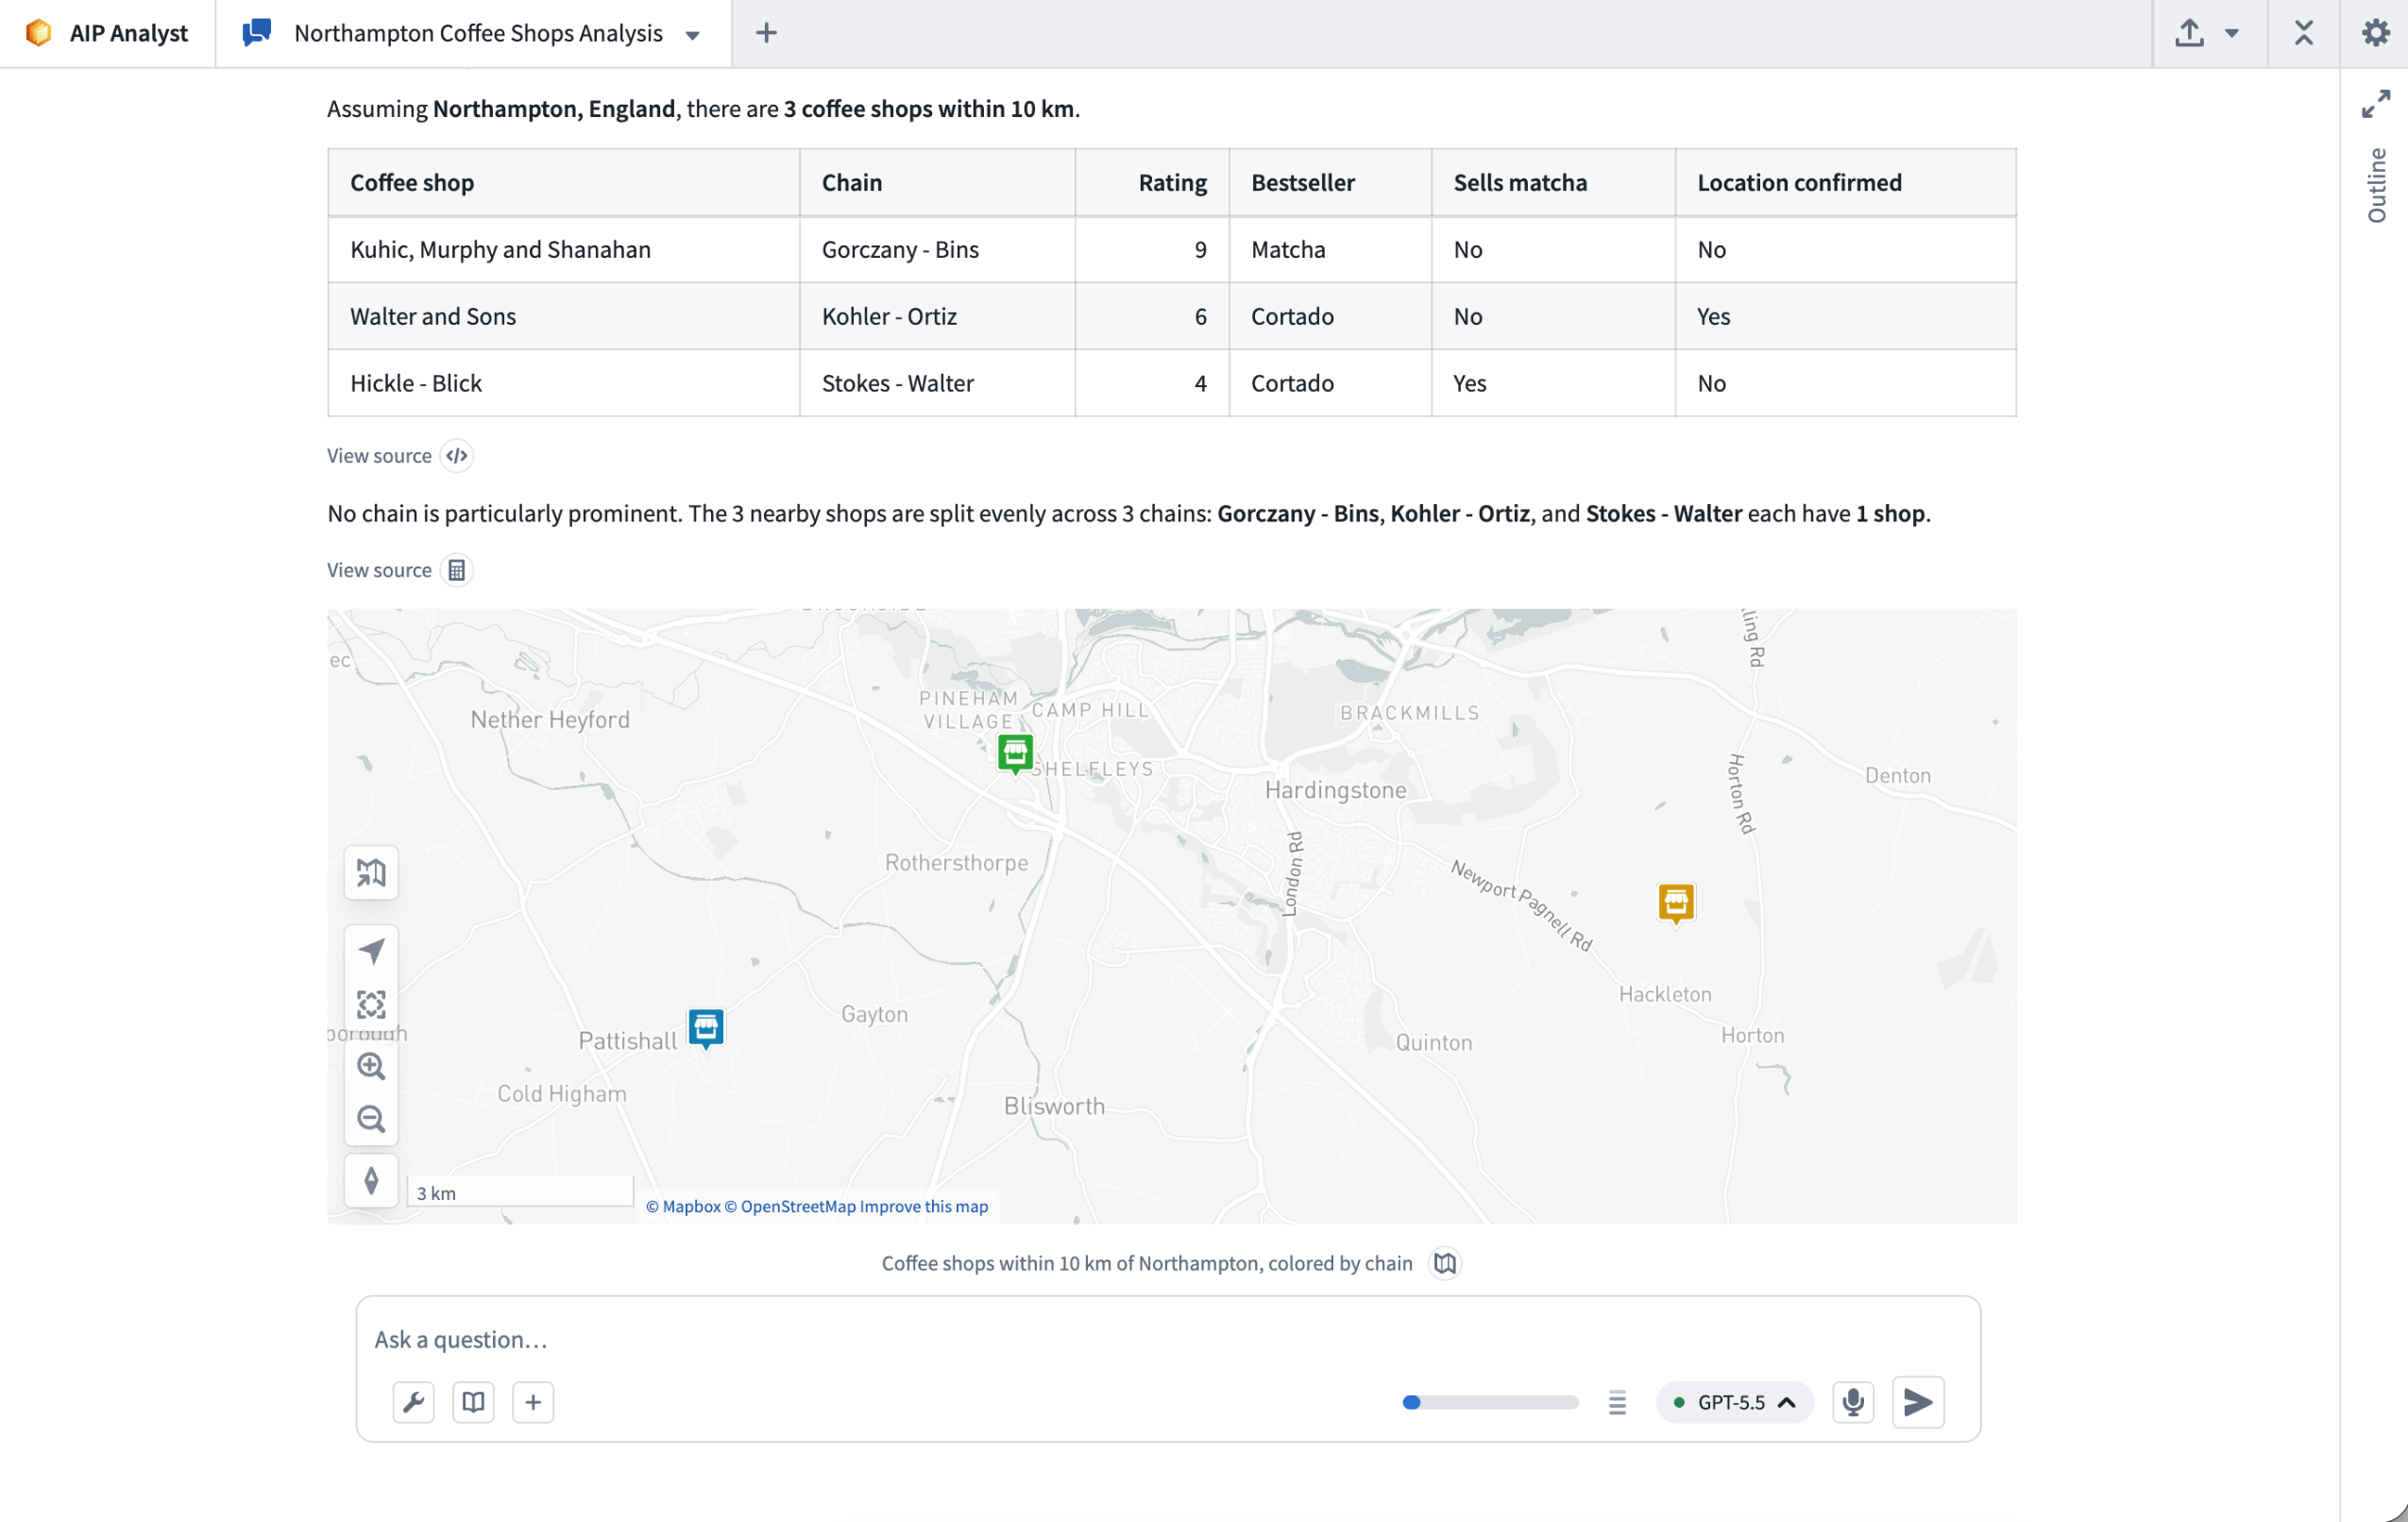
Example analysis in AIP Analyst.
Learn more about the AIP Analyst capabilities.
Configurable user rate limits for AIP capacity management
Date published: 2026-07-02
Enrollment administrators can now view and configure per-user rate limits for LLM usage in AIP, providing more granular control over how an enrollment's capacity is consumed.
Background
LLM capacity in AIP is managed at three levels.
- Enrollment-level limits set the overall ceiling for your organization's token and request throughput.
- Project rate limits control how much of that enrollment capacity each project can use. Project rate limits are already configurable by administrators.
- Per-user rate limits govern how much capacity any single user can consume; usage can come from interactive, user-attributed workflows, from applications like AIP Assist, AIP Analyst, or AI FDE, from native assistant features (such as Pipeline Builder Explain and Generate), or from IDE integrations such as Continue and Claude Code.
Until now, per-user limits were set by Palantir as fixed defaults that administrators could not adjust. Until the introduction of configurable user rate limits, there was no self-service way to address issues like a single power user consuming a disproportionate share of capacity on a given model, or specific teams requesting more capacity.
What's new
Administrators can now manage per-user rate limits directly from the Manage rate limits tab on the AIP usage & limits page in the Resource Management application. Administrators are now able to:
- Set a custom default that applies to every user across all models, replacing Palantir's published defaults.
- Add per-model overrides to raise or lower limits for specific models without changing limits across all models.
- Create user-group overrides targeted at specific Foundry user groups, each with its own default and optional per-model configuration. This enables you to give a group of heavy builders more capacity, or restrict experimental users so that they only have high capacity on a subset of models.
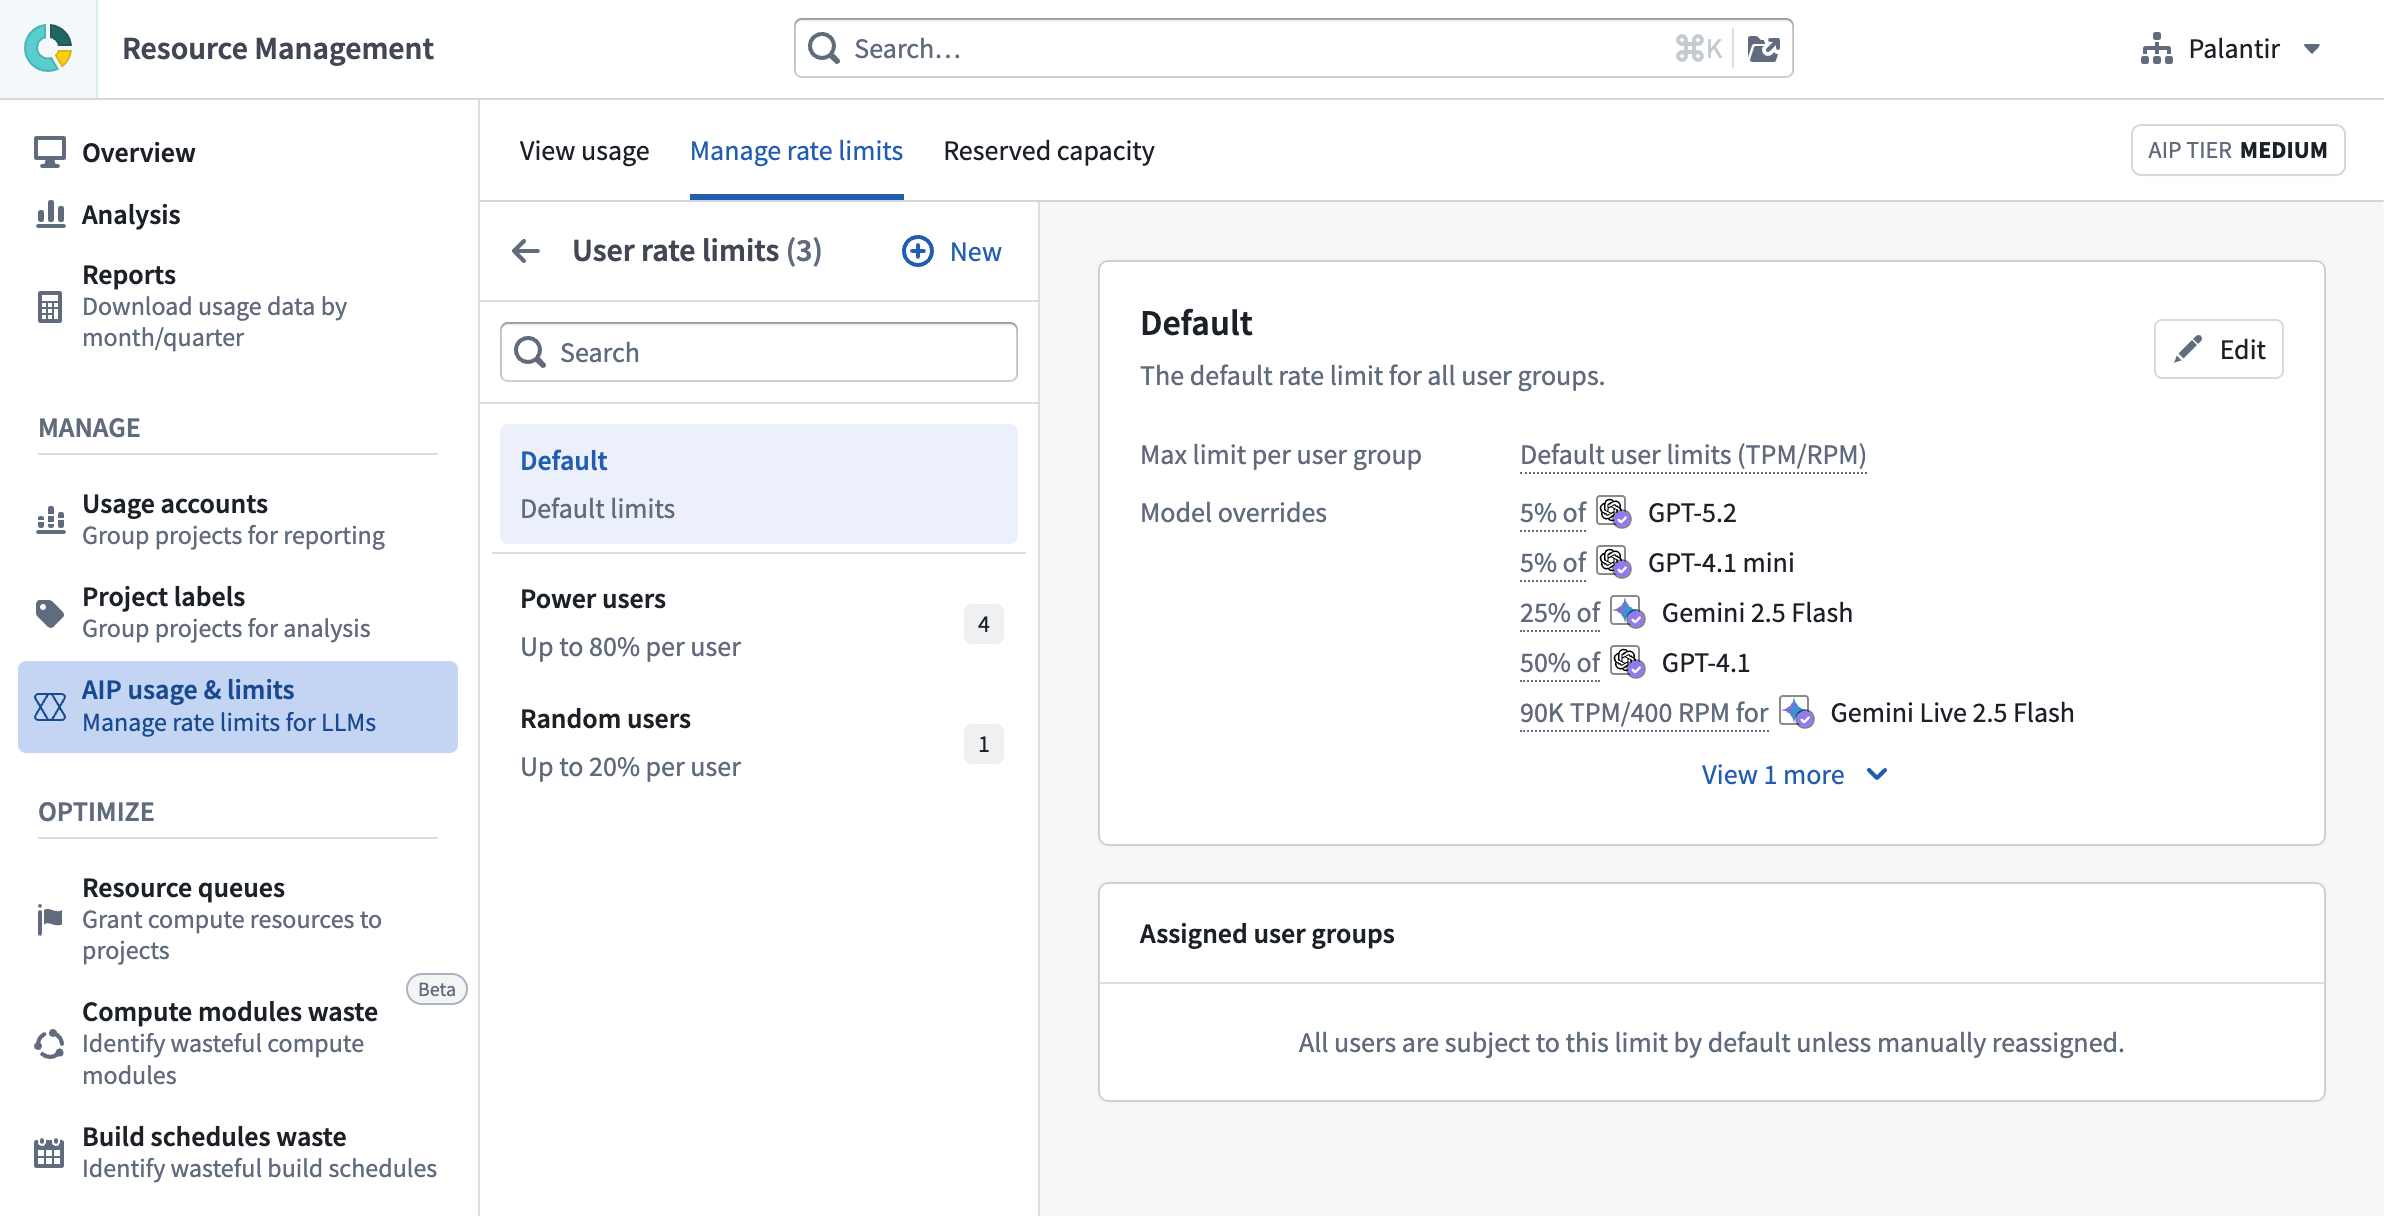
The interface for managing AIP usage & limits, displaying the default user rate limits and model overrides.
Palantir's built-in defaults remain the recommended and sensible option, and will continue to apply wherever no custom override is configured. We recommend starting with the defaults and adjusting only where your usage patterns call for it, and revisiting any custom limits as new models are released.
This feature is available now in the Resource Management application for all AIP enrollments. Learn more in the LLM capacity management documentation.
Your feedback matters
We want to hear about your experiences with AIP capacity management in the Palantir platform and welcome your feedback. Share your thoughts with Palantir Support channels or on our Developer Community ↗ using the control-panel tag ↗.