- Capabilities
- Getting started
- Architecture center
- Platform updates
Timeline
You can use the timeline to view time-based data as well as configure the time window and selected time. You can set the selected time and time range, further inspect the time-based properties of objects, and filter to specific objects in a given time range.
The timeline can be used to view events, such as event objects and timeline geometries, track breadcrumbs, and time series.
Even when the timeline is not open, the timeline's time range and selected time can affect any time-based data that is visible on the map.
Basic controls
Open and enable the timeline
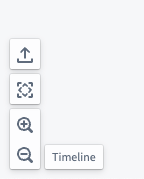
Select Timeline in the lower-left of the map canvas to show or hide the timeline.
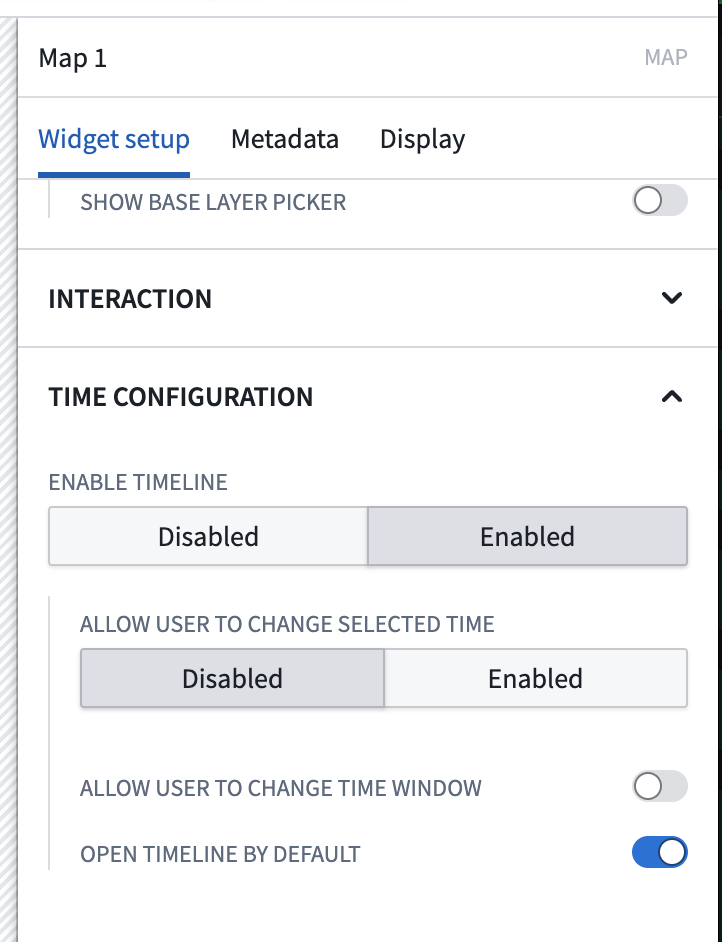
When embedding a map in Workshop using the Map widget, you can configure the timeline to open by default.
Adjust the selected time
The cursor position on the timeline represents the map's selected time. You can adjust the selected time by:
- Double-clicking or right-clicking on the timeline.
- Dragging the cursor to a new position.
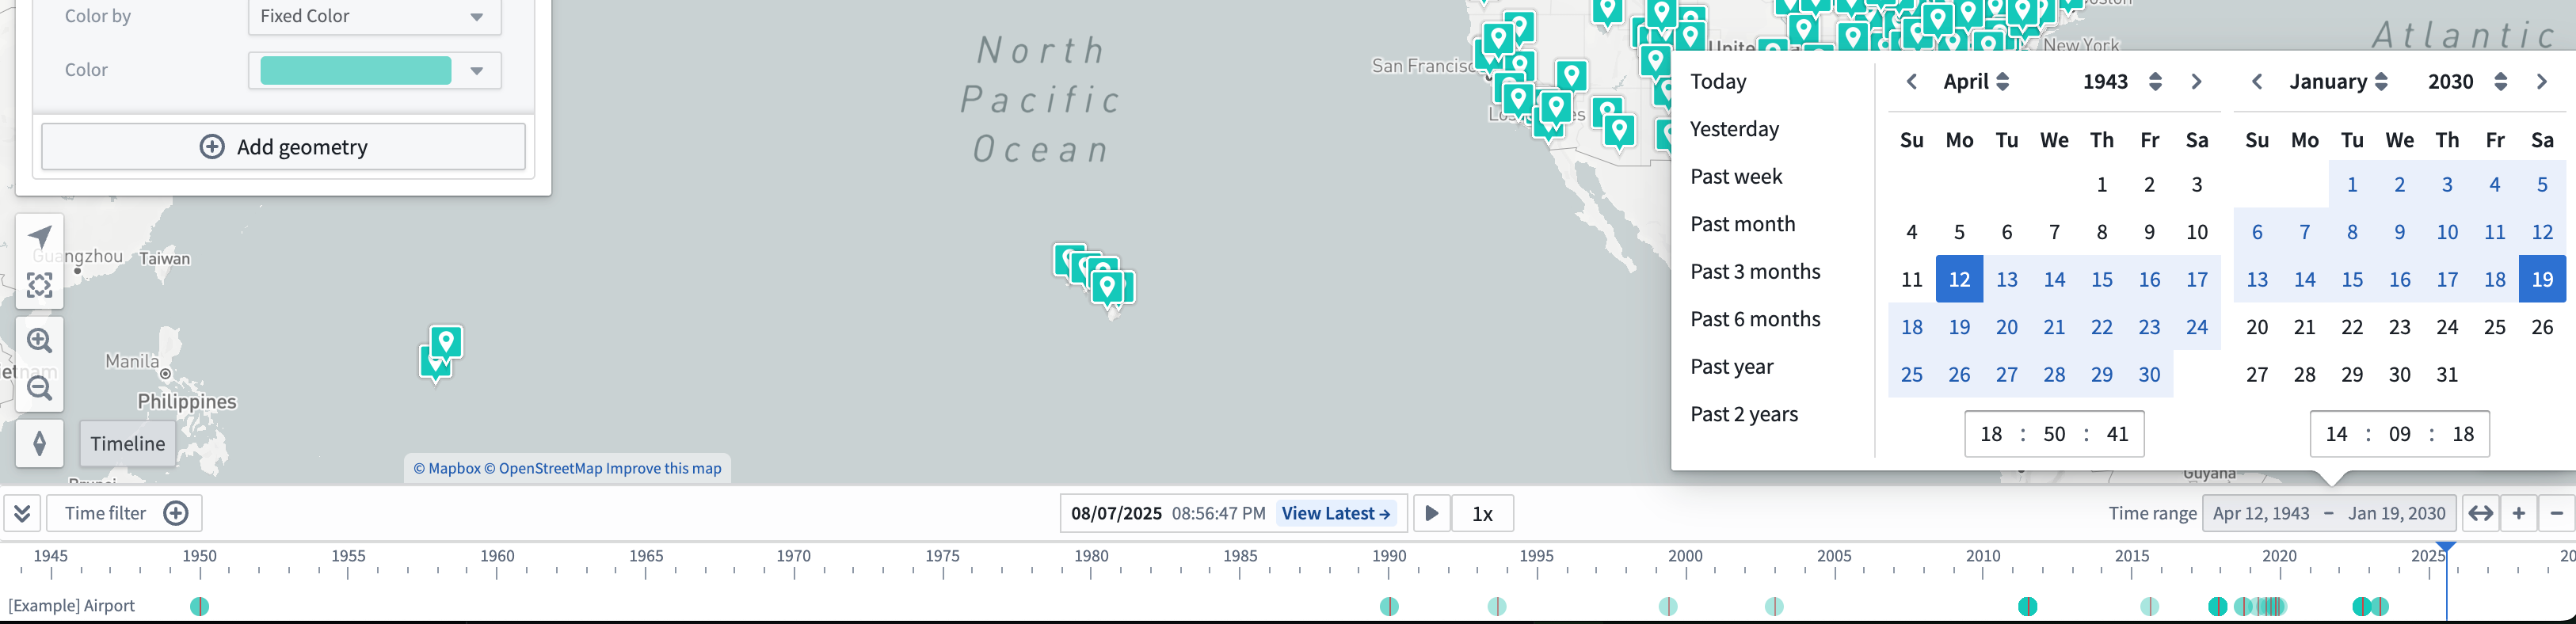
- Selecting the date or timestamp in the middle of the timeline header to render a date and time picker.
To get a more specific date for the cursor, you can click the cursor form to input a specific date and time.

Select View latest to set the selected time to the current time. When on the Latest Data view, the selected time will automatically update to match the current time. Use Latest Data mode in combination with streaming data to visualize data on your map that updates in real time.
When using the date and time selector, you can only select a time that lies within your object layer's current time range.
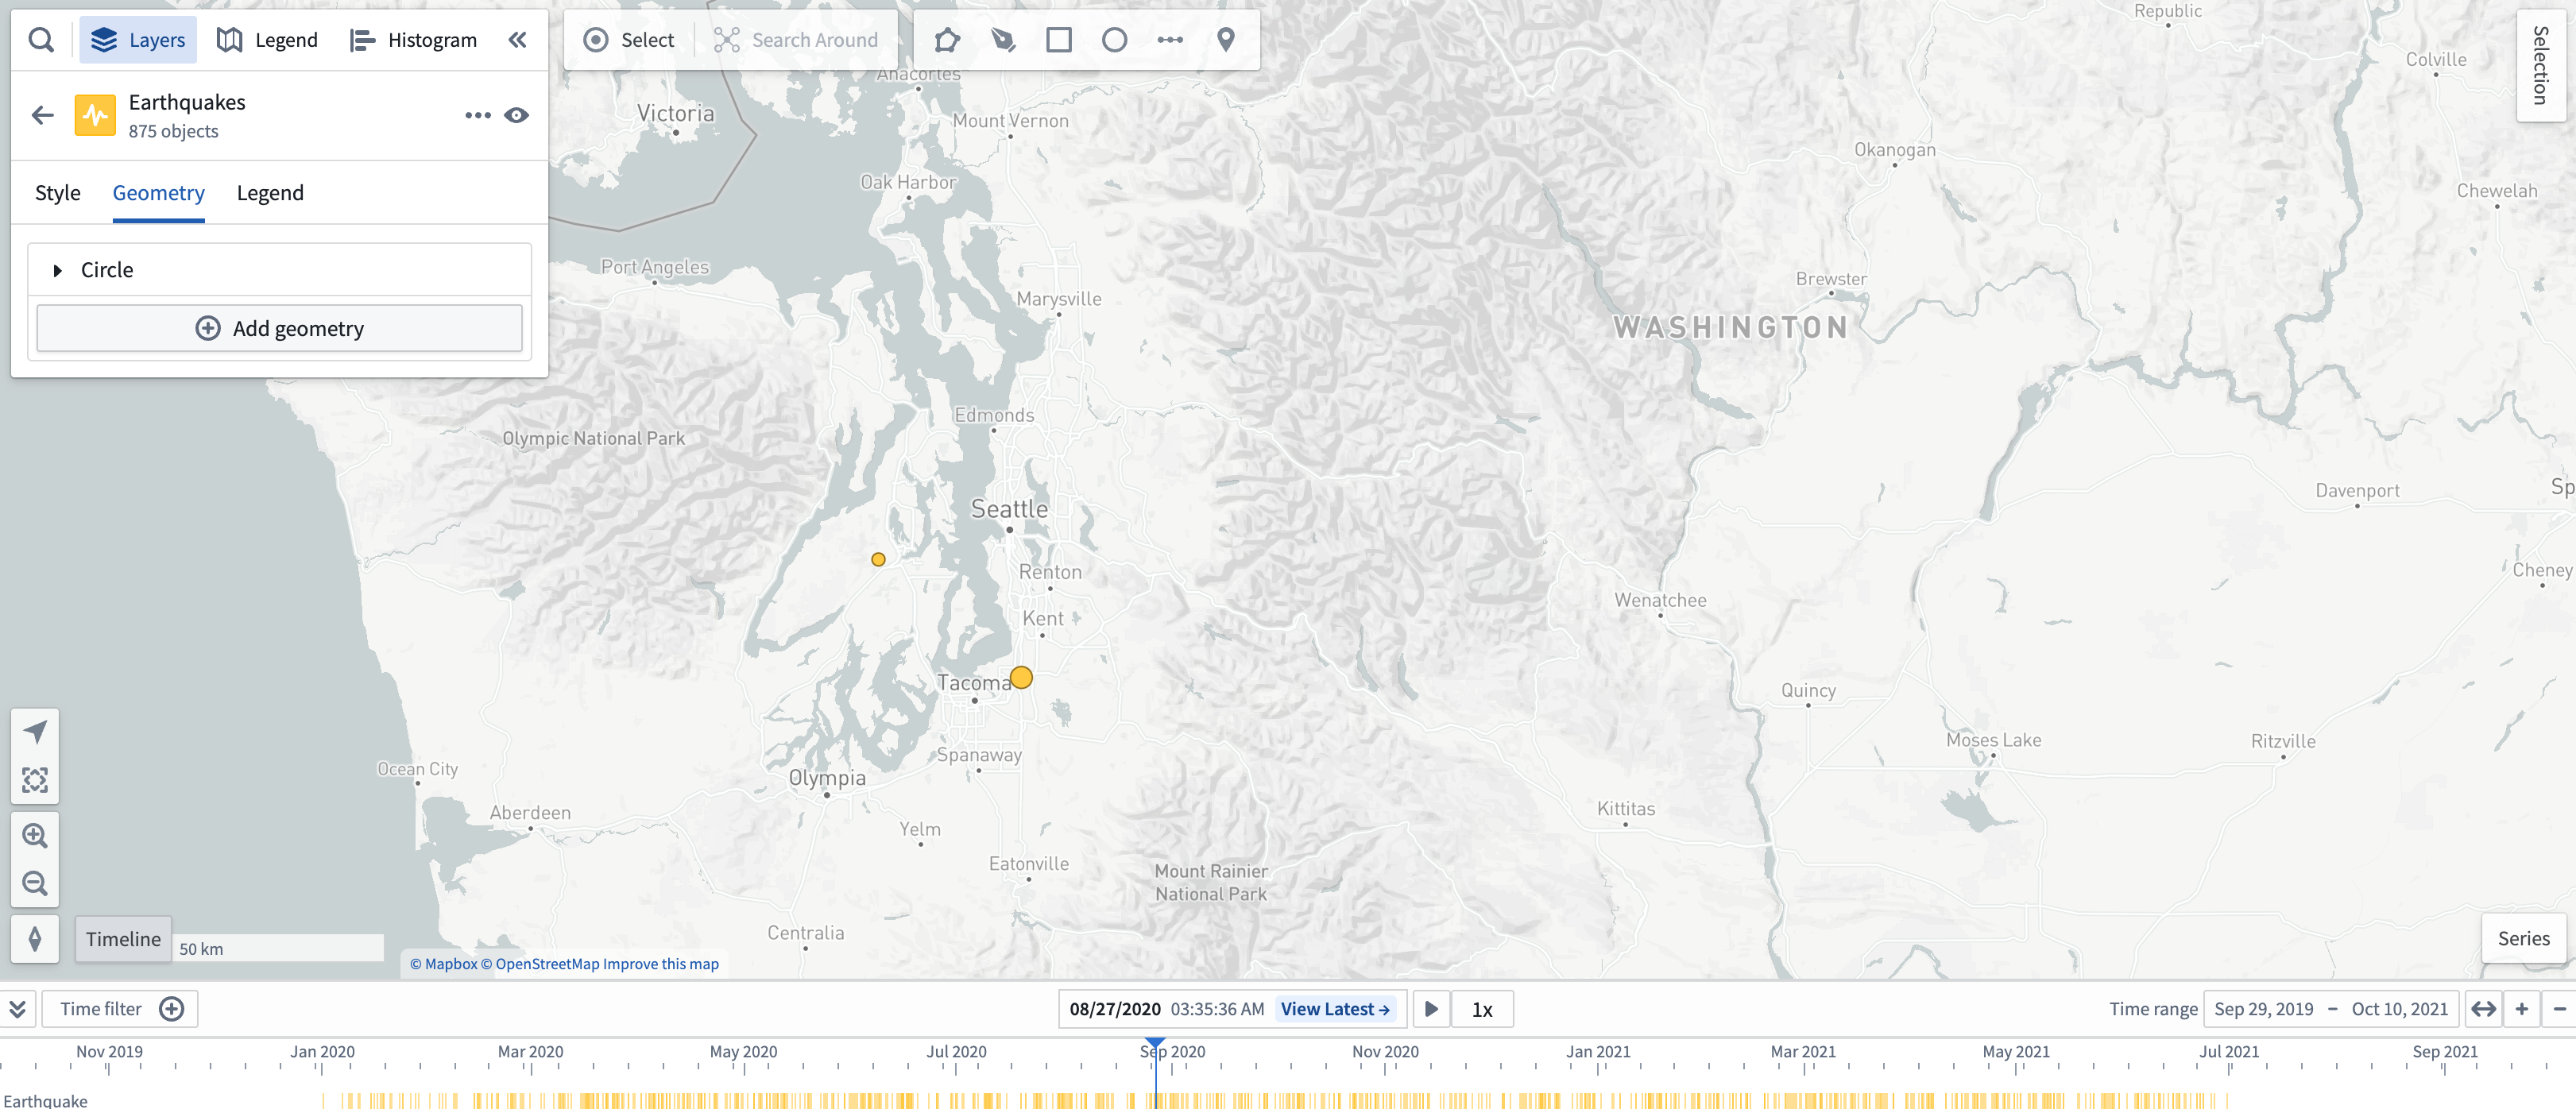
Adjust the time range
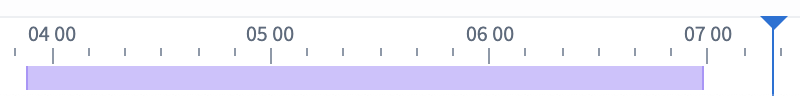
You can view the time range in the top right header of the timeline as well as from the start and end time of the timeline's view. You can adjust the time range with a mouse or trackpad by following the guidelines below.
Scroll controls:
- Use your mouse's scroll wheel to zoom in our out on the timeline, and press
Cmd(macOS)/Ctrl(Windows) before scrolling to pan the time range. - Use your trackpad to zoom in our out on the timeline by vertically swiping or pinching in or out.
Select Time range in the top right ribbon of the timeline header to input a specific date and time range for the timeline.
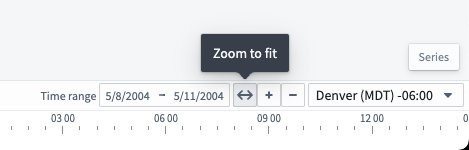
To get an automatic time window based on the data in the timeline, select the Zoom to fit button, marked by bidirectional arrows.
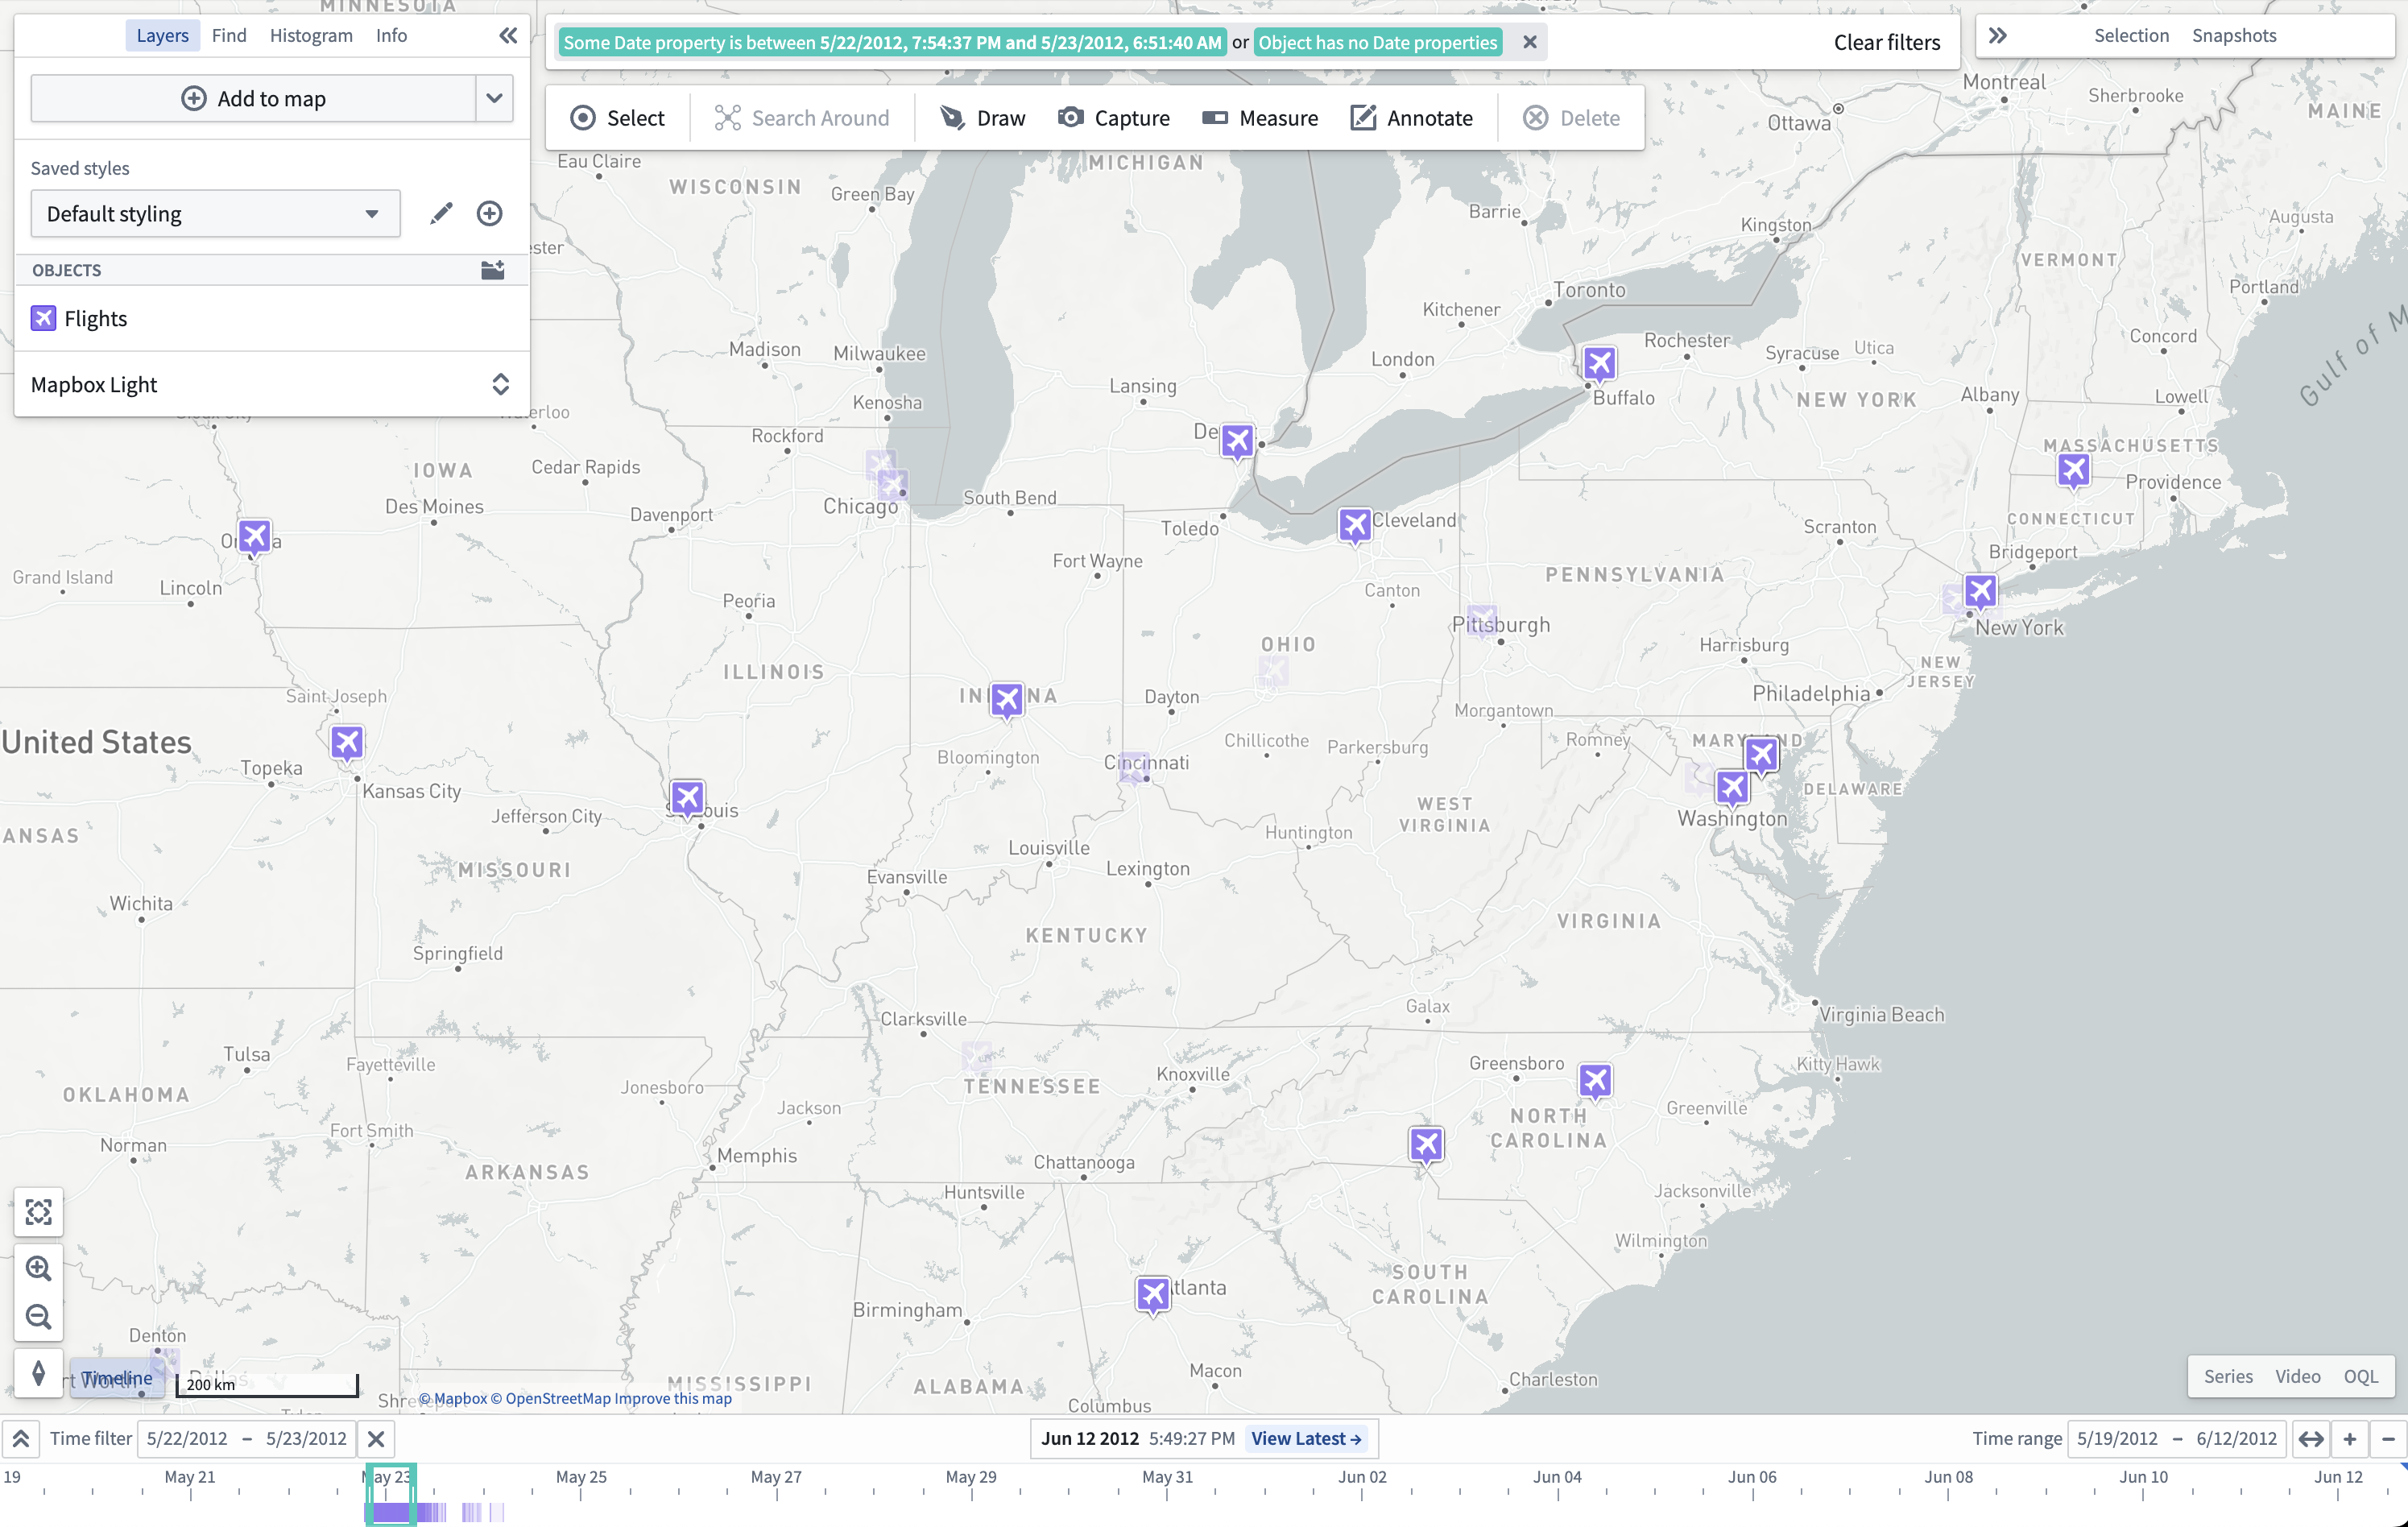
Filter the time window
You can filter events on a map by:
- Holding
Shift, selecting a point in the timeline, and dragging your cursor on the timeline to create a time filter window. - Using the Time filter button in the control bar of the timeline.
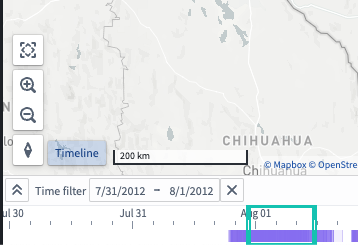
The Time filter is also available at the top of your map canvas. Objects on the map that match the filter are fully opaque, while objects that do not match the time filter are faded out.
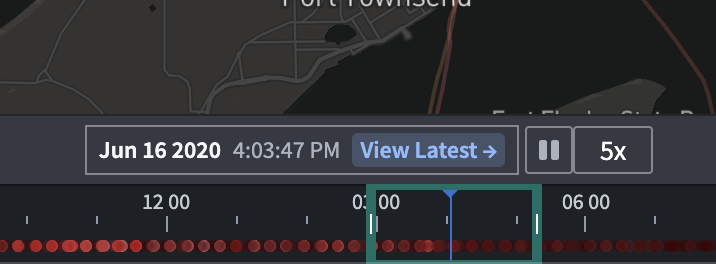
Timeline playback
You can use the play button (⏵) to move the time cursor automatically; playback speed can be adjusted with the speed presets (1x, 2x, 5x, 10x, 100x, and so on).
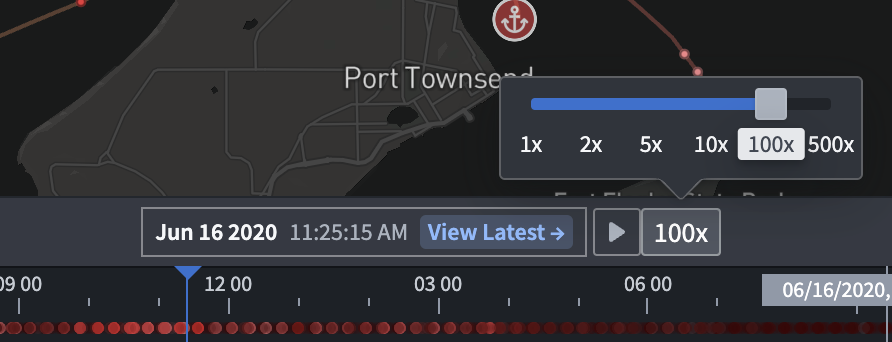
The cursor will loop automatically through the time window on the timeline or a time filter if it exists.
Expand the timeline
When the timeline is collapsed, data added to the timeline is not visible. However, you can still change the time range, filtered time window, and selected time.
To show each object type on its own timeline row, select the Expand (![]() ) in the control bar of the timeline.
) in the control bar of the timeline.
Add data to the timeline
All data added to the timeline is grouped by object type.
Events
Event objects
Event objects will automatically add an event layer to the timeline.
Timeline geometries
To make a new timeline event geometry layer appear on the timeline, add a timeline geometry from the Layers panel. Learn more about applying custom styling to timeline geometries.
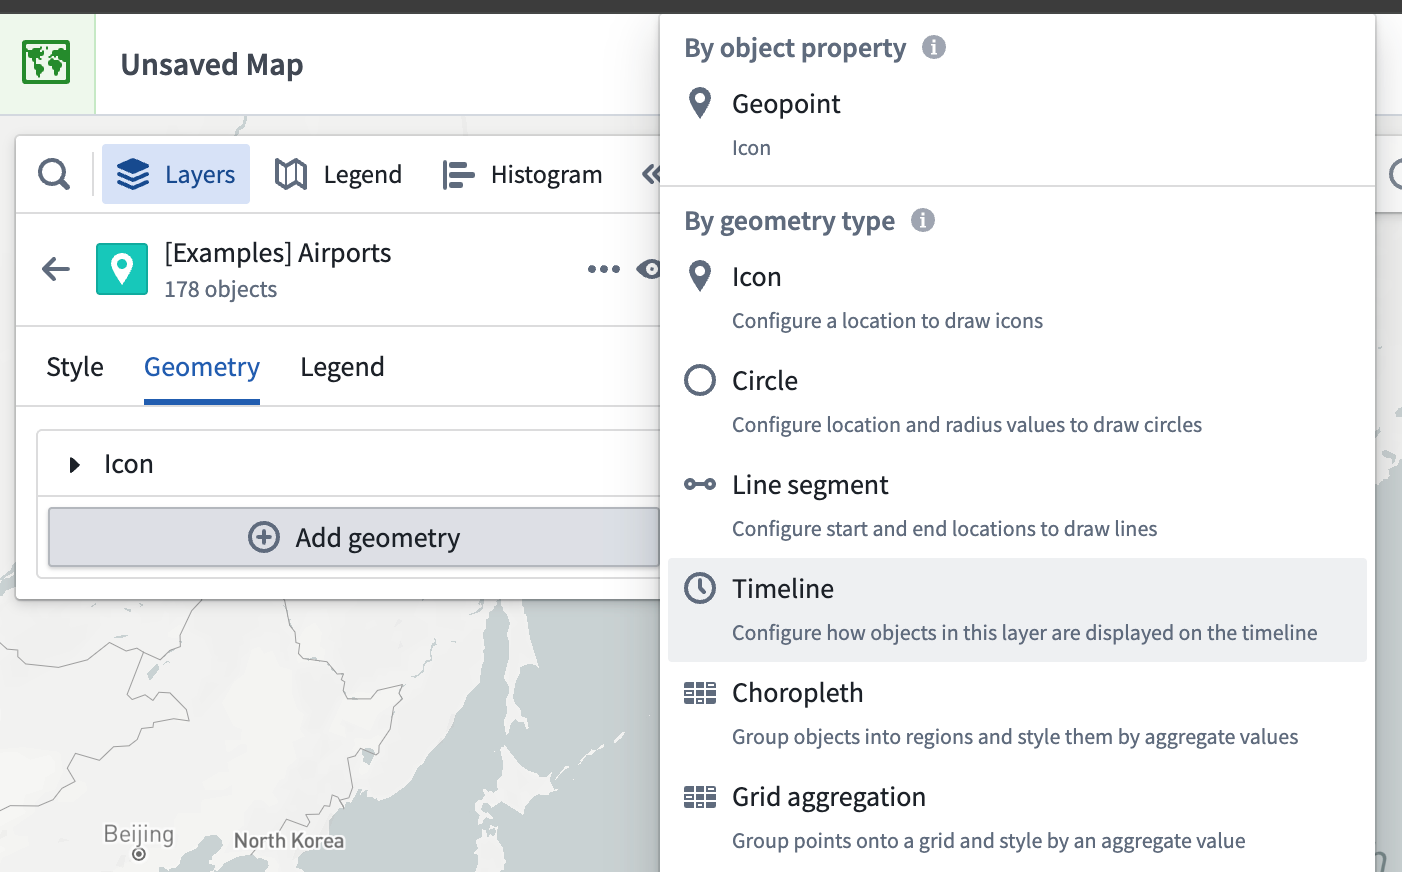
Track breadcrumbs
Tracks with a breadcrumb geometry also render on the timeline depending on the time range and the map viewport.
You can animate the paths of objects on their track by moving the selected time to other points.
To make a new track breadcrumbs layer render on the timeline, add a track breadcrumbs geometry from the Layers panel.
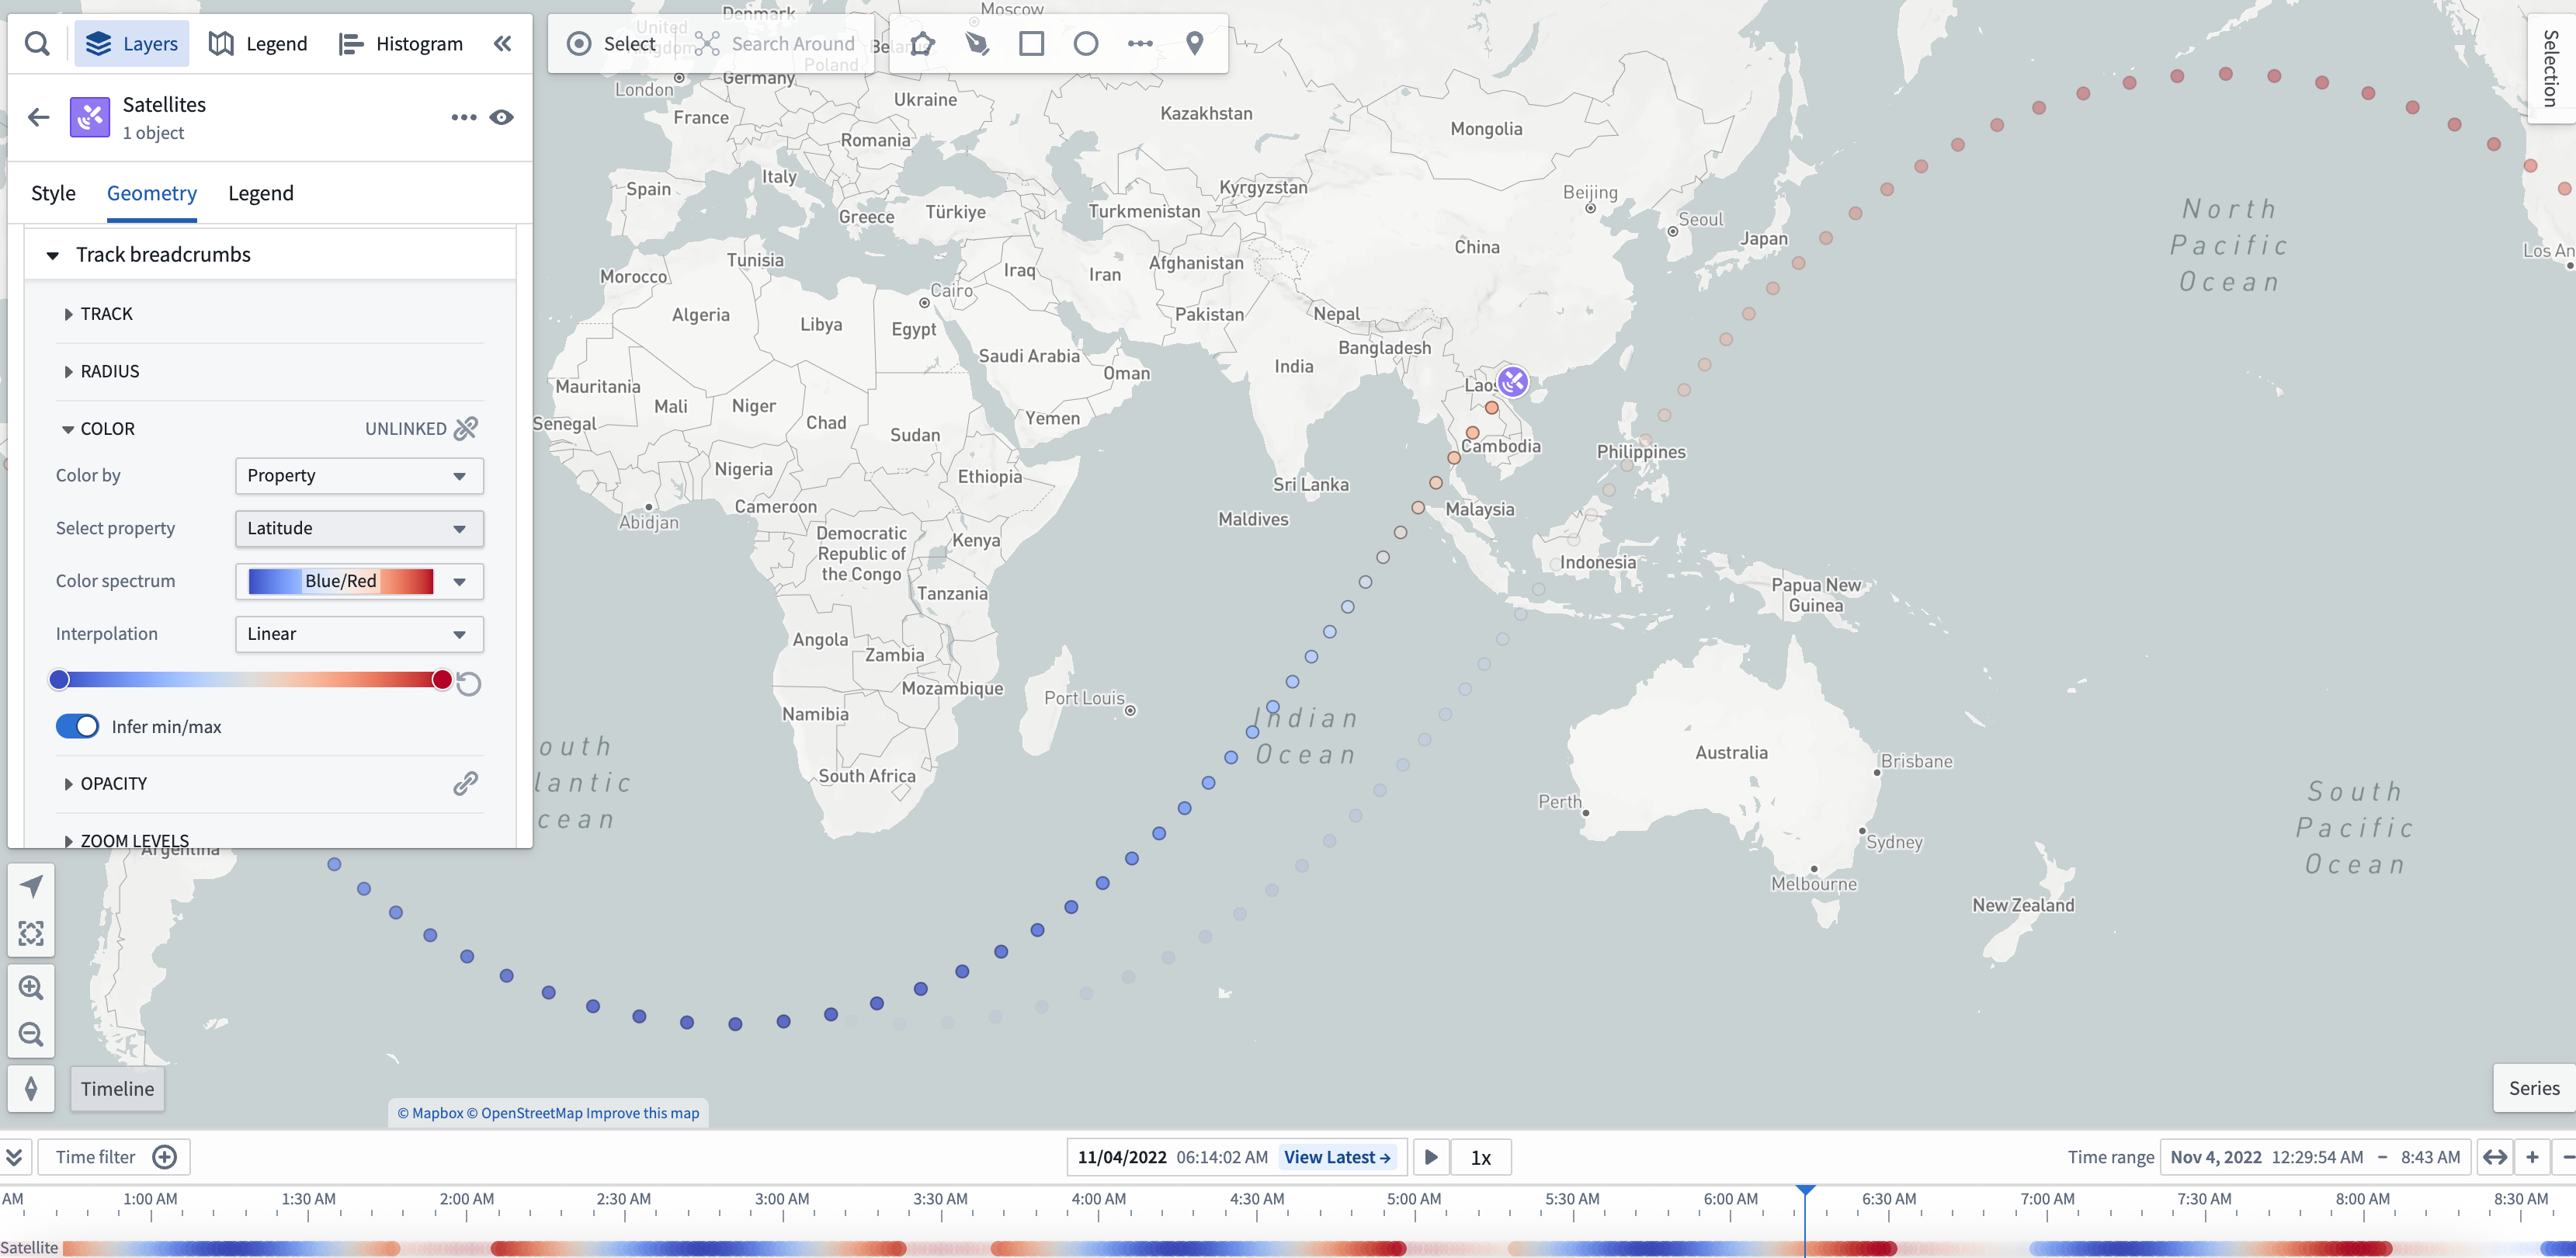
Once you add a track breadcrumbs layer on the timeline, you can access more timeline geometry actions from the layer's entry in the timeline legend, such as further styling in the Layers panel.
Time series [Beta]
Review the time series documentation to learn about adding and configuring a time series in your map's timeline.
FAQs
Will time-based data be visible on the map or timeline for large object sets?
If you add a large (greater than 1,000 objects) object set, then your map automatically loads objects on your map through tile-based loading.
For tile-based loading, timeline events, time-based styling, and filtered time window will not be available. To fix, switch to Object-based loading. This also may require reducing the number of objects to enhance performance.
Why am I unable to see time series styling on my map?
If styling from time series properties are not visible, this means that Map is unable to derive color from a temporal property. You should verify the selected time contains your data.
Why am I unable to see time-based opacity on my objects on my map?
Select a specific object that is not visible and check if the timestamp or date property on the object matches the selected time. You can only configure time-based object opacity on an event object.
Why am I unable to see any track breadcrumbs on my map?
Tracks with a breadcrumb geometry also render on the timeline depending on the time range.
Why am I unable to see any time-based data in my timeline?
If nothing is visible on the timeline, use the Zoom to fit button to show time events on the map in the timeline's Time range.
When visible, the timeline displays lines for an object's time properties.
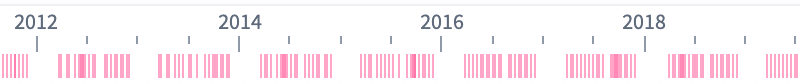
Additionally, the timeline displays bars for time ranges in an object's properties.