- Capabilities
- Getting started
- Architecture center
- Platform updates
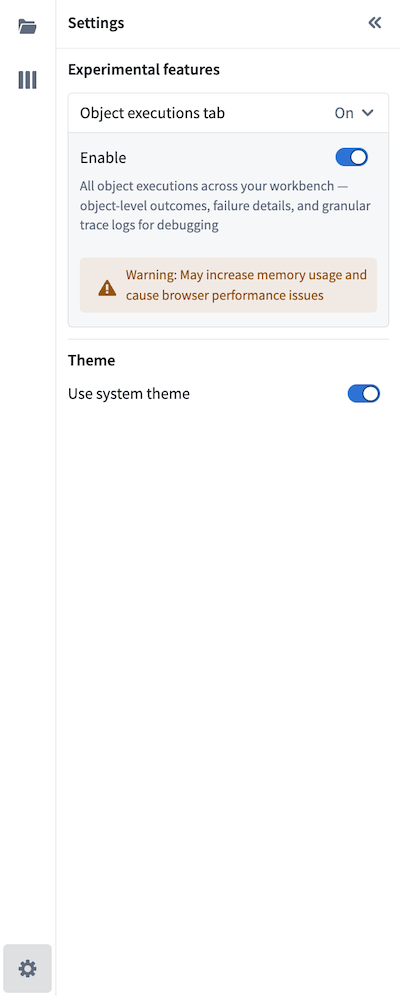
Object executions [Experimental]
The object execution feature is in the experimental phase of development. Functionality may change during active development.
View comprehensive observability into all automation executions across your workbench in the Object execution tab. Monitor system performance, investigate object-level failures from the automation down to the logic block, and understand how automations are processing objects over time. The Object execution tab can be turned on in the Settings tab, in the bottom left corner of the application.
Each execution entry displays the automation name, effect and fallback action (if applicable), execution details, outcome (success, failure, or fallback triggered), and affected object. You can filter executions by the following:
- Automation: Focus on executions for a specific automation.
- Time range: Scope to a specific period.
- Outcome: Filter to successes, failures, fallback actions triggered, or successful executions without edits.
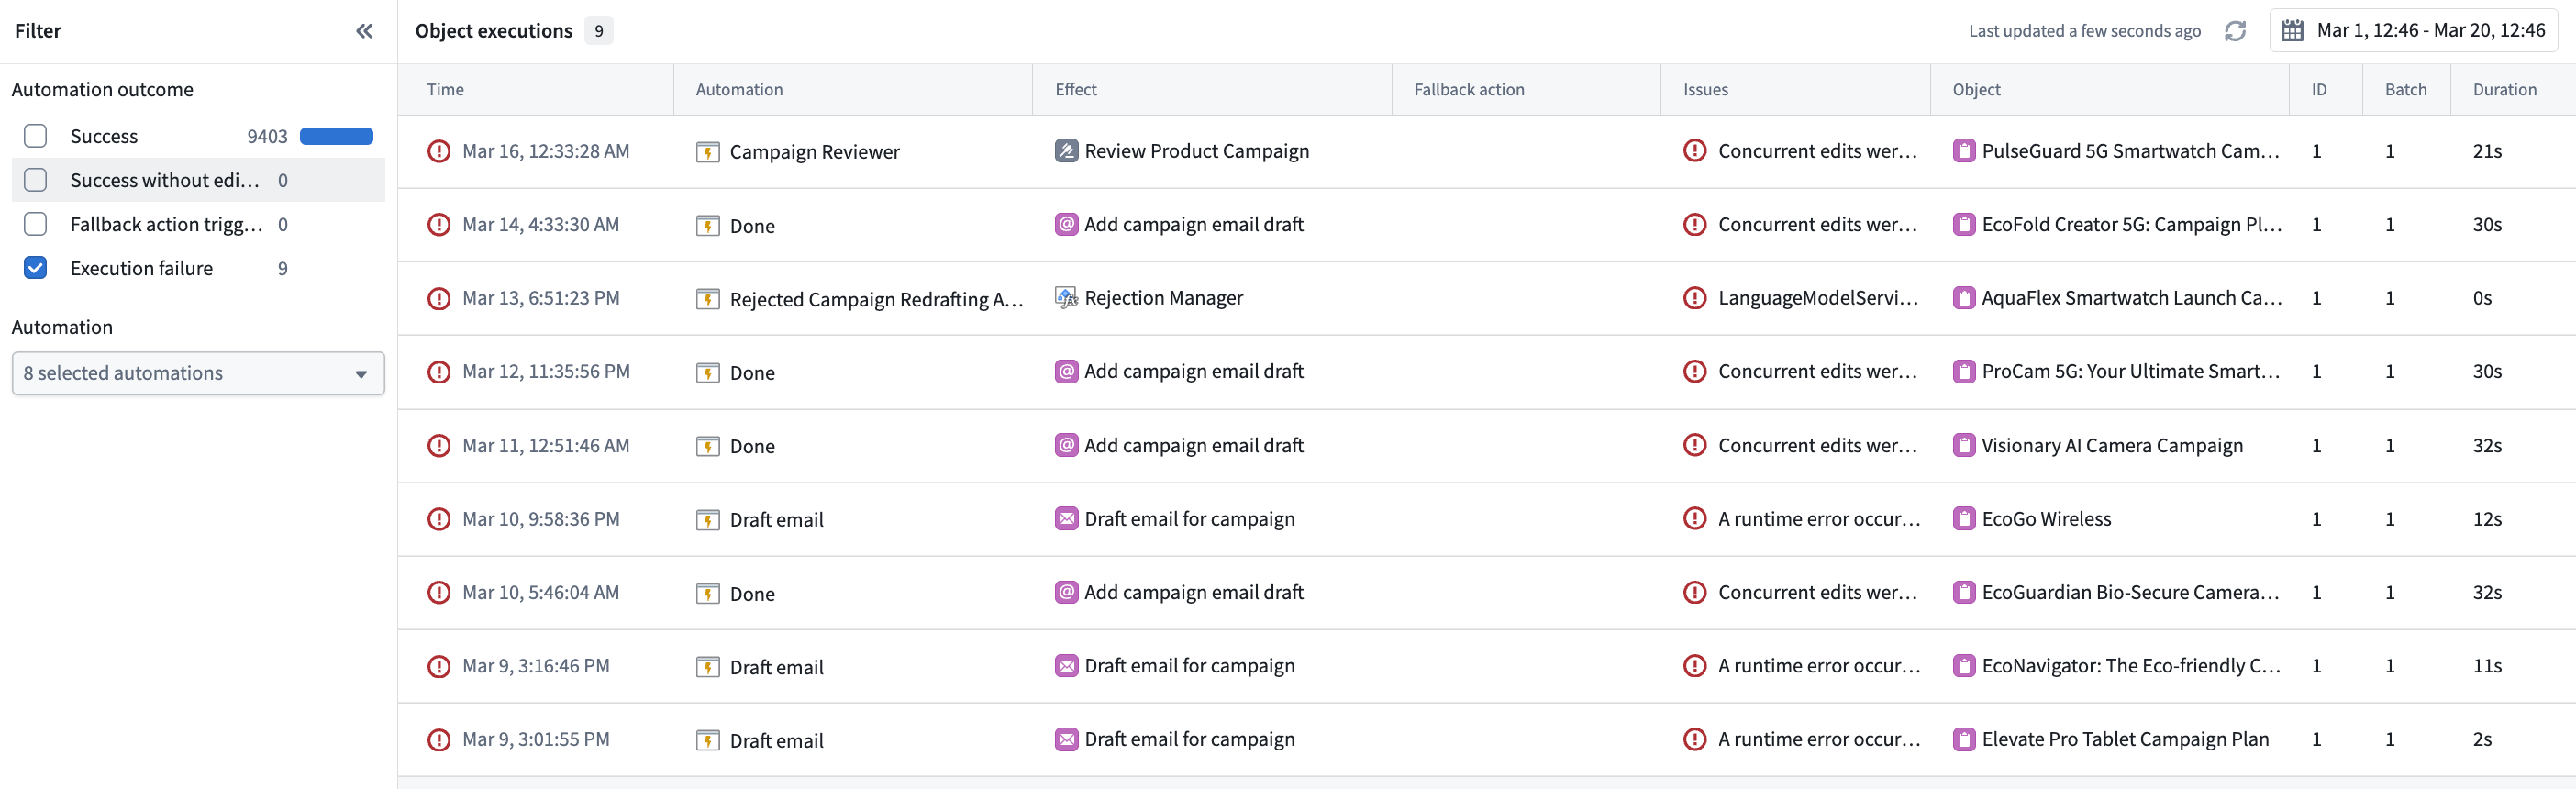
Select any execution to drill into trace logs with step-by-step details, inline links to related resources, error messages and stack traces for failures, and timing information to spot performance bottlenecks. Much of this context surfaces directly in Autopilot, so you can investigate without traversing multiple products within the platform.
For more granular logs, consider using console in your TypeScript functions or import logging in your Python functions.
Troubleshooting tips
Use the following best practices to help you troubleshoot failures in your automations:
- Filter to failed executions to find what broke in the automation path.
- Select a failed execution to read the trace logs and error messages.
- Navigate to the affected object to view its full history across all automations.
- Compare failed and successful executions of the same automation to spot patterns.
- Follow inline resource links to the automations, functions, and objects involved.
Monitor system health
Beyond debugging, object execution provides ongoing visibility into system performance over time. Use it to track how frequently automations run, where failure rates are increasing, which automations are processing the most events, and whether execution times are growing. Monitoring these trends helps you identify and address issues before they affect your workflow.