- Capabilities
- Getting started
- Architecture center
- Platform updates
Dataset Preview
The Dataset Preview application provides you with a variety of details of a given dataset, including metadata, build history, health, and more. Additional features are available for streaming datasets, including the ability to view information on streaming jobs and metrics to troubleshoot and debug stream performance.
The screenshot below displays the interface of the Dataset Preview application. The numbered sections are explained in more details in the following sections.
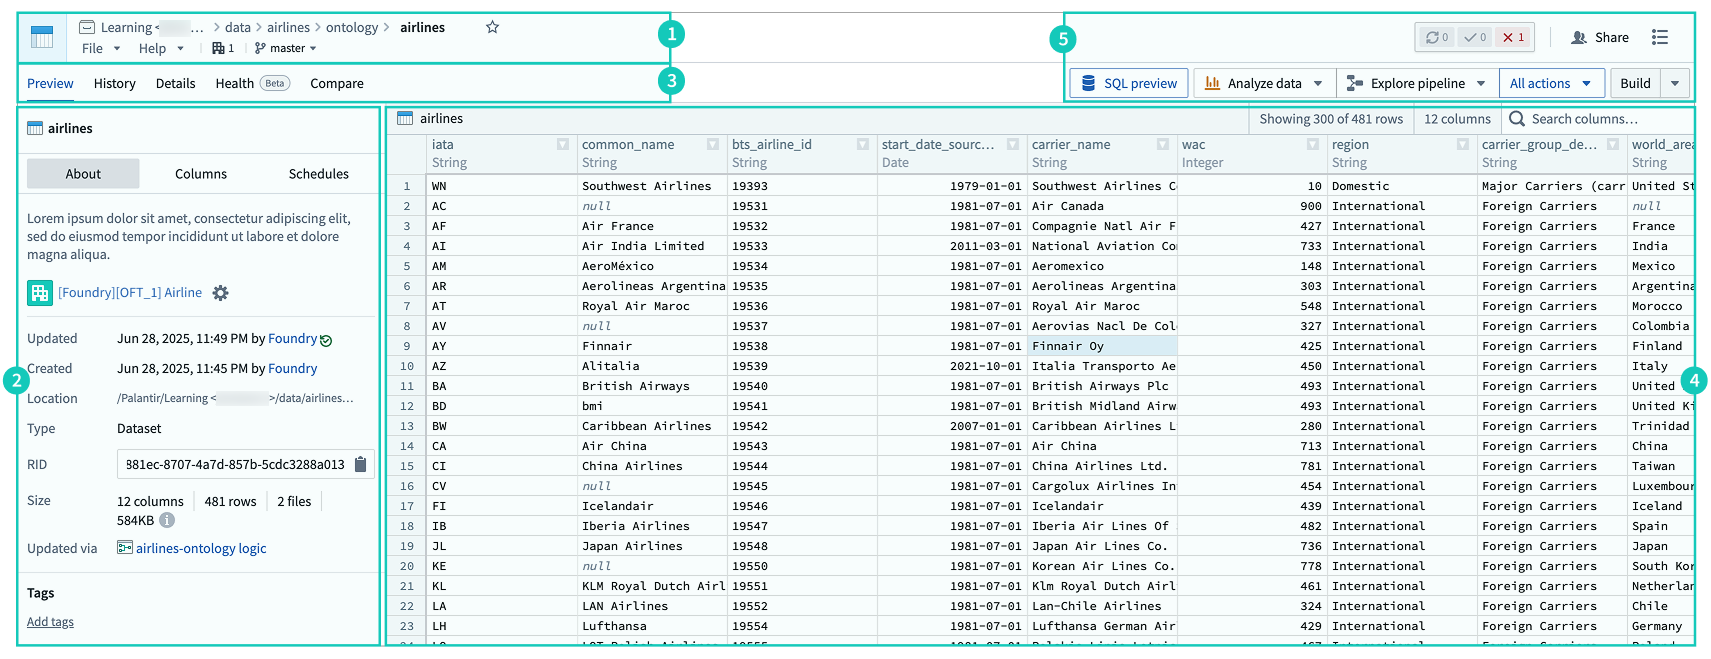
1. Dataset header
The header of the page identifies the selected dataset and provides basic information such as its name, display name (if existing), location, and the selected branch. The header also allows some file related operations such as sharing, moving, renaming, and more.
2. Information panel
The information panel provides metadata about the dataset and some basic administrative operations. The panel is divided into three sections:
- About: Information including the time the dataset was created and updated, the users who created and last updated the dataset, the size of the table, any tools and input datasets used to create the data, tags, and more. An Edit schema view is also available under the Updated by section that will infer a schema for CSV and JSON files. Here, users can also apply additional parsing options to drop jagged rows, change encoding, or add additional columns like file path, byte offset for row, import timestamp, or row number. For other file types, schema edits can be made in the Schema section under the Details tab.
- Columns: Information on the different columns in the dataset, including the type of data, description, and data stats (percentage of null values, distributions and samples).
- Schedules: Information about any configured build schedules that will run to update the dataset.
3. Tab views
Preview
The Preview tab provides a sample of the data in a table and allows light interaction with the full dataset. Learn more about the preview table in 4. Preview table.
History
The History tab view provides historical job (build) information. A Summary view on the right side of the page shows aggregated information on job statuses over time.
On the left panel, a list of jobs appears with their statuses and durations. Upon selection, a detailed Job view appears on the right showing detailed job information, including progress, specification, build logs, files and the resulting schema.
In streaming datasets, the History tab will only appear when the view is set to Archive. The History tab will show the archive transactions alongside the streaming jobs.

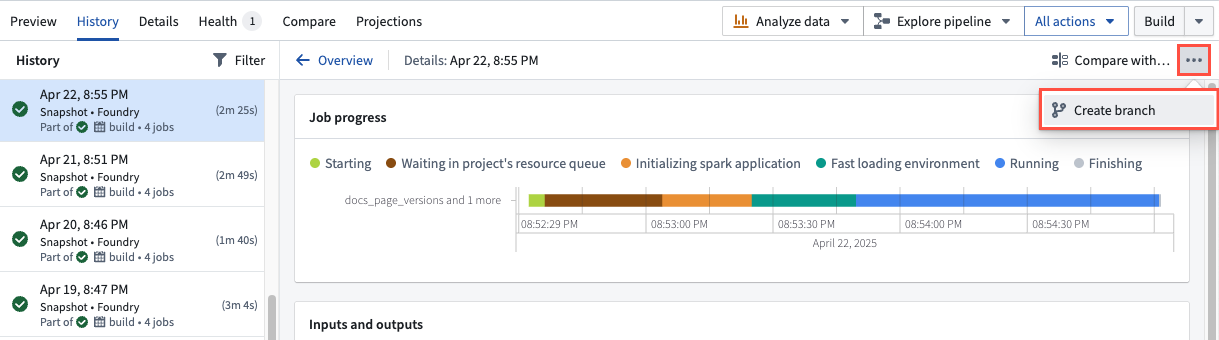
Create branches from historical transactions
You can use the History tab to create branches on historical transactions of your data that have not been deleted by a retention policy. Choose a previous transaction from the left panel and select the ellipsis (...) icon to Create branch.
Details
The details view provides additional technical information about the dataset, as well as some administrative operations:
- Schema: Provides full information on the table schema (column specifications) and allows you to edit the schema (if applicable).
- Files: Displays the list of files that make up the dataset and allows you to download them.
- Job spec: Displays the job specification containing essential information for the dataset to build.
- Syncs: Surfaces the status and details of data syncs to different databases. For some sync types, additional settings can be applied.
- Custom metadata: Allows you to add custom fields of information to the dataset. The fields added in this section are displayed in the information panel of the overview page.
- Resource usage metrics: Provides graphs and information on disk and Spark usage of the dataset over time.
- Last run details (only for streams): Shows detailed information about the latest stream run.
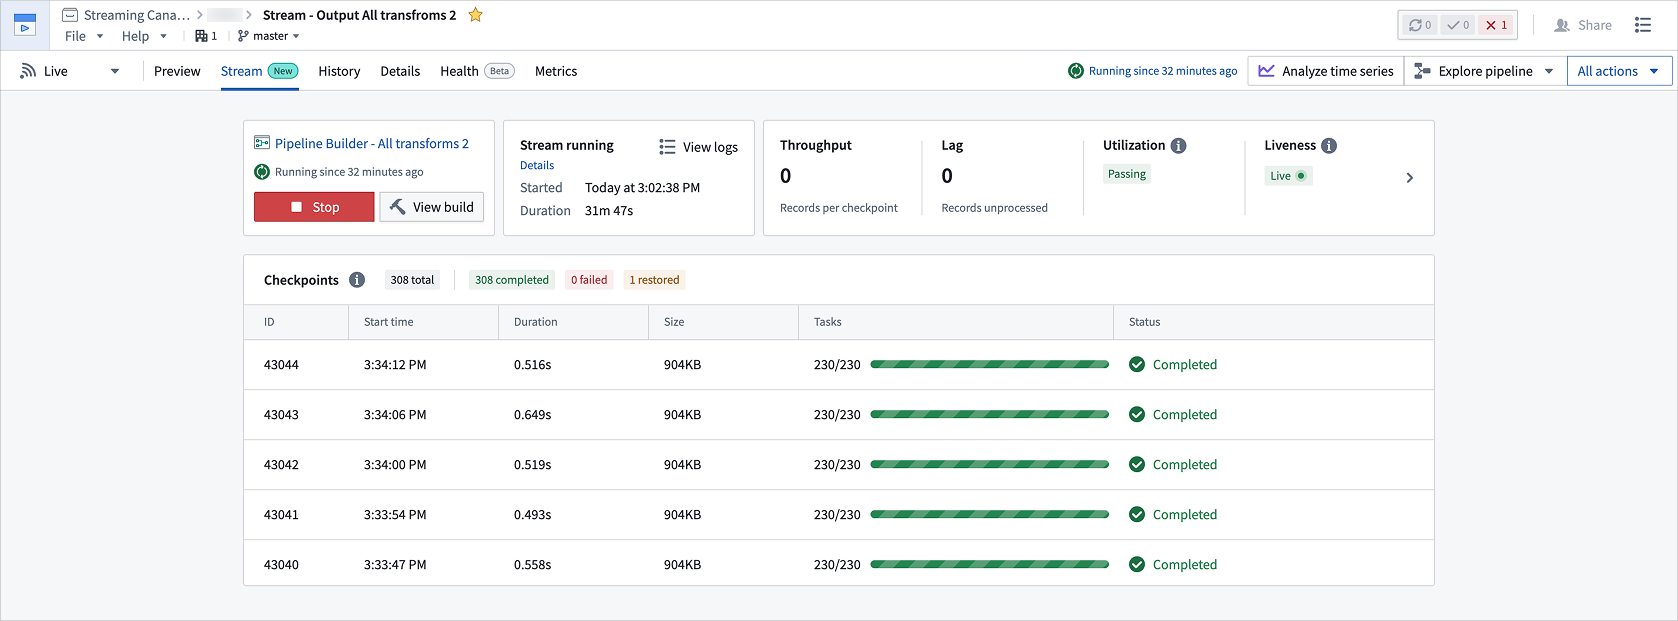
Stream (only for streaming datasets)
When the dataset is a streaming dataset, the Stream tab will show current and historical information on the streaming jobs. By changing the time period, you can explore the logs and details of jobs that streamed the dataset during that time.
Metrics (only for streaming datasets)
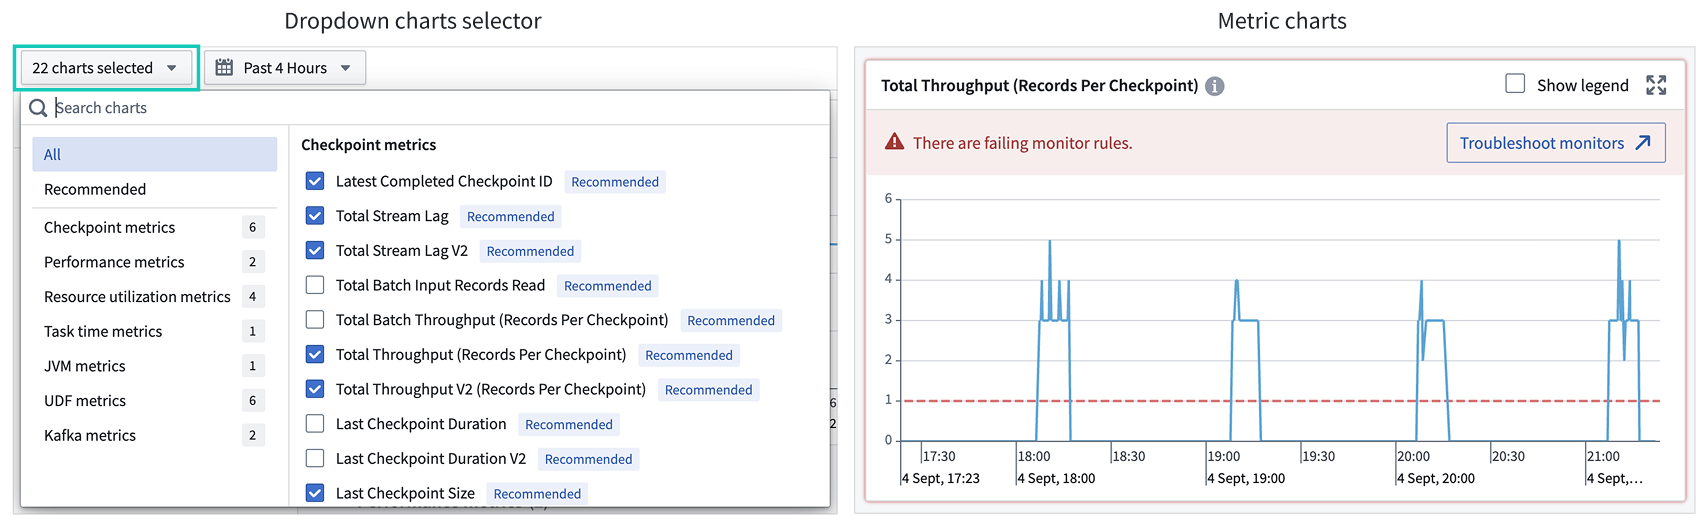
When the dataset is a streaming dataset, the Metrics tab shows charts and related interactions for analyzing and troubleshooting streaming job performance. It includes a dropdown menu for selecting metrics to visualize trends, with recommended debugging metrics highlighted within it. The metric charts can be expanded for detailed viewing and display thresholds and warning indicators with debug links.
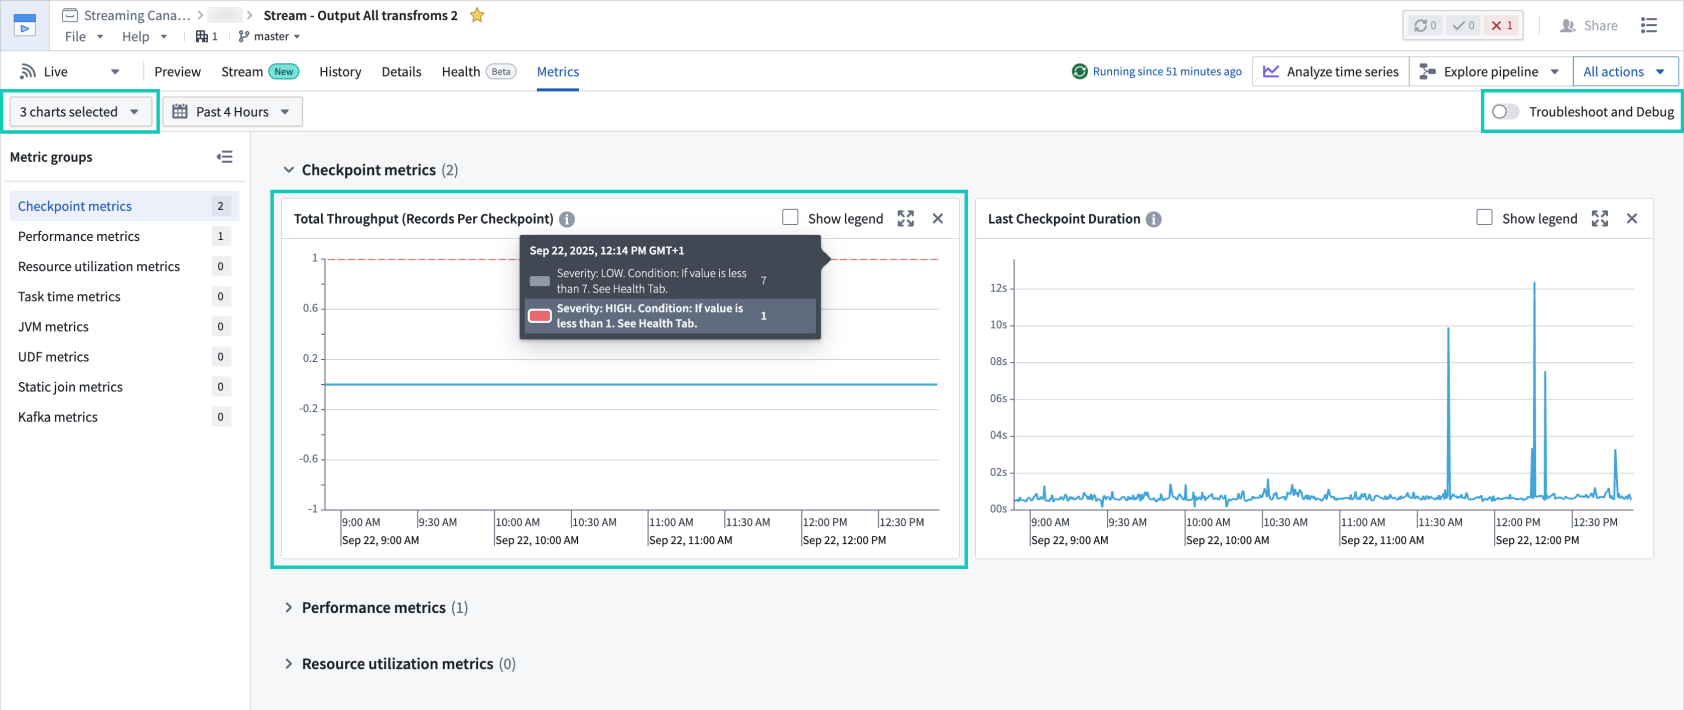
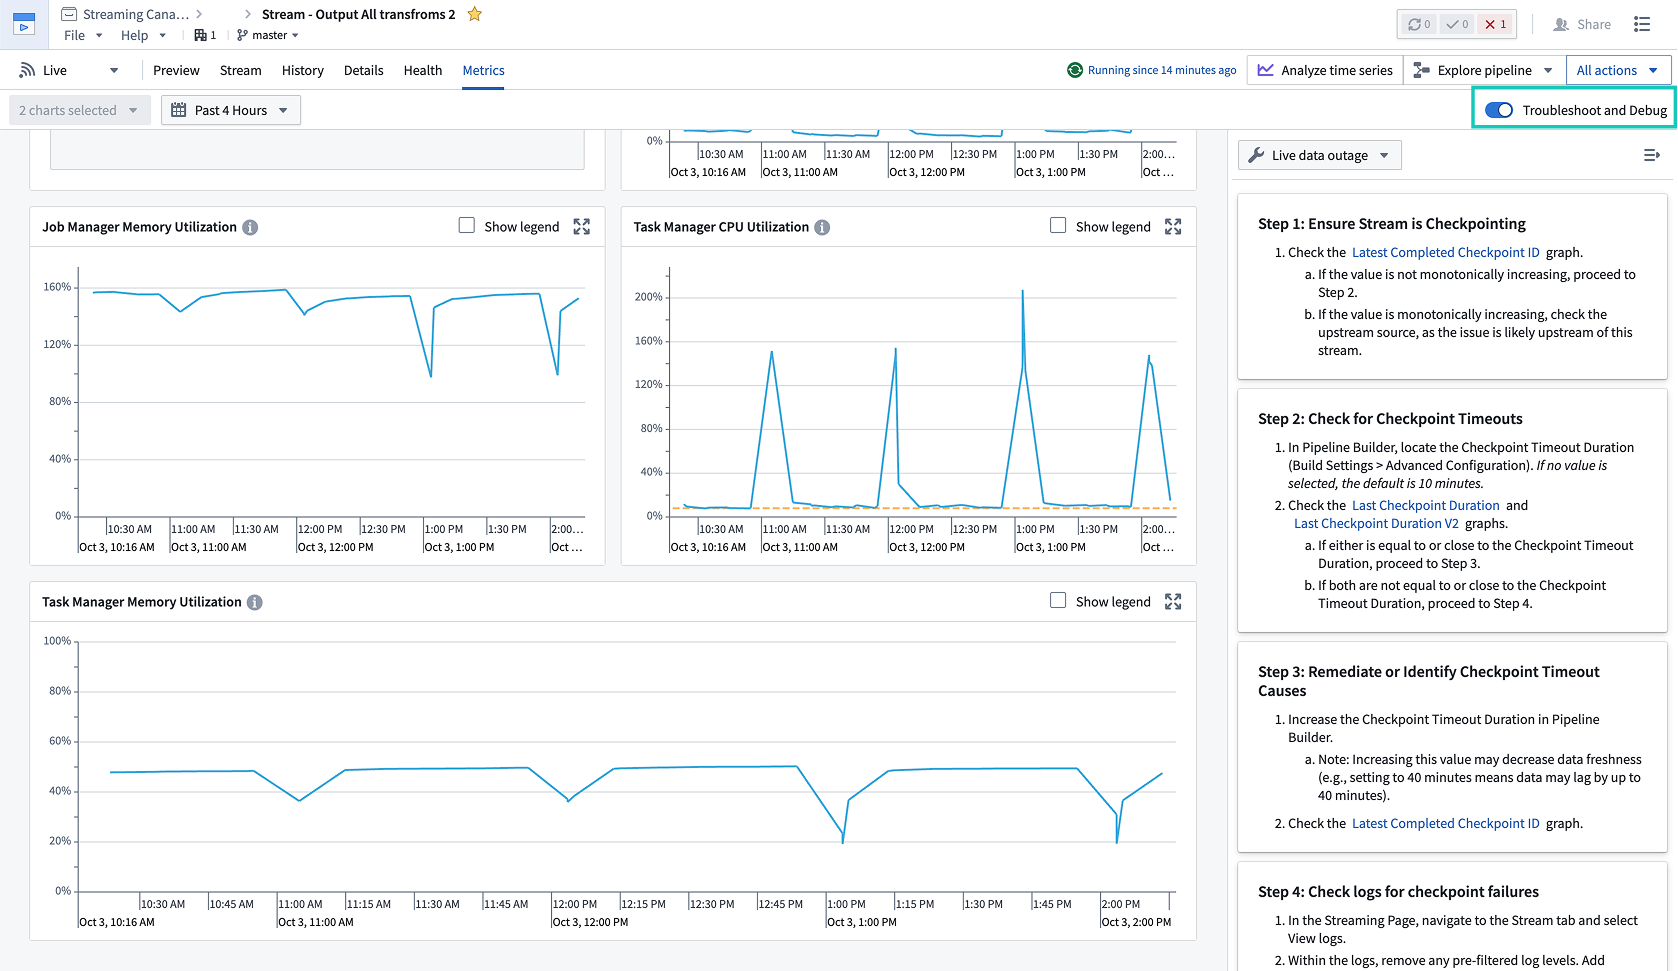
Troubleshoot and Debug mode
You can enable a dedicated troubleshooting mode using the toggle at the top right of the page. This mode provides a step-by-step walkthrough to debug stream outages. Select the in-line metrics tags from the right side panel to highlight the corresponding chart and easily locate the source of the issue.
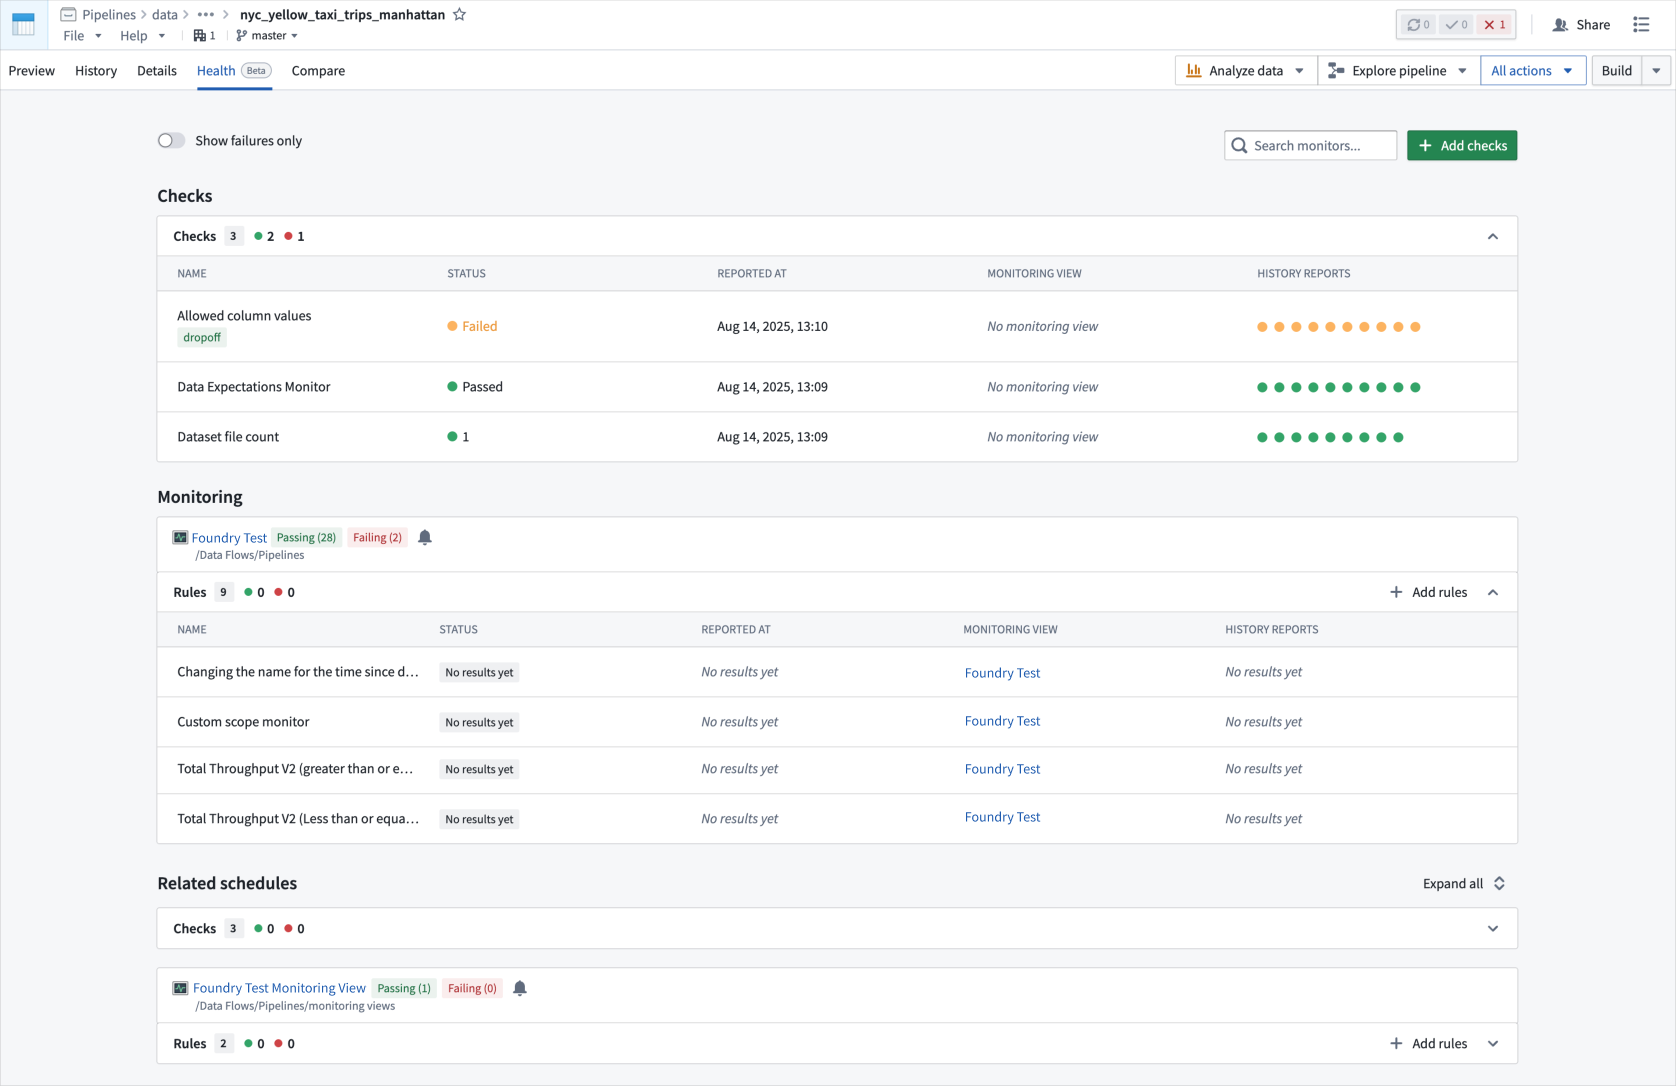
Health
The Health tab provides tools to monitor data health. The page displays health checks on the specific resource, monitoring rules on the resource grouped by specific monitoring view, and related schedule builds that affect the resource. Selecting any row reveals historical reports for the health checks and monitoring rules.
In streaming datasets, the Health tab will only appear when the view is set to Archive. The checks will then refer to the archive dataset rather than the stream.
Compare
Use the Compare tab to compare two different datasets. Select the tab and choose a dataset to compare with. The Compare tab can be used in several ways:
- Compare two separate datasets to understand their differences.
- Compare a dataset to an older transaction of the same dataset to see how it changed over time.
- Compare the original version of a dataset with a different branch to see how merging that branch will affect the dataset.
In streaming datasets, the Compare tab will only appear when the view is set to Archive. You will then be able to compare the archive dataset with other non-streaming datasets.
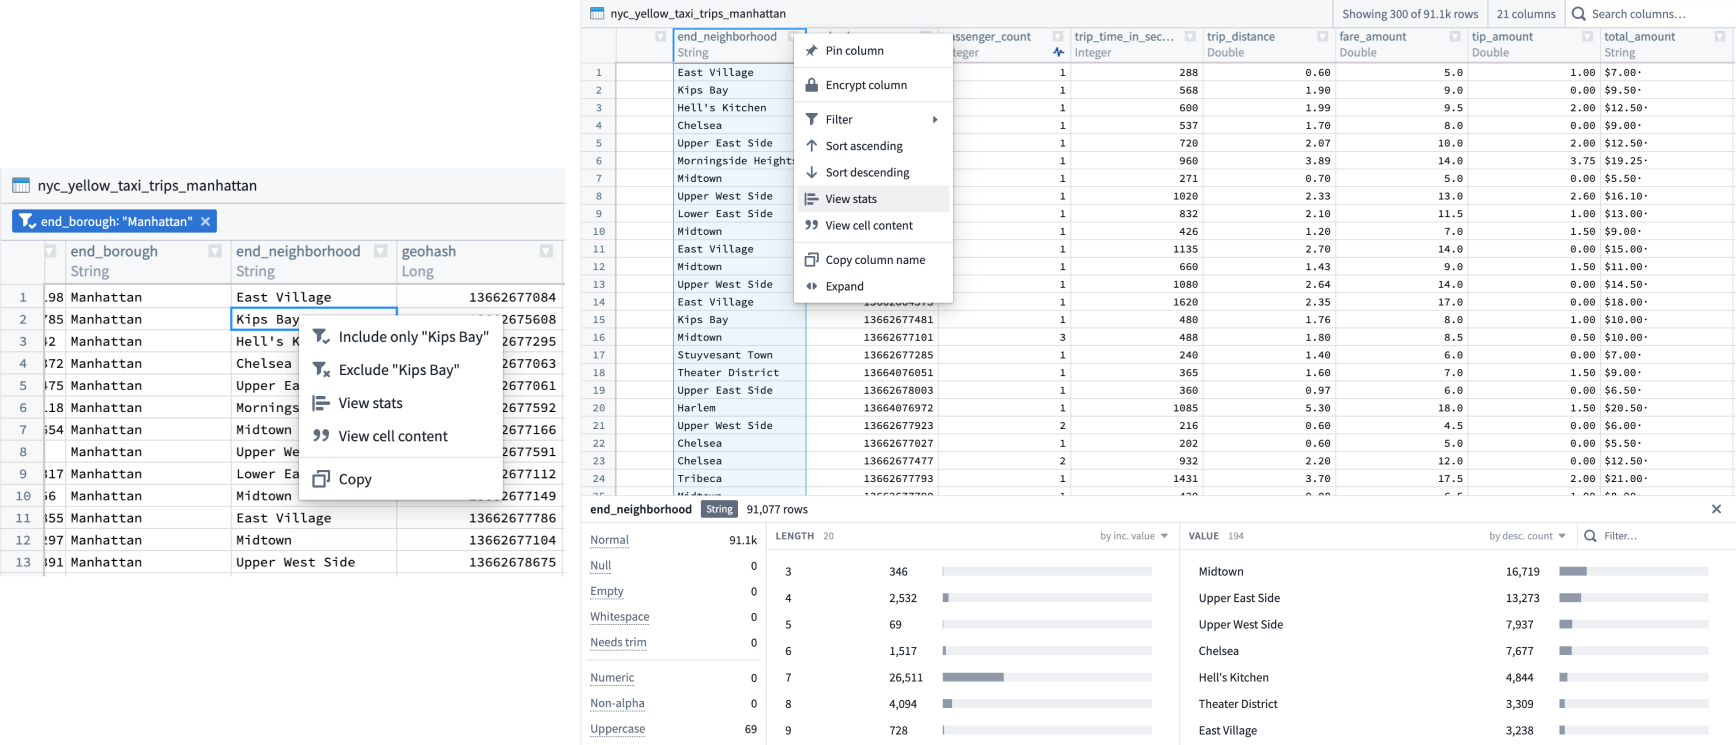
4. Preview table
Use the preview table to understand the structure of the data and to quickly explore the values in the dataset.
By default, the preview table will show a limited sample of the data; the exact number of rows is displayed in the preview table header. However, any action taken on the data, such as filtering or sorting, will apply to the full dataset and increase the preview sample size. Depending on the number of rows, you may not see the entire dataset in the preview.
The preview table provides several useful capabilities:
- Select a column’s menu to sort, filter, and generate charts over the column data.
- Select an individual cell to exclude or include only the selected value from the preview.
- Report and view issues on individual columns.
- Search for specific column names.
The data preview table for streaming datasets provides a small sample of recently streamed rows. It will update automatically when set to Live updates. Sorting, filtering, and charting are only available when the page is set to Archive and will represent only the state of the archive dataset.
Upload files manually
In Dataset Preview, you can upload files of the following types directly into a dataset: .csv, .tsv, .xls, .xlsm, and .xlsx.
For .csv and .tsv files, Foundry will attempt to infer the schema of the new file. If the filename and schema of the new file are identical to a previous upload, you can update data in the existing dataset. If the filename is different from previous uploads, you can append data to an existing dataset.
The following steps apply to uploading all file types:
- Navigate to your preferred folder and create a dataset.

- Drag and drop the file into the dataset preview window.
5. Actions
The All actions dropdown menu provides quick access to Foundry tools and operations, allowing you to analyze, explore, transform, and manage the data. Some actions, such as Analyze (in Contour) and Build, are surfaced outside the actions menu for quick access.