- Capabilities
- Getting started
- Architecture center
- Platform updates
Ontology tab
The Ontology tab in the Pilot workspace displays an interactive graph of the ontology entities that Pilot created or reused for your application. Use this tab to review your data model, inspect entity details, and preview seed data.
Ontology graph
The ontology graph is an interactive visualization that displays the following information:
- Object type nodes: Represent the core entities in your application, displayed with their properties.
- Action type nodes: Represent the actions available for each object type.
- Link type edges: Show relationships between object types.
You can pan, zoom, and select nodes to explore the graph. The graph uses an automatic hierarchical layout to arrange nodes and edges.
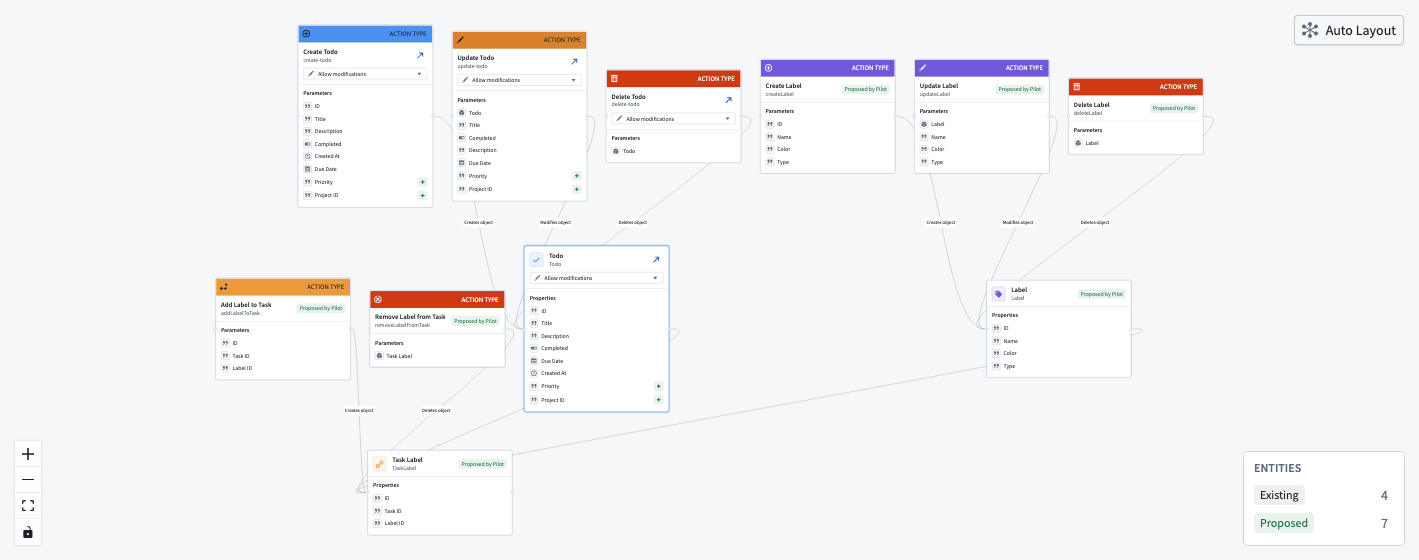
Entity status legend
The ontology graph includes a status legend that indicates the state of each entity:
- Existing: Entities from the ontology that Pilot is reusing, with any modifications Pilot has made.
- Proposed: Entities that Pilot created in the current session.
You can filter the graph by entity status to focus on specific categories.
Data preview
Select an object type node to open the data preview panel. The data preview panel contains the following details:
- The properties defined for the object type
- Sample records from the seed data generated by Pilot
- The number of records available
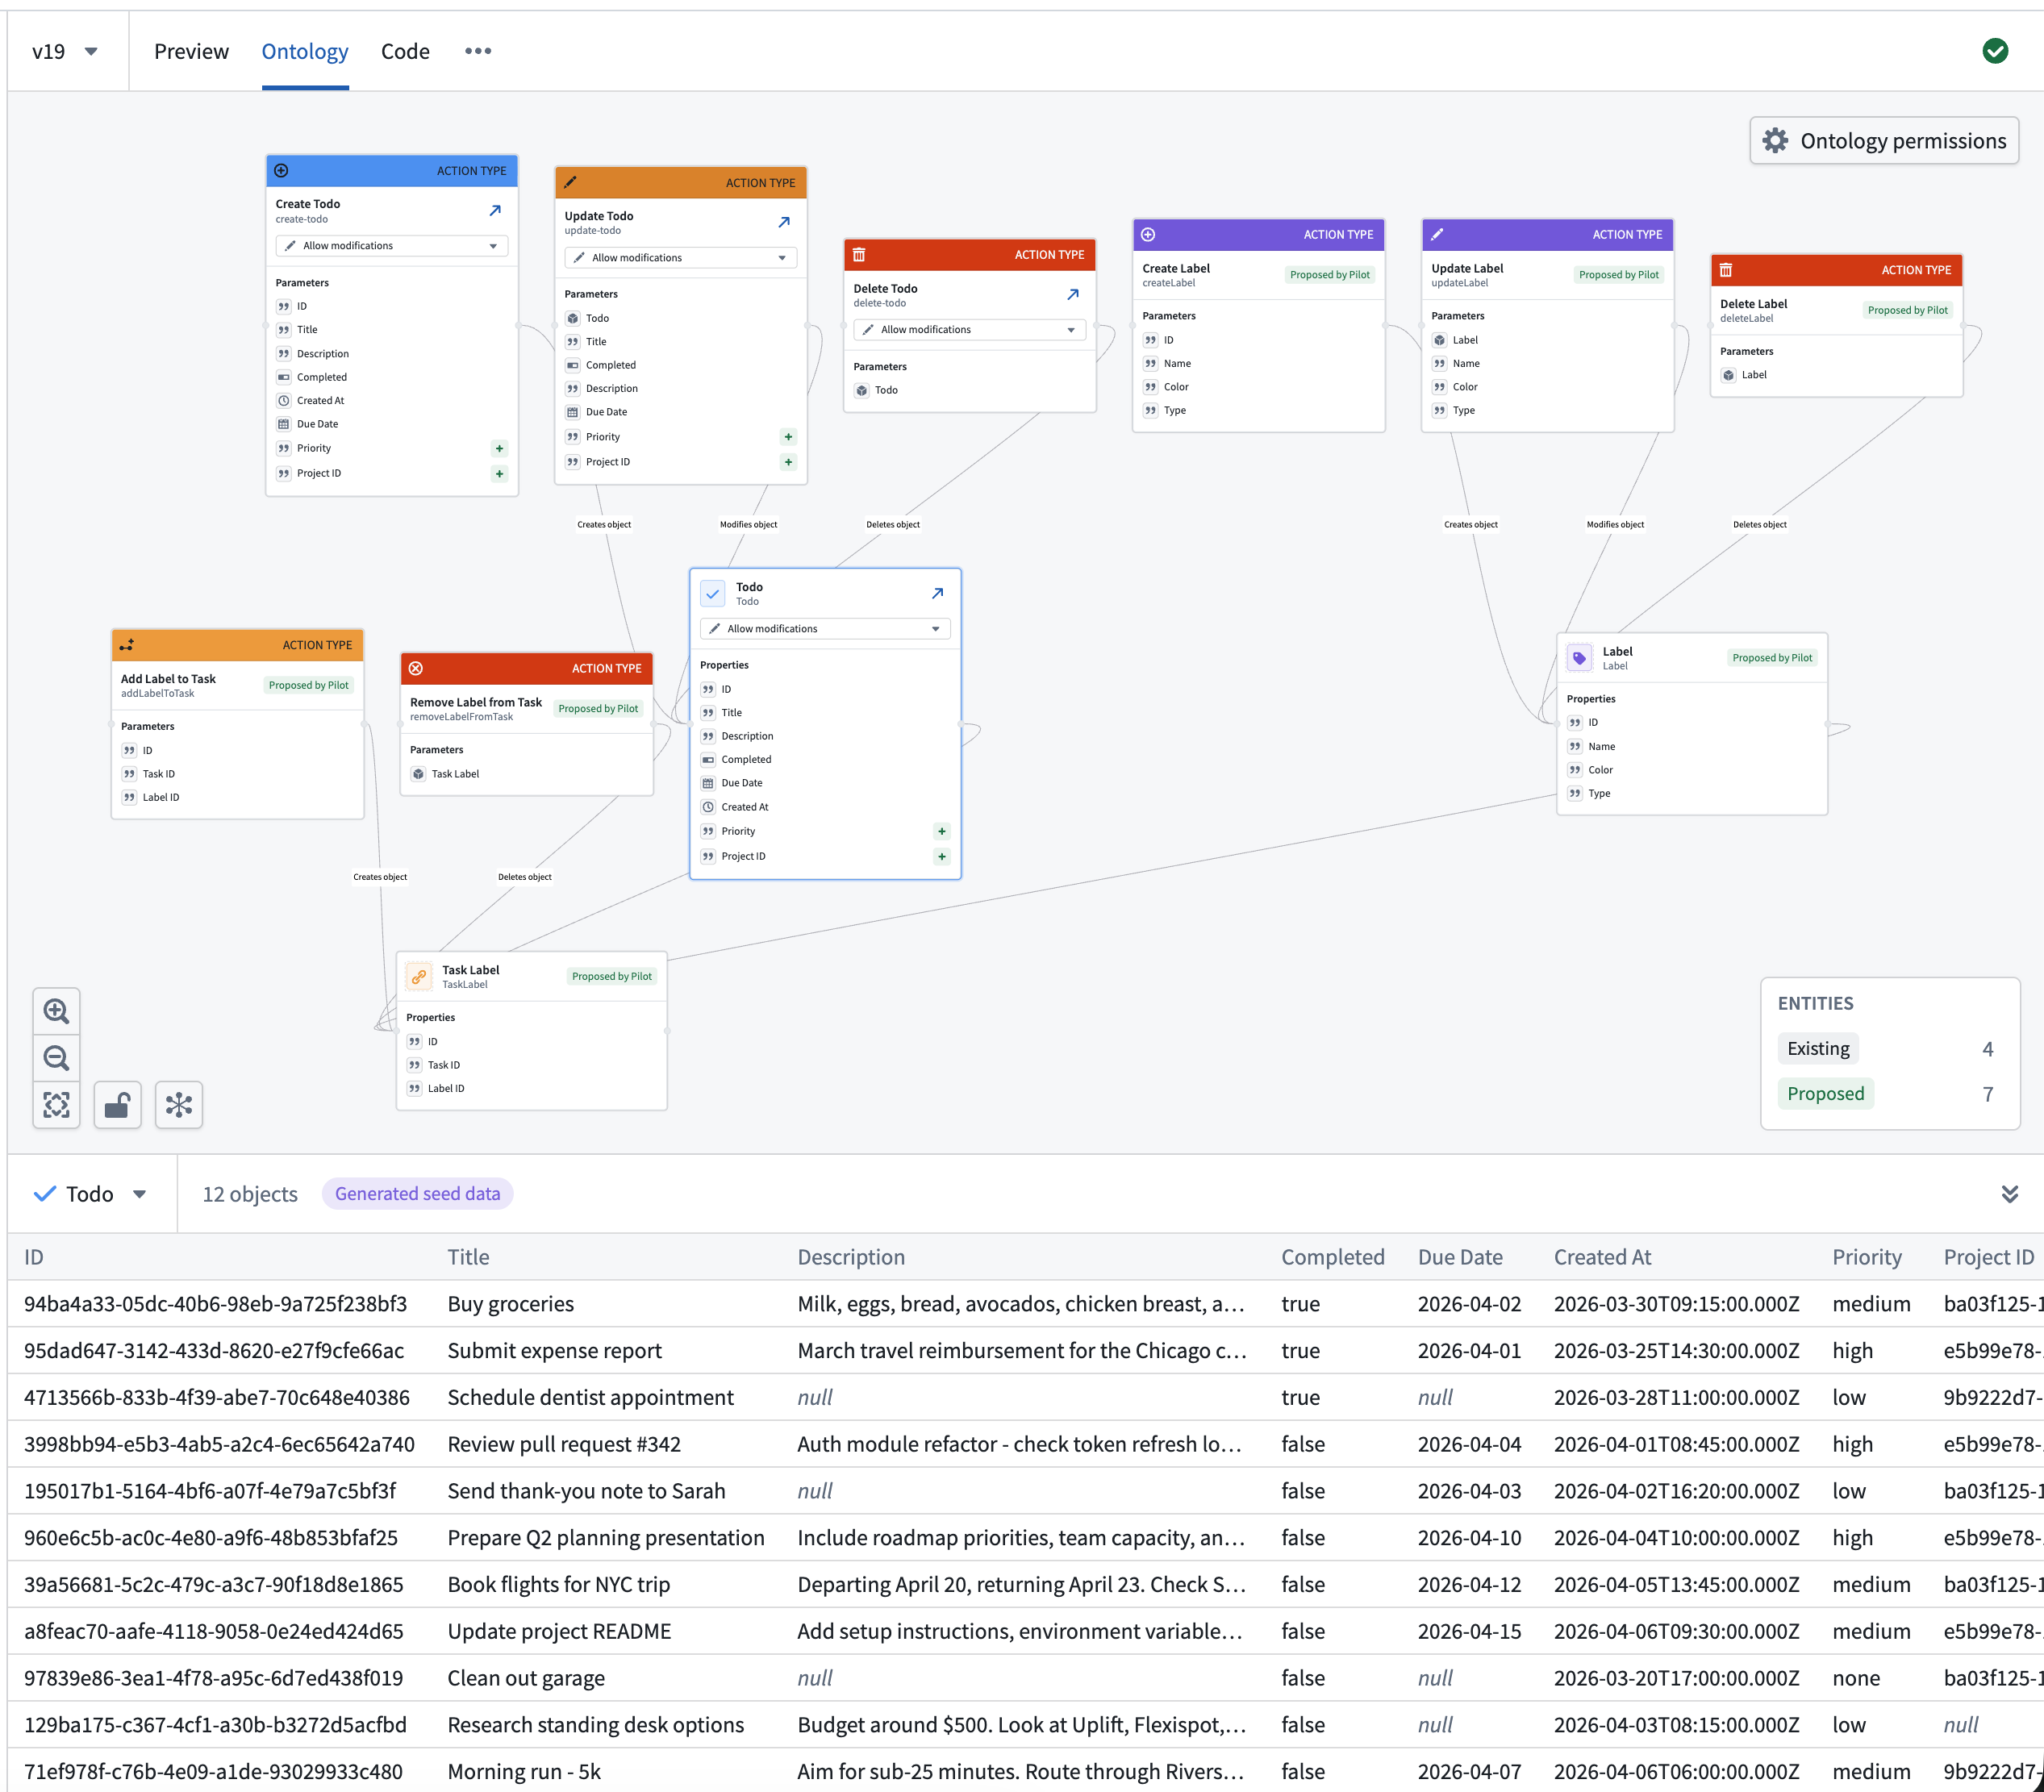
Use the data preview to verify that the generated seed data matches your expectations. If the data does not look correct, ask Pilot to regenerate or adjust seed data in the chat panel.
Modify the ontology through chat
You can modify the ontology by typing instructions in the chat panel. Pilot uses a specialized ontology architect agent to process ontology changes. Common modifications include the following:
- Adding a new property to an object type:
Add a "due date" property to the Task object type - Creating a new object type:
Create a Category object type with a name and description - Adding a relationship:
Link each Task to a Category - Changing a property type:
Change the priority property from a string to an enum with values High, Medium, and Low
After Pilot applies the changes, the ontology graph updates to reflect the new structure. The app builder agent then updates front-end code to use the modified ontology.