- Capabilities
- Getting started
- Architecture center
- Platform updates
The Pilot workspace
The Pilot workspace is where you interact with AI agents to build, preview, and refine your application. This page describes each area of the workspace.
Workspace layout
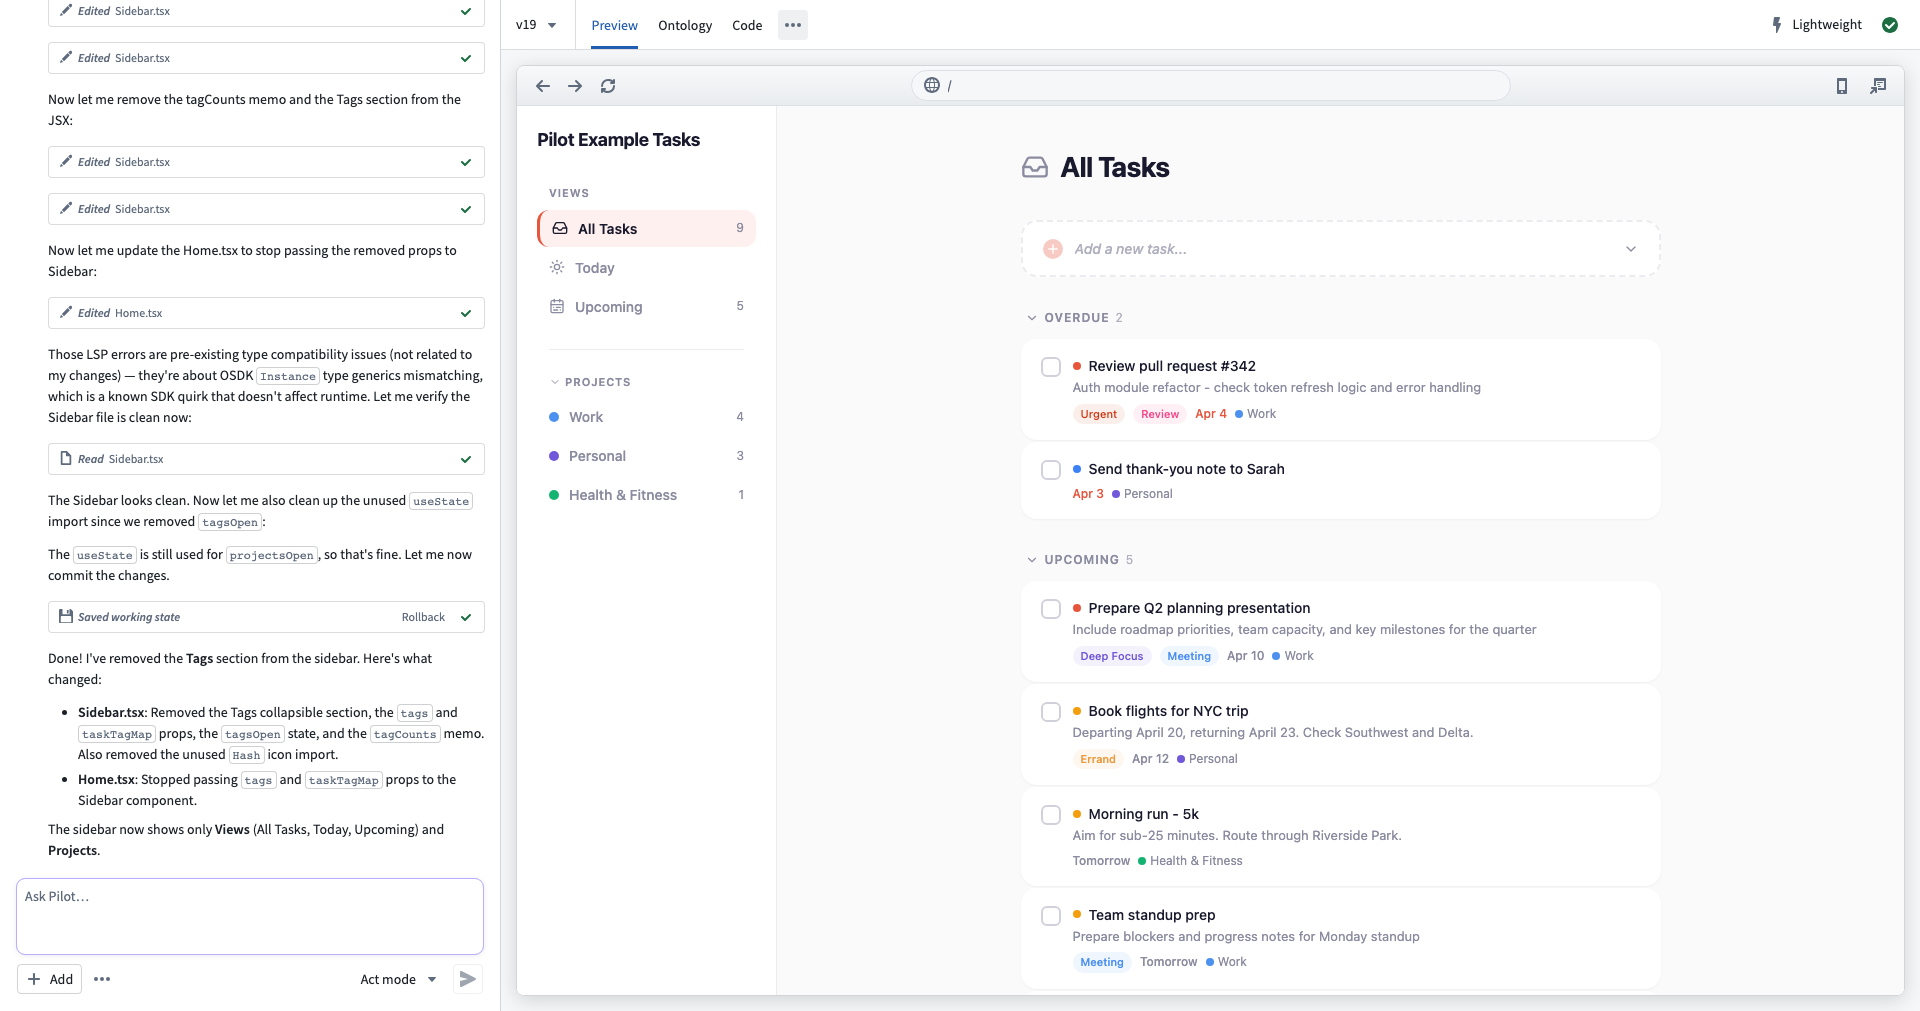
The workspace is divided into two main areas:
- Chat panel (left): The AI chat interface where you provide instructions, view agent activity, and manage context attachments
- Application view (center): Tabbed views for previewing, inspecting, and debugging your application
Chat panel
The chat panel is your primary interface for communicating with Pilot. It includes the following:
- Message history: Displays your prompts, agent responses, tool executions, and reasoning steps. Pilot shows what each agent is doing in real time, including file reads, edits, and bash commands.
- Prompt input: A text area at the bottom where you can type instructions. Select Send or press
Enterto submit your prompt. - Add menu: Select Add to attach context to your prompt, including existing ontology entities, documents, and images. See Provide context and attachments for details.
- More menu: Select the More menu for additional options, including clearing the chat history and, in some environments, model selection. If model selection is unavailable there, use the welcome-screen selector before creating an application. For details on available models, see Models and agent modes.
When Pilot spawns a specialized subagent such as the designer or ontology architect, the chat panel displays a separate thread for that subagent's activity. You can switch between the main thread and subagent threads to follow their work.
Preview tab
The Preview tab displays a live preview of your generated application running inside the provisioned container. The preview updates automatically when Pilot modifies application code.
The Preview tab includes a browser-style toolbar with the following features:
- Navigation buttons: Back, forward, and reload controls for navigating within the preview.
- URL bar: Displays the current preview URL.
- Device selector: Switch between desktop, tablet, and mobile viewport sizes to preview your application at different screen sizes. The preview auto-scales to fit the selected device frame.
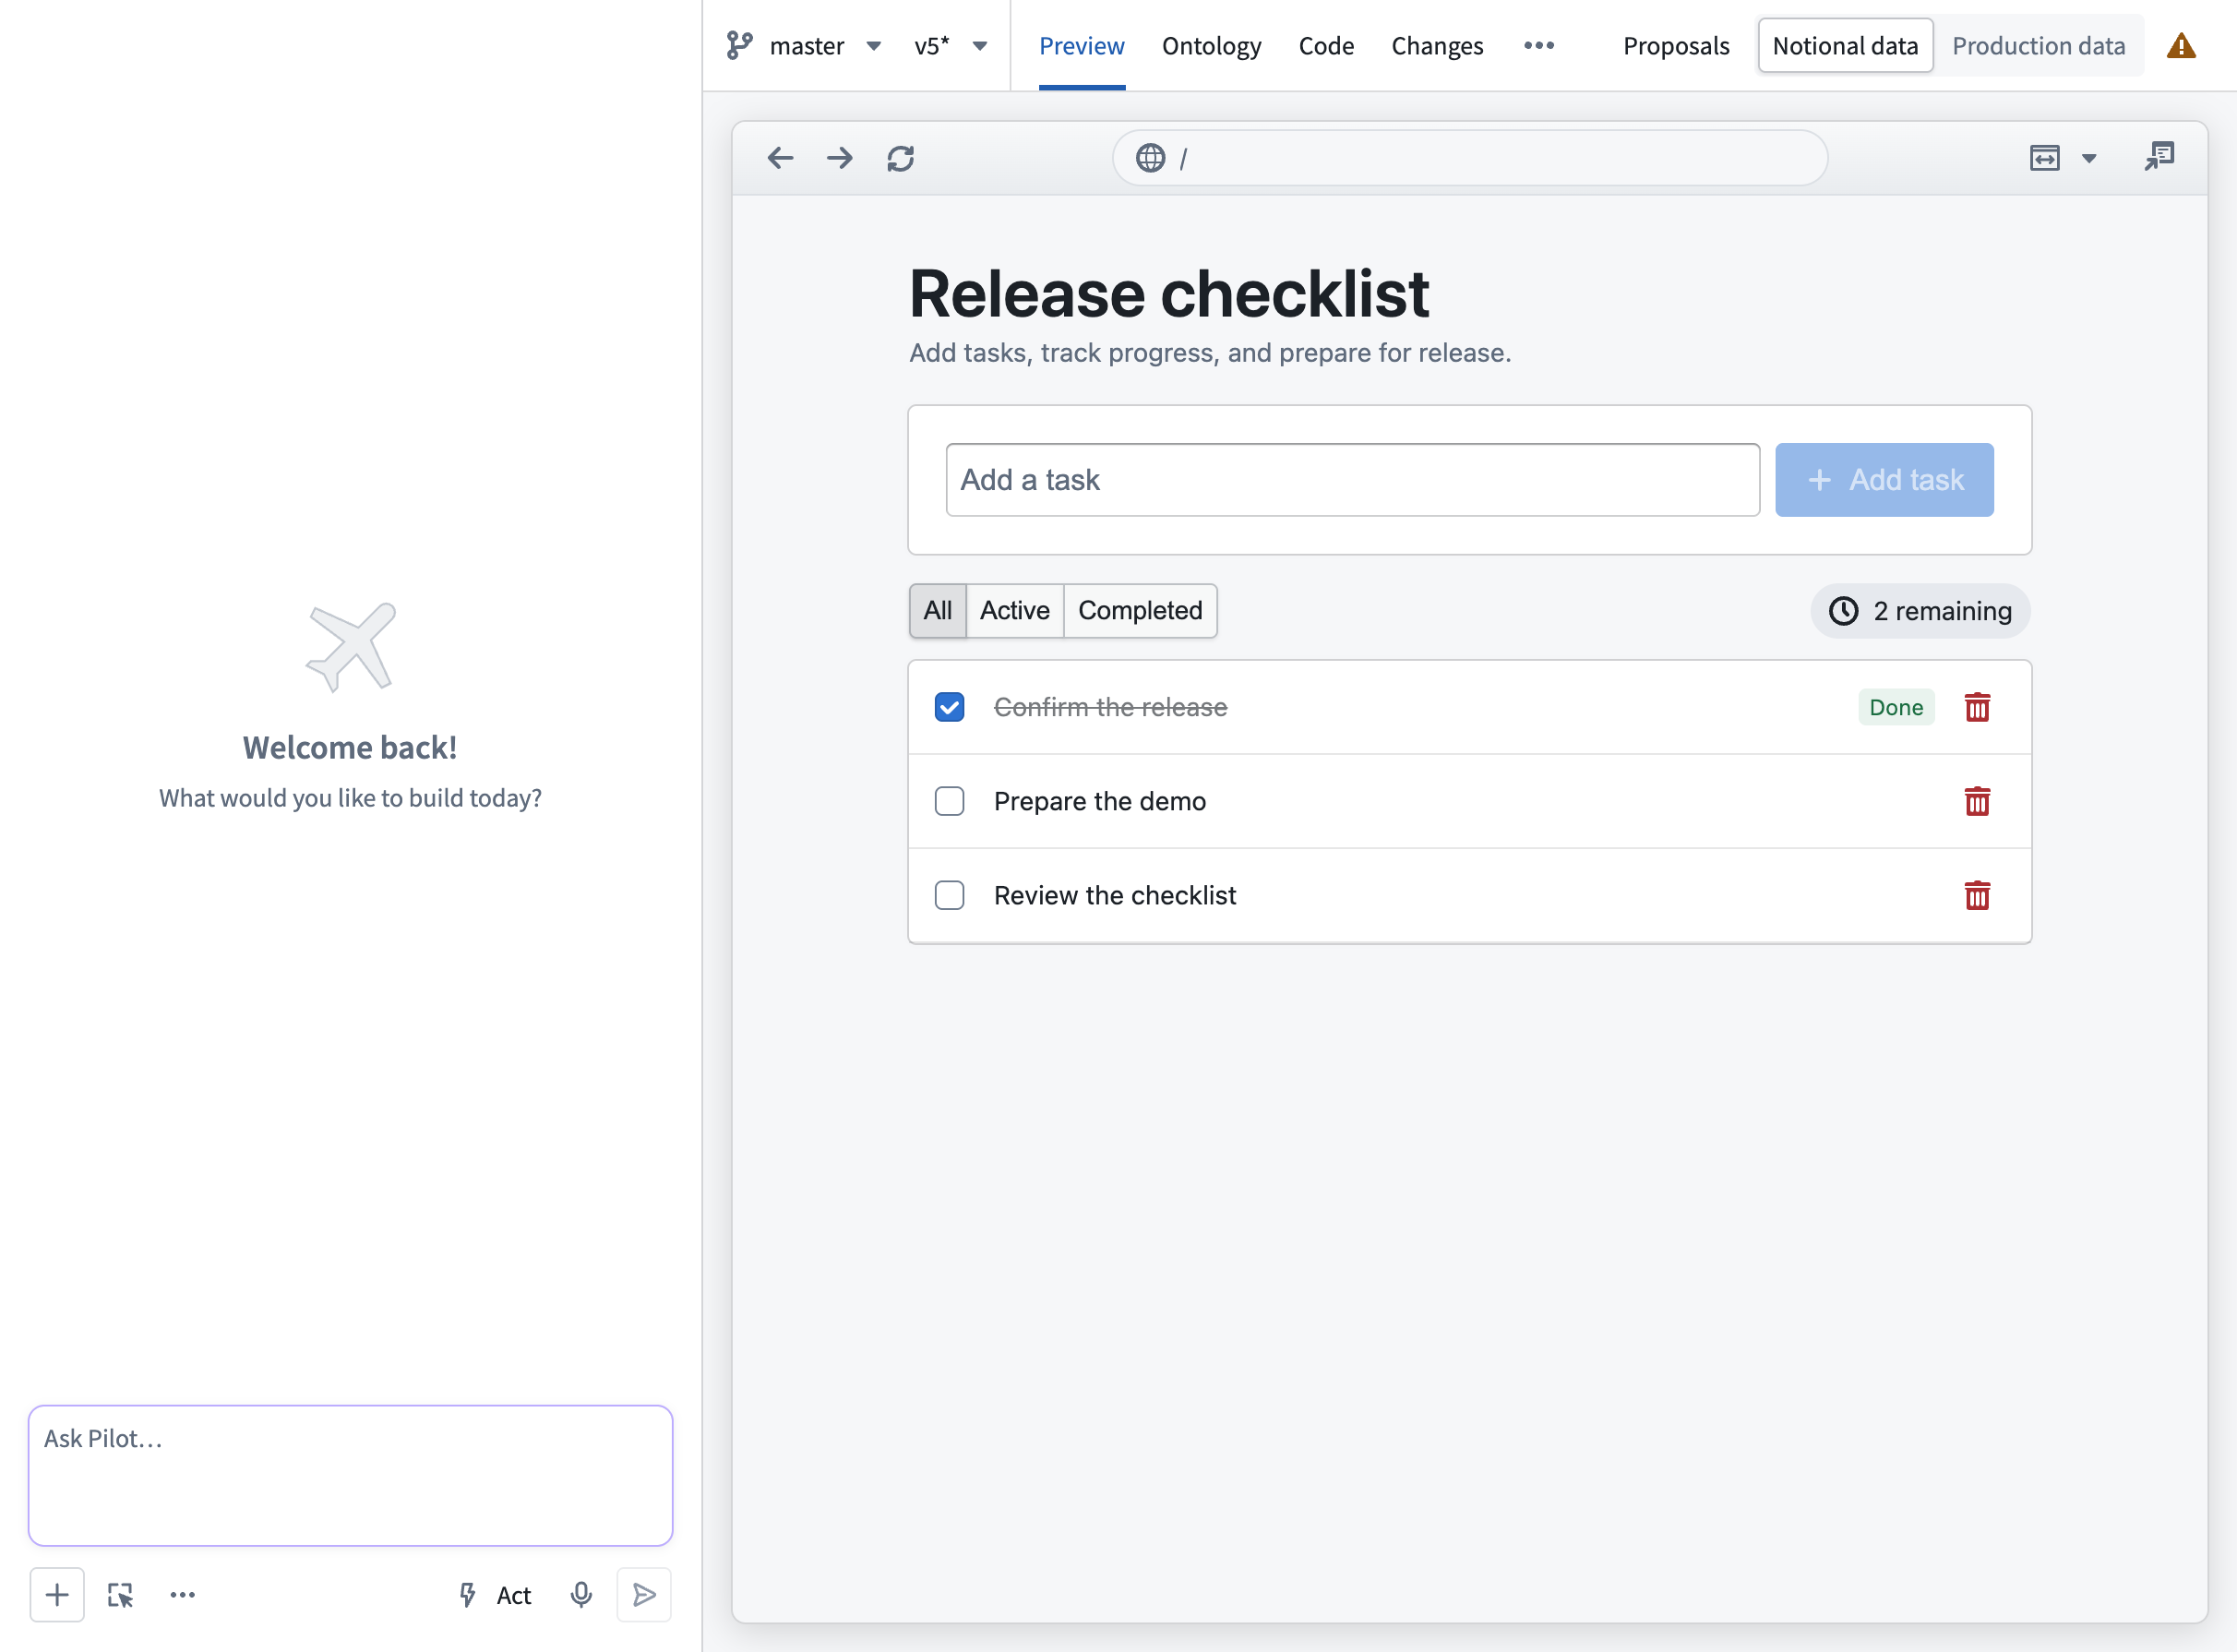
The preview can use seed data or real ontology data. Editor view can also use Production data when available. Check the data indicator before testing actions. On a deployment branch, schema changes are scoped to that branch; on Main, any actions are live ontology edits.
When you build a custom widget, the Preview tab renders your widget in the Workshop widget sandbox, so you can view it as it will appear once embedded. The widget preview does not include the browser-style navigation toolbar. If you change a widget's parameters or events, select Reload widget dev mode to apply the change to the running preview. See Build a custom widget.
Ontology tab
The Ontology tab displays an interactive graph of the object types, action types, and relationships that Pilot created for your application. For a detailed walkthrough, see the ontology tab documentation.
Code tab
The Code tab provides an embedded code editor where you can view and edit the source code for your generated application. The editor uses the same interface as Code Workspaces. You can also make code changes through the chat interface.
More tab (...)
The More (...) tab contains Pilot diagnostics, where Pilot logs displays container logs from the Pilot development server. Use this tab for the following actions:
- Monitor build output and compilation status.
- Debug runtime errors.
- View dependency installation progress.
The view shows the latest 500 lines. Select Copy logs to copy the displayed content, or follow the link to Code for full logs. Repository capabilities lists the features supported by the repository.

Content header
The content header sits above the tab views and provides the following features:
- Editor/Deploy toggle: Switch between building the application and preparing a release. For details, see Deploy an application.
- Code branch selector: Create or switch code branches.
- Version selector: View saved versions and save or roll back changes. See Branches, changes, and proposals.
- Tab navigation: Switch between Preview, Ontology, Code, and Changes. Use Proposals to find code proposals.
- Status indicator: Select to open the status monitoring popover.
Editor and deploy views
The Editor/Deploy toggle in the content header switches between building and releasing your application.
- Editor view: The default view while building. Preview with seed data generated inside the Pilot container, or select Production data when available.
- Deploy view: Shows your application against real ontology data on a branch. Use this view to validate that your application works correctly with production data before releasing.

For a complete walkthrough of the deployment process, see Deploy an application.
Where supported for applications and custom widgets, the editor shows a Notional data / Production data toggle. This toggle switches the preview between locally generated seed data and real ontology data as you build. Previewing production data does not by itself share records with application-building agents. A separate, gated analysis workflow is described in Work with data. For the widget workflow, see Build a custom widget.
Status monitoring
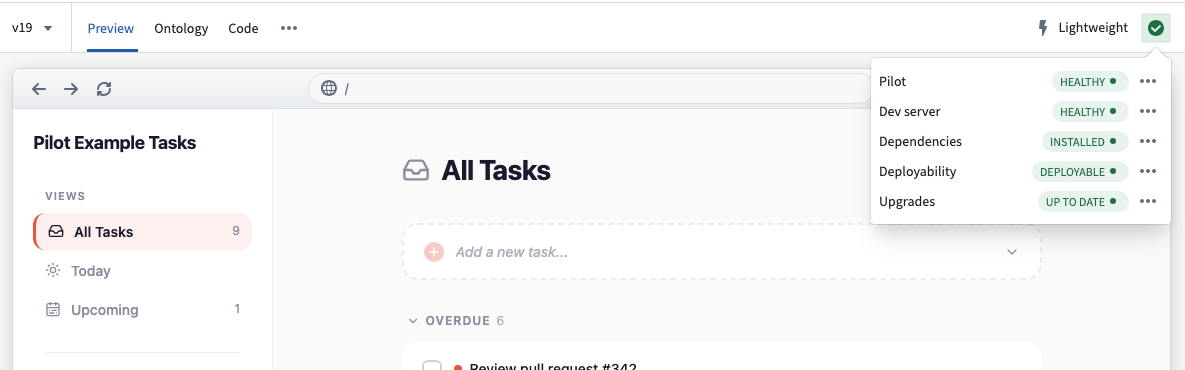
The status indicator in the top-right corner of the content header shows the overall health of your Pilot session. Select it to open the status monitoring popover, which displays the following information:
- Pilot status: Whether the Pilot connection is healthy or disconnected.
- Development server: Whether the development server is running, inactive, or has build errors.
- Dependencies: Whether package dependencies are installed, installing, or failed.
- Deployability: The result of the Ontology deployment dry run, or Invalid Ontology if Pilot cannot load the local Ontology definition. Check the Ontology tab separately for type-checking and edit-permission errors, which can remain even when this status is Deployable. Application build success and release CI checks are separate.
- Upgrades: Whether dependencies are up to date or outdated.
Available actions depend on the issue and branch state. They include Reload frame, Restart dev server, and Upgrade with Pilot. For most problems, you can select Fix with Pilot to prompt Pilot to diagnose and apply a fix automatically.