- Capabilities
- Getting started
- Architecture center
- Platform updates
Visualize geospatial time series objects on a map
Now that the Ship object type has time series properties and geospatial track capabilities configured in Ontology Manager, you can visualize ship tracks on a map. The map you create will contain your Ship object type's objects as well as their location history as track geometries.
Part I: Add Ship objects to a new map
- Navigate to your project folder and create a new map.
- Select Add to map in the Layers tab of the left panel.
- Search for your
Shipobject type in the search bar or select it from the Object types list in the Objects panel. - Choose to Add all objects to your map from the bottom right corner.
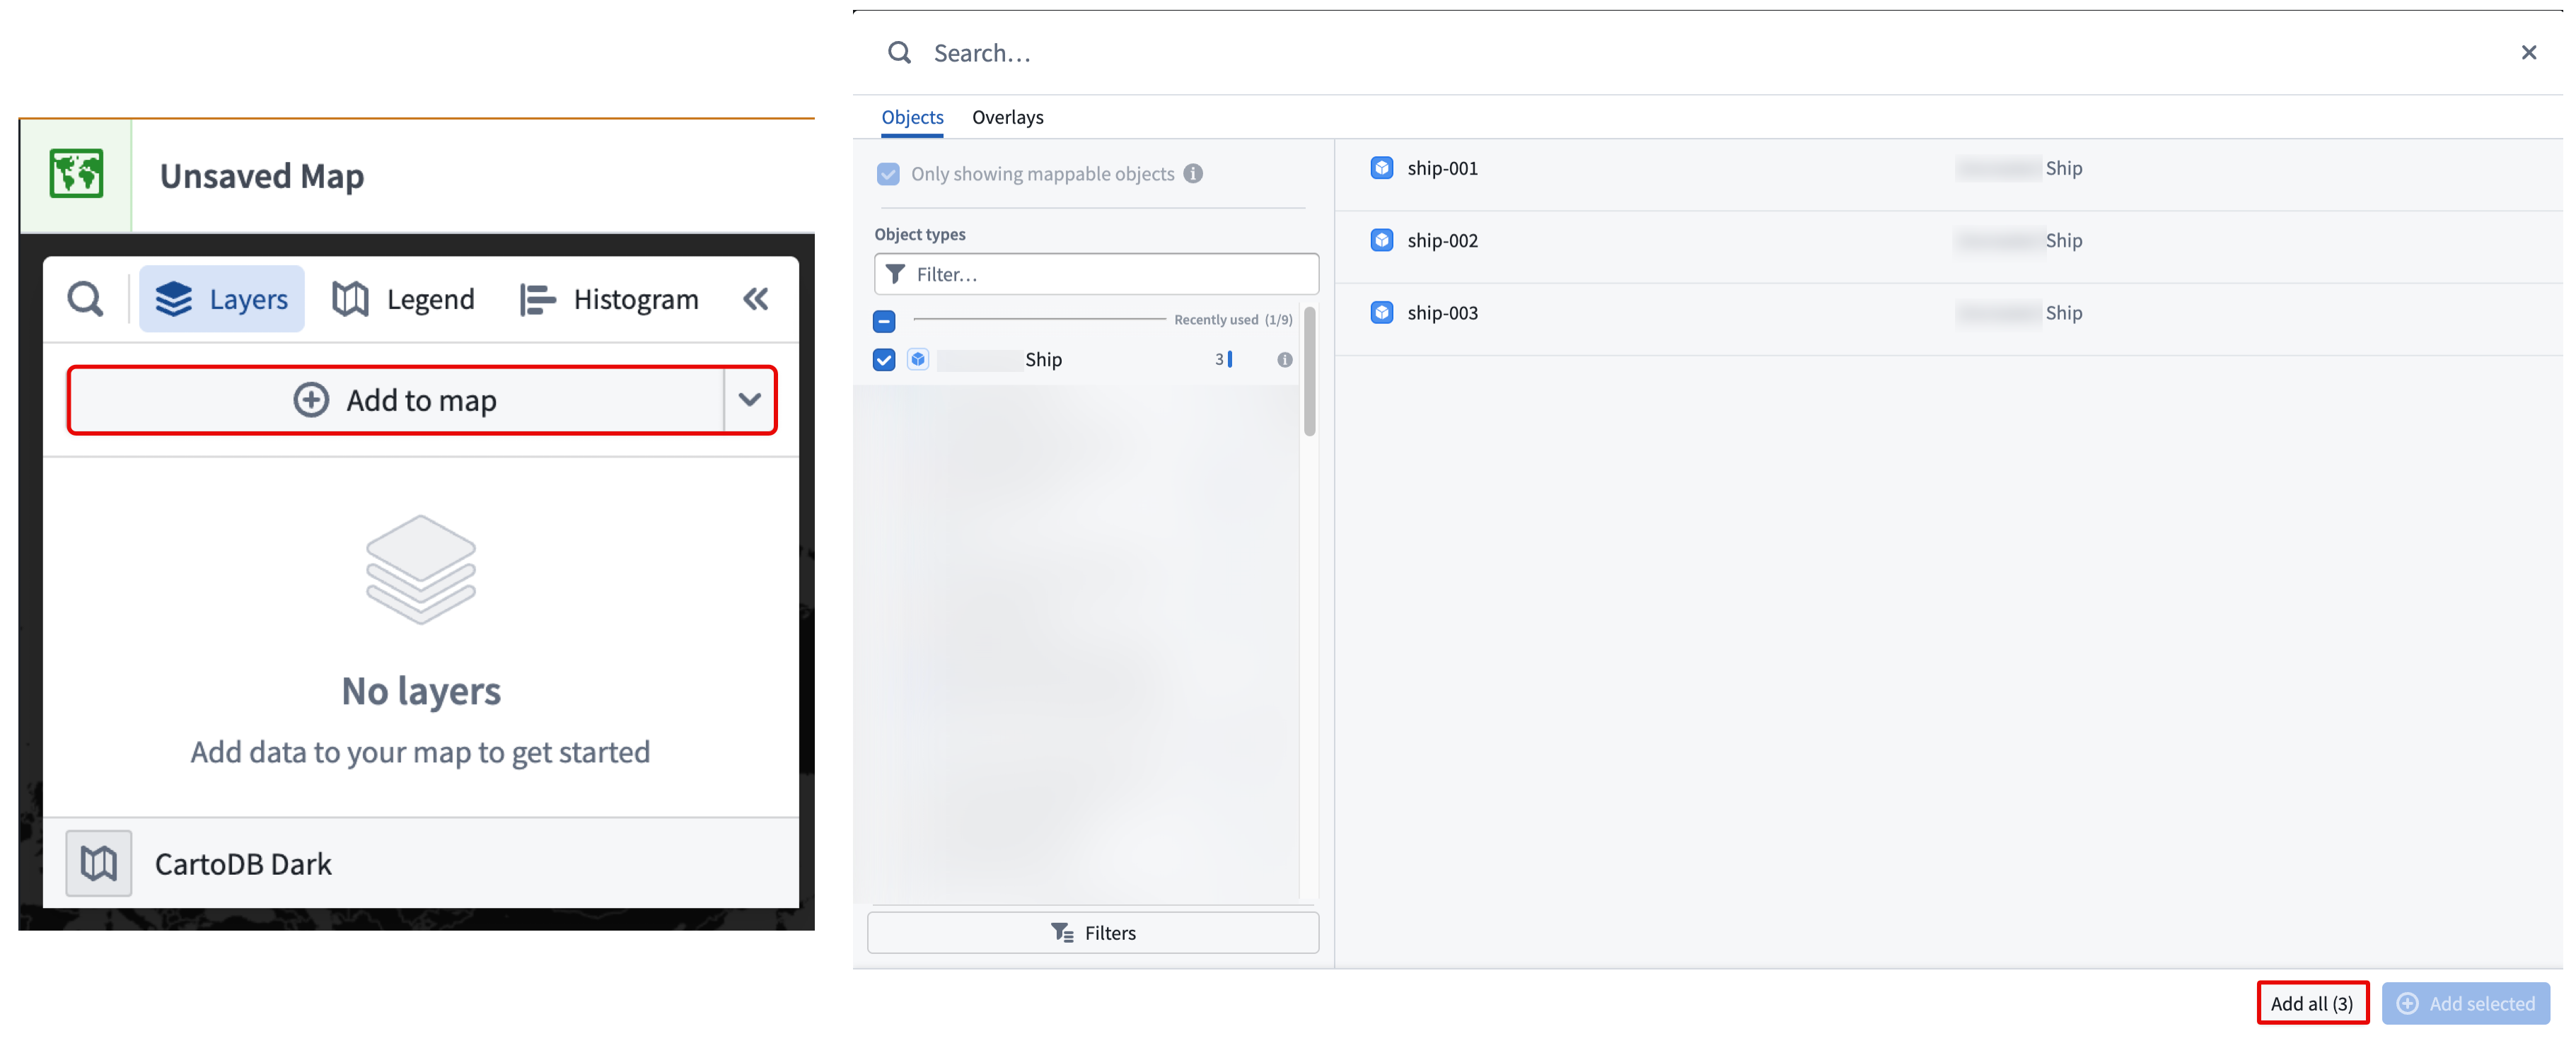
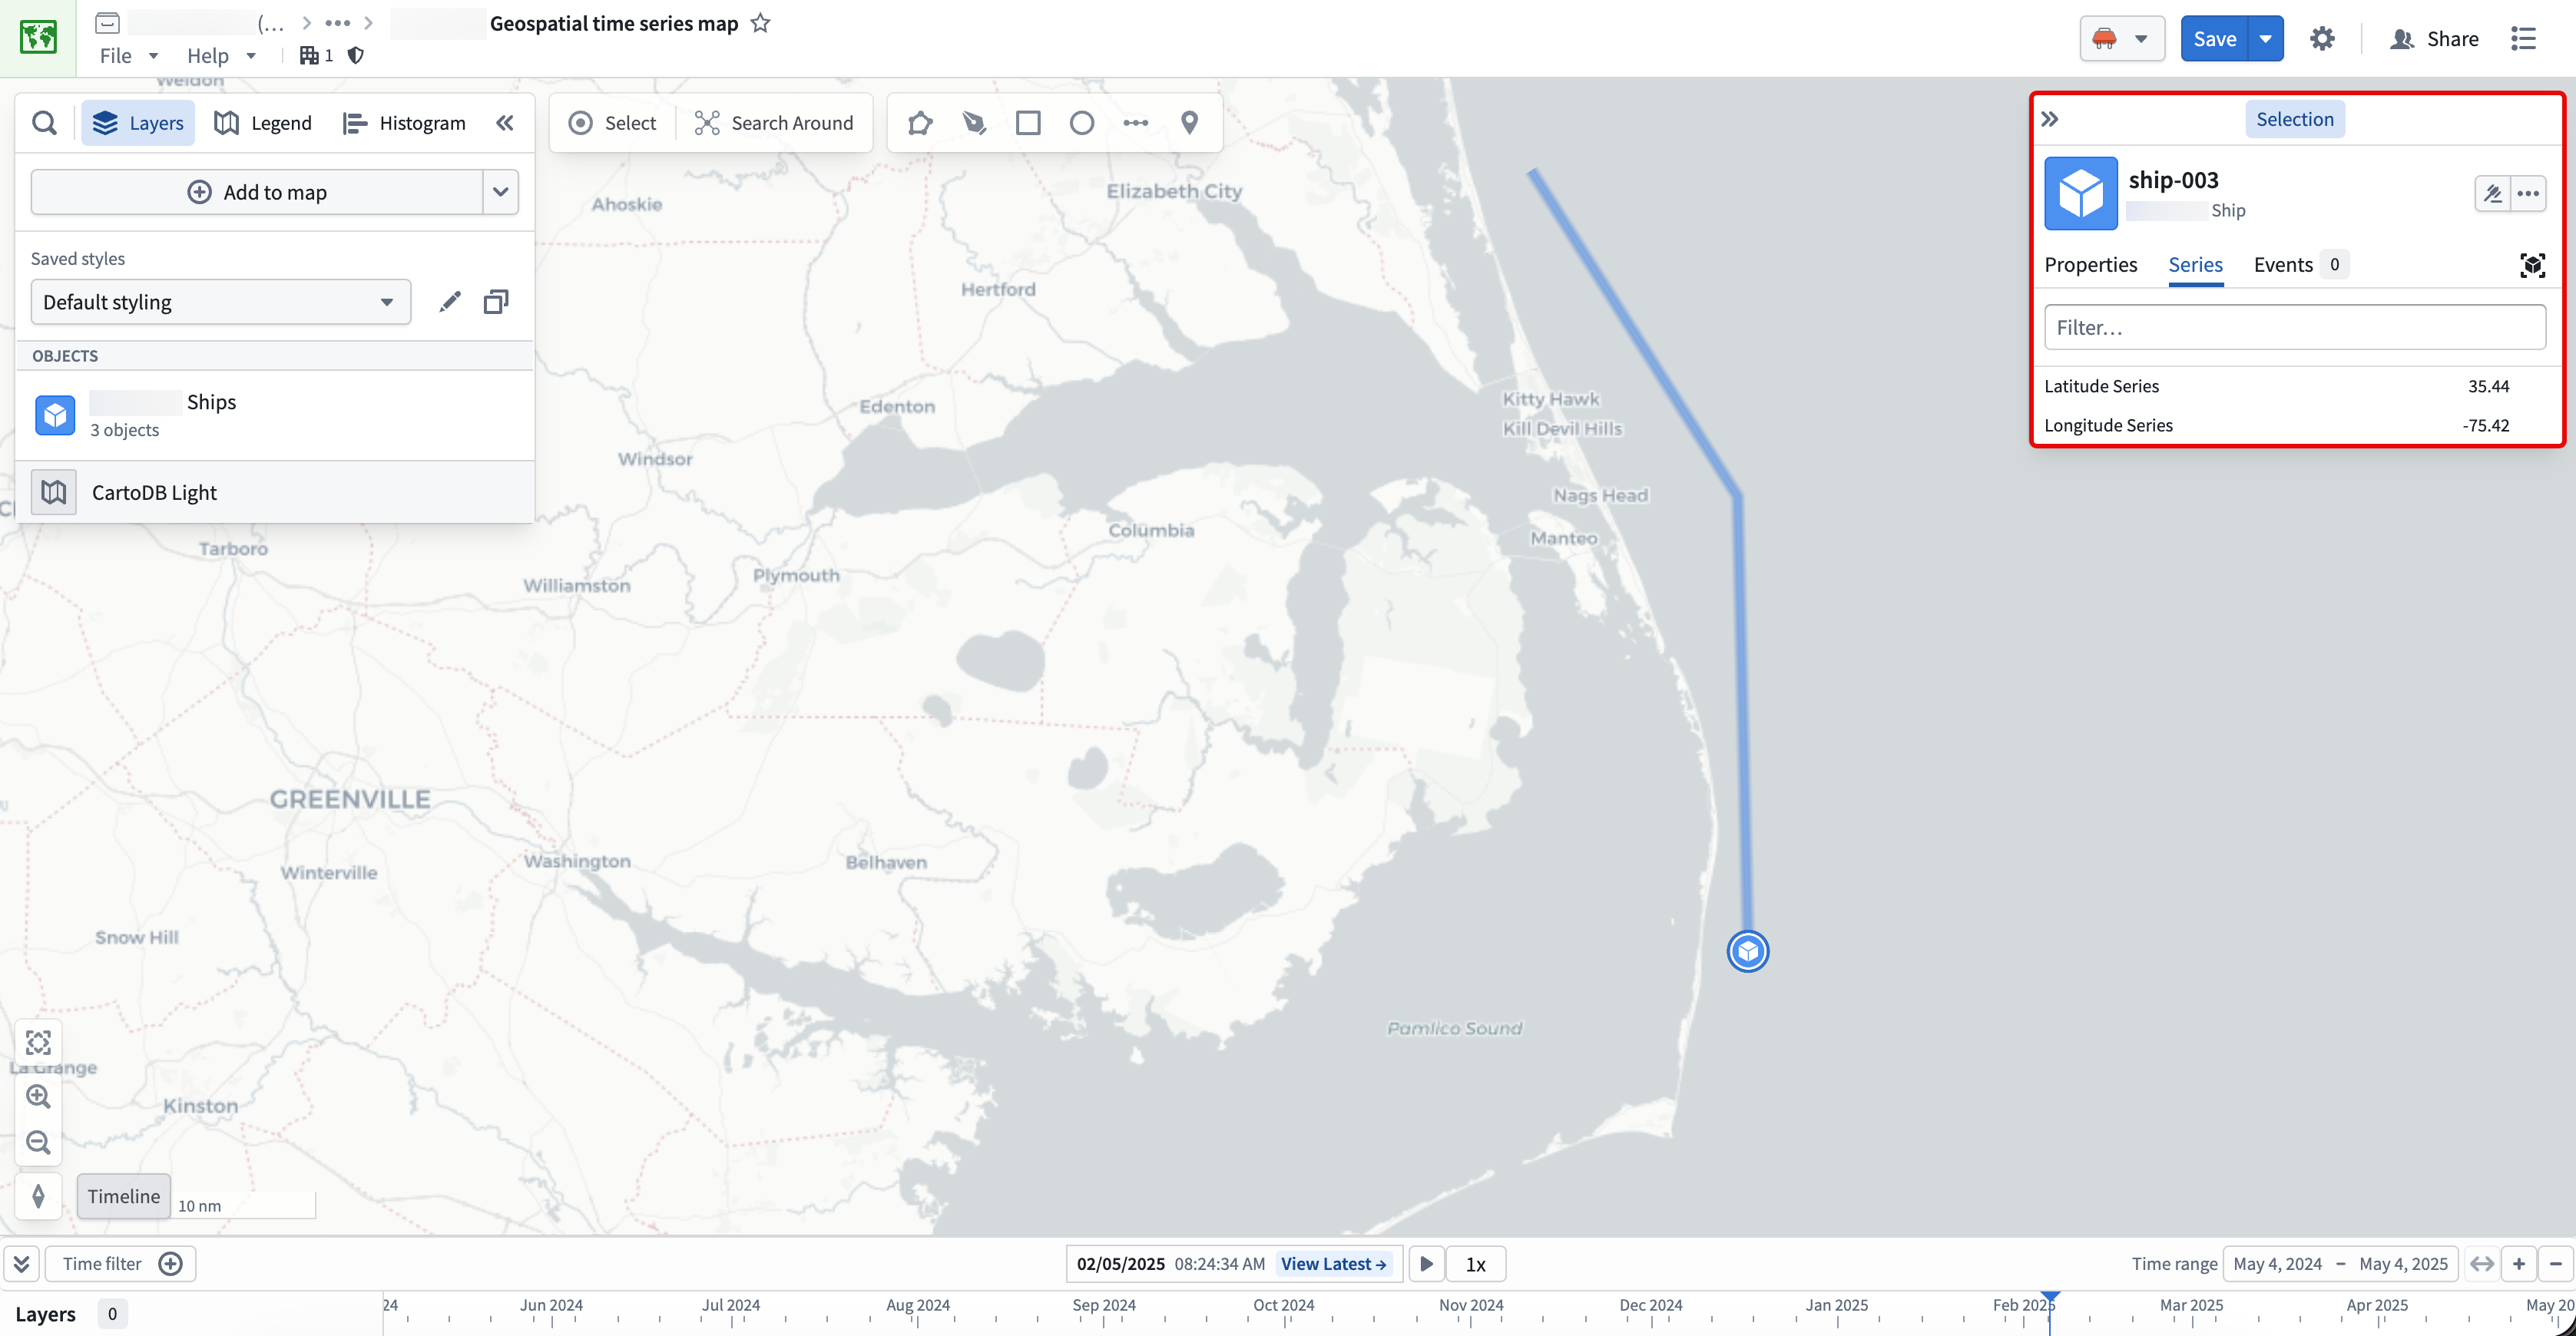
Your ship objects with geospatial data will render on the map, displaying their track geometry. Choose an object to launch the Selection panel on the right side of your map, where you can take actions on the object and configure its styling.
You can learn more about visualizing tracks and configuring track geometry in the Map application's existing documentation.
Part II: Add an object's time series properties to the map's timeline
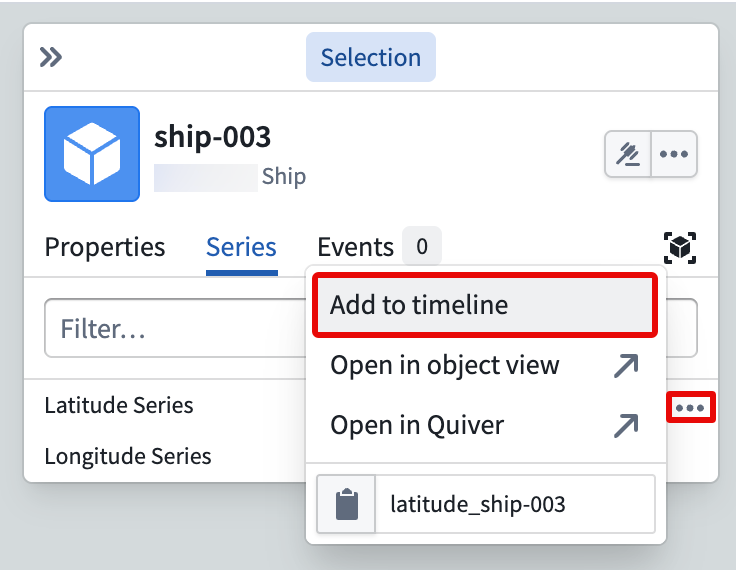
With a Ship object open in the Series tab of the Selection panel, hover over and select the ellipsis (...) icon on the right side of your Latitude Series and Longitude Series properties and choose Add to timeline. This enables you to view your time series properties on your map's timeline.
Select, hold, and drag your cursor along the timeline to observe the ship's position update on the map in real time.
Learn more about interacting with time and temporal data on your map.